Brazil Paper Products Market (2026-2032) | Growth, Size, Companies, Value, Trends, Outlook, Revenue, Industry, Analysis, Forecast & Share
Market Forecast By Type (Converted Paper Products, Unfinished Paper, Pulp Mills), By Applications (Writing Paper, Magazine Paper, Packaging Paper, Sanitary Paper, Other) And Competitive Landscape
| Product Code: ETC038563 | Publication Date: Jan 2021 | Updated Date: Jun 2026 | Product Type: Report | |
| Publisher: 6Wresearch | Author: Ravi Bhandari | No. of Pages: 70 | No. of Figures: 35 | No. of Tables: 5 |
Brazil Paper Products Market Summary
The brazil paper products market was estimated at USD 231 Million in 2025 and is projected to reach USD 275 Million by 2032, growing at a CAGR of 3.0% from 2026 to 2032.
Brazil Paper Products Market Year-wise Growth Rate and Key Drivers
This graph highlights how the Brazil Paper Products Market has steadily grown over the years, supported by major growth factors.
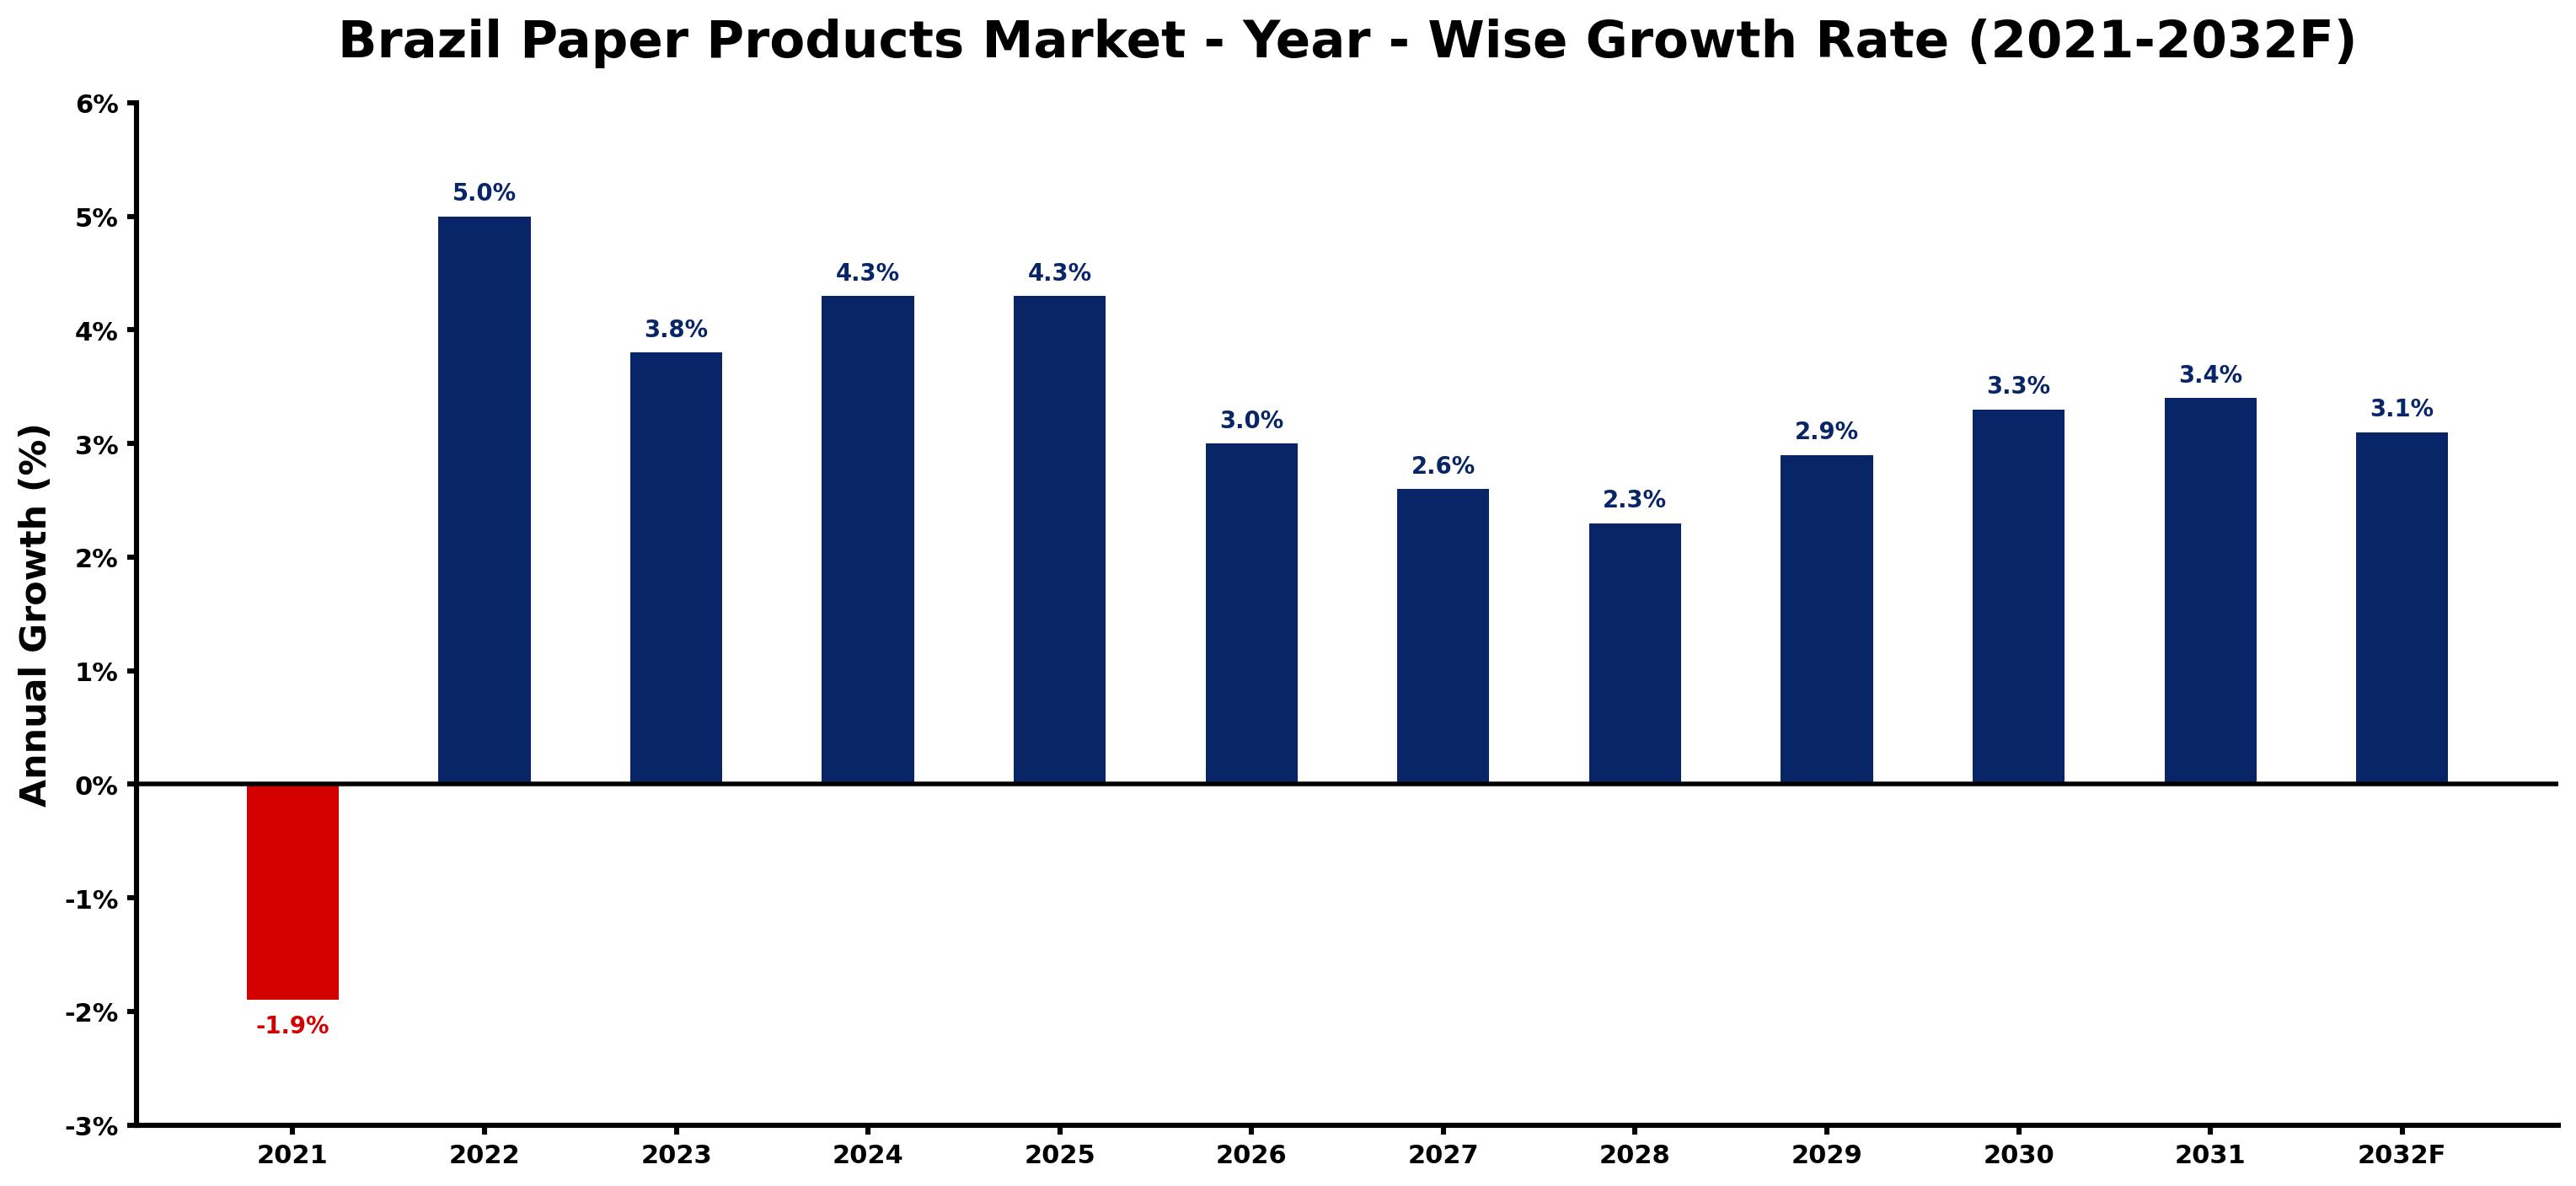
The table below presents the year wise growth rates along with the key drivers influencing the market
| Year | Growth Rate | Major Drivers |
| 2021 | -1.9% | Supply chain disruptions and increased shipping costs hampered product availability, leading to decreased sales in the market. |
| 2022 | 5.0% | E-commerce platforms expanded rapidly, driving online sales of paper goods throughout Brazil. |
| 2023 | 3.8% | Sustainability trends prompted manufacturers to invest in environmentally friendly paper production methods. |
| 2024 | 4.3% | Urbanization trends led to increased consumption of packaged goods, raising paper product usage. |
| 2025 | 4.3% | Corporate social responsibility initiatives encouraged businesses to opt for sustainable paper solutions. |
| 2026 | 3.0% | Education sector reforms accelerated paper consumption as schools transitioned to hybrid learning models. |
| 2027 | 2.6% | Household spending on consumer goods increased, positively impacting paper products sales figures. |
| 2028 | 2.3% | Technological advancements in recycling processes resulted in higher quality recycled paper availability. |
| 2029 | 2.9% | Cultural shifts towards minimalism influenced consumer preferences for simple, functional paper products. |
| 2030 | 3.3% | Renewable energy investments bolstered local paper production capacity, appealing to eco-conscious consumers. |
| 2031 | 3.4% | International trade agreements eased import restrictions, increasing diversity in paper product offerings. |
| 2032 | 3.1% | Marketing campaigns emphasizing sustainability attracted younger demographics, enhancing market penetration. |
Note - Market size estimations and growth projections presented in this report are based on 6Wresearch's advanced forecasting approach, validated with industry datasets as of June 2026.
Brazil Paper Products Market Synopsis
The Brazil Paper Products Market is projected to reach 3.0% and witness significant growth during the forecast period (2026-2032). This market encompasses a variety of products including packaging materials, stationery, and hygiene items, reflecting Brazil's multifaceted industrial profile. The demand for paper products remains stable, driven by consumer demands and ongoing shifts in business practices.
Brazil Paper Products Market Growth Drivers
The growth of the Brazil Paper Products Market is greatly influenced by several key factors:
- The rise of e-commerce has driven a surge in the need for packaging solutions, propelling demand for corrugated boxes and paper-based materials.
- An increasing consumer inclination towards sustainable products is reshaping the market, with businesses responding by offering eco-friendly packaging options.
- Technological advancements in production techniques are enhancing efficiency and lowering costs, enabling companies to meet rising demand without compromising quality.
- The integration of digital printing technologies is allowing for increased customization of paper products, catering to specific consumer preferences and brand strategies.
- Overall economic growth and rising disposable incomes in Brazil are encouraging higher consumption of paper products across various segments, including personal care and office supplies.
Brazil Paper Products Market Challenges and Restraints
While the Brazil Paper Products Market is poised for growth, it also faces notable challenges that could impact its trajectory:
- The escalating demand for sustainable alternatives presents a challenge for traditional manufacturers, necessitating substantial investments in eco-friendly production processes.
- Compliance with stringent environmental regulations can increase operational costs for businesses, hampering profitability.
- Competition with digital media products, which serve as substitutes for paper-based items, continues to pressure demand, particularly in the stationery and publishing sectors.
- Fluctuations in the cost of raw materials, especially recycled paper and pulp, can lead to unpredictable pricing structures affecting market stability.
- The need for companies to continuously innovate in response to changing consumer preferences can strain resources and complicate operational strategies.
Brazil Paper Products Market Government Investment and Initiatives
Government policies play a critical role in shaping the landscape of the Brazil Paper Products Market. Key initiatives include:
- Promotion of sustainable forestry practices and responsible sourcing of raw materials to ensure the longevity of forest resources.
- Investment in waste management strategies and recycling initiatives aimed at minimizing paper wastage and promoting circular economy principles.
- Encouragement of research and development focused on innovative, eco-friendly production technologies to boost competitiveness in the global market.
- Implementation of frameworks for environmental certifications that guide companies in adopting sustainable operational practices.
- Public spending on infrastructure improvements that support logistics and distribution for paper products, enhancing accessibility to markets.
Brazil Paper Products Market Latest Developments (May 2025 - June 2026)
In the period from May 2025 to June 2026, the Brazil Paper Products Market has seen notable developments influencing its future trajectory:
- A continued emphasis on sustainability has prompted manufacturers to accelerate their investments in eco-friendly alternatives, enhancing their product offerings.
- Partnerships between businesses and environmental organizations have been formed to support sustainable practices within the supply chain.
- Technological advancements in production processes have been adopted, improving efficiency and reducing waste during manufacturing.
- Legislative discussions around stricter regulations on paper waste management have increased, pushing companies to enhance their compliance efforts.
- Economic recovery post-pandemic has spurred an uptick in consumer spending, leading to a higher demand for various paper products across multiple sectors.
Brazil Paper Products Market - Key Attractiveness of the Report
- 10 Years of Market Numbers
- Historical Data Starting from 2022 to 2025
- Base Year: 2025
- Forecast Data until 2032
- Key Performance Indicators Impacting the Market
- Major Upcoming Developments and Projects
Key Highlights of the Report:
- Brazil Paper Products Market Outlook
- Market Size of Brazil Paper Products Market, 2025
- Forecast of Brazil Paper Products Market, 2032
- Historical Data and Forecast of Brazil Paper Products Revenues & Volume for the Period 2022-2032F
- Brazil Paper Products Market Trend Evolution
- Brazil Paper Products Market Drivers and Challenges
- Brazil Paper Products Price Trends
- Brazil Paper Products Porter's Five Forces
- Brazil Paper Products Industry Life Cycle
- Historical Data and Forecast of Brazil Paper Products Market Revenues & Volume By Type for the Period 2022-2032F
- Historical Data and Forecast of Brazil Paper Products Market Revenues & Volume By Converted Paper Products for the Period 2022-2032F
- Historical Data and Forecast of Brazil Paper Products Market Revenues & Volume By Unfinished Paper for the Period 2022-2032F
- Historical Data and Forecast of Brazil Paper Products Market Revenues & Volume By Pulp Mills for the Period 2022-2032F
- Historical Data and Forecast of Brazil Paper Products Market Revenues & Volume By Applications for the Period 2022-2032F
- Historical Data and Forecast of Brazil Paper Products Market Revenues & Volume By Writing Paper for the Period 2022-2032F
- Historical Data and Forecast of Brazil Paper Products Market Revenues & Volume By Magazine Paper for the Period 2022-2032F
- Historical Data and Forecast of Brazil Paper Products Market Revenues & Volume By Packaging Paper for the Period 2022-2032F
- Historical Data and Forecast of Brazil Paper Products Market Revenues & Volume By Sanitary Paper for the Period 2022-2032F
- Historical Data and Forecast of Brazil Paper Products Market Revenues & Volume By Other for the Period 2022-2032F
- Brazil Paper Products Import Export Trade Statistics
- Market Opportunity Assessment By Type
- Market Opportunity Assessment By Applications
- Brazil Paper Products Top Companies Market Share
- Brazil Paper Products Competitive Benchmarking By Technical and Operational Parameters
- Brazil Paper Products Company Profiles
- Brazil Paper Products Key Strategic Recommendations
Frequently Asked Questions About the Market Study (FAQs):
The growth is primarily driven by the rise in e-commerce, consumer preference for sustainable packaging, and technological advancements in production processes.
The government promotes sustainable forestry practices, invests in waste management and recycling initiatives, and encourages research into sustainable production technologies.
Challenges include the need for sustainable alternatives, compliance with environmental regulations, and competition from digital media.
Recent trends include increased investment in eco-friendly products, partnerships for sustainable practices, and advancements in production technologies.
6Wresearch actively monitors the Brazil Paper Products Market and publishes its comprehensive annual report, highlighting emerging trends, growth drivers, revenue analysis, and forecast outlook. Our insights help businesses to make data-backed strategic decisions with ongoing market dynamics. Our analysts track relevent industries related to the Brazil Paper Products Market, allowing our clients with actionable intelligence and reliable forecasts tailored to emerging regional needs.
Yes, we provide customisation as per your requirements. To learn more, feel free to contact us on sales@6wresearch.com
1 Executive Summary |
2 Introduction |
2.1 Key Highlights of the Report |
2.2 Report Description |
2.3 Market Scope & Segmentation |
2.4 Research Methodology |
2.5 Assumptions |
3 Brazil Paper Products Market Overview |
3.1 Brazil Country Macro Economic Indicators |
3.2 Brazil Paper Products Market Revenues & Volume, 2022 & 2032F |
3.3 Brazil Paper Products Market - Industry Life Cycle |
3.4 Brazil Paper Products Market - Porter's Five Forces |
3.5 Brazil Paper Products Market Revenues & Volume Share, By Type, 2022 & 2032F |
3.6 Brazil Paper Products Market Revenues & Volume Share, By Applications, 2022 & 2032F |
4 Brazil Paper Products Market Dynamics |
4.1 Impact Analysis |
4.2 Market Drivers |
4.2.1 Increasing demand for sustainable and eco-friendly packaging solutions |
4.2.2 Growth in e-commerce industry leading to higher demand for paper-based packaging materials |
4.2.3 Government initiatives promoting the use of recyclable materials in packaging |
4.3 Market Restraints |
4.3.1 Fluctuating raw material prices impacting production costs |
4.3.2 Competition from alternative packaging materials such as plastics |
4.3.3 Economic uncertainty affecting consumer spending patterns |
5 Brazil Paper Products Market Trends |
6 Brazil Paper Products Market, By Types |
6.1 Brazil Paper Products Market, By Type |
6.1.1 Overview and Analysis |
6.1.2 Brazil Paper Products Market Revenues & Volume, By Type, 2022-2032F |
6.1.3 Brazil Paper Products Market Revenues & Volume, By Converted Paper Products, 2022-2032F |
6.1.4 Brazil Paper Products Market Revenues & Volume, By Unfinished Paper, 2022-2032F |
6.1.5 Brazil Paper Products Market Revenues & Volume, By Pulp Mills, 2022-2032F |
6.2 Brazil Paper Products Market, By Applications |
6.2.1 Overview and Analysis |
6.2.2 Brazil Paper Products Market Revenues & Volume, By Writing Paper, 2022-2032F |
6.2.3 Brazil Paper Products Market Revenues & Volume, By Magazine Paper, 2022-2032F |
6.2.4 Brazil Paper Products Market Revenues & Volume, By Packaging Paper, 2022-2032F |
6.2.5 Brazil Paper Products Market Revenues & Volume, By Sanitary Paper, 2022-2032F |
6.2.6 Brazil Paper Products Market Revenues & Volume, By Other, 2022-2032F |
7 Brazil Paper Products Market Import-Export Trade Statistics |
7.1 Brazil Paper Products Market Export to Major Countries |
7.2 Brazil Paper Products Market Imports from Major Countries |
8 Brazil Paper Products Market Key Performance Indicators |
8.1 Percentage of recycled content in paper products |
8.2 Number of e-commerce transactions utilizing paper-based packaging |
8.3 Adoption rate of sustainable packaging practices in the industry |
9 Brazil Paper Products Market - Opportunity Assessment |
9.1 Brazil Paper Products Market Opportunity Assessment, By Type, 2022 & 2032F |
9.2 Brazil Paper Products Market Opportunity Assessment, By Applications, 2022 & 2032F |
10 Brazil Paper Products Market - Competitive Landscape |
10.1 Brazil Paper Products Market Revenue Share, By Companies, 2025 |
10.2 Brazil Paper Products Market Competitive Benchmarking, By Operating and Technical Parameters |
11 Company Profiles |
12 Recommendations |
13 Disclaimer |
Global Go To Market Strategy - 2030
Export potential enables firms to identify high-growth global markets with greater confidence by combining advanced trade intelligence with a structured quantitative methodology. The framework analyzes emerging demand trends and country-level import patterns while integrating macroeconomic and trade datasets such as GDP and population forecasts, bilateral import–export flows, tariff structures, elasticity differentials between developed and developing economies, geographic distance, and import demand projections. Using weighted trade values from 2020–2024 as the base period to project country-to-country export potential for 2030, these inputs are operationalized through calculated drivers such as gravity model parameters, tariff impact factors, and projected GDP per-capita growth. Through an analysis of hidden potentials, demand hotspots, and market conditions that are most favorable to success, this method enables firms to focus on target countries, maximize returns, and global expansion with data, backed by accuracy.
By factoring in the projected importer demand gap that is currently unmet and could be potential opportunity, it identifies the potential for the Exporter (Country) among 190 countries, against the general trade analysis, which identifies the biggest importer or exporter.
To discover high-growth global markets and optimize your business strategy:
Click Here
Pricing
- Single User License$ 1,995
- Department License$ 2,400
- Site License$ 3,120
- Global License$ 3,795

Leadership Perspectives from Industry Events
Search
Thought Leadership and Analyst Meet


Our Clients
6WResearch In News
- India Air Conditioner Market Set for Strong Rebound in 2026 After Weather-Led Correction and GST-Driven Recovery: 6Wresearch
- ADAS in India: How Automatic Emergency Braking, Blind Spot Detection & Driver Monitoring are Transforming Road Safety
- Doha a strategic location for EV manufacturing hub: IPA Qatar
- Demand for luxury TVs surging in the GCC, says Samsung
- Empowering Growth: The Thriving Journey of Bangladesh’s Cable Industry
- Demand for luxury TVs surging in the GCC, says Samsung
Latest Reports
- Nicaragua RPG Gaming Market (2026-2032)
- New Zealand RPG Gaming Market (2026-2032)
- Netherlands RPG Gaming Market (2026-2032)
- Nauru RPG Gaming Market (2026-2032)
- Namibia RPG Gaming Market (2026-2032)
- Mozambique RPG Gaming Market (2026-2032)
- Montenegro RPG Gaming Market (2026-2032)
- Mongolia RPG Gaming Market (2026-2032)
- Monaco RPG Gaming Market (2026-2032)
- Micronesia RPG Gaming Market (2026-2032)
Industry Events and Analyst Meet

EV India Expo 2026

HIMTEX 2026

India Refining Summit 2026

India EV Show 2026

EV tech India Expo 2026
Whitepaper
- Middle East & Africa Commercial Security Market Click here to view more.
- Middle East & Africa Fire Safety Systems & Equipment Market Click here to view more.
- GCC Drone Market Click here to view more.
- Middle East Lighting Fixture Market Click here to view more.
- GCC Physical & Perimeter Security Market Click here to view more.