Brazil pharmaceuticals chemical Market (2026-2032) | Companies, Value, Size, Growth, Share, Forecast, Revenue, Trends, Outlook, Analysis & Industry
Market Forecast By Type (Basic building blocks , Advanced intermediates , Active ingredients), By Application (Cardiovascular , Neurology , Oncology , Infectious diseases, Metabolic system , Diabetes , Respiratory diseases , Other), By Sales Channel (Offline, Online) And Competitive Landscape
| Product Code: ETC018322 | Publication Date: Oct 2020 | Updated Date: Jun 2026 | Product Type: Report | |
| Publisher: 6Wresearch | Author: Ravi Bhandari | No. of Pages: 70 | No. of Figures: 35 | No. of Tables: 5 |
Brazil pharmaceuticals chemical Market Summary
The brazil pharmaceuticals chemical market was estimated at USD 99 Million in 2025 and is projected to reach USD 118 Million by 2032, growing at a CAGR of 3.0% from 2026 to 2032.
Brazil pharmaceuticals chemical Market Year-wise Growth Rate and Key Drivers
This graph highlights how the Brazil pharmaceuticals chemical Market has steadily grown over the past five years, supported by major growth factors.
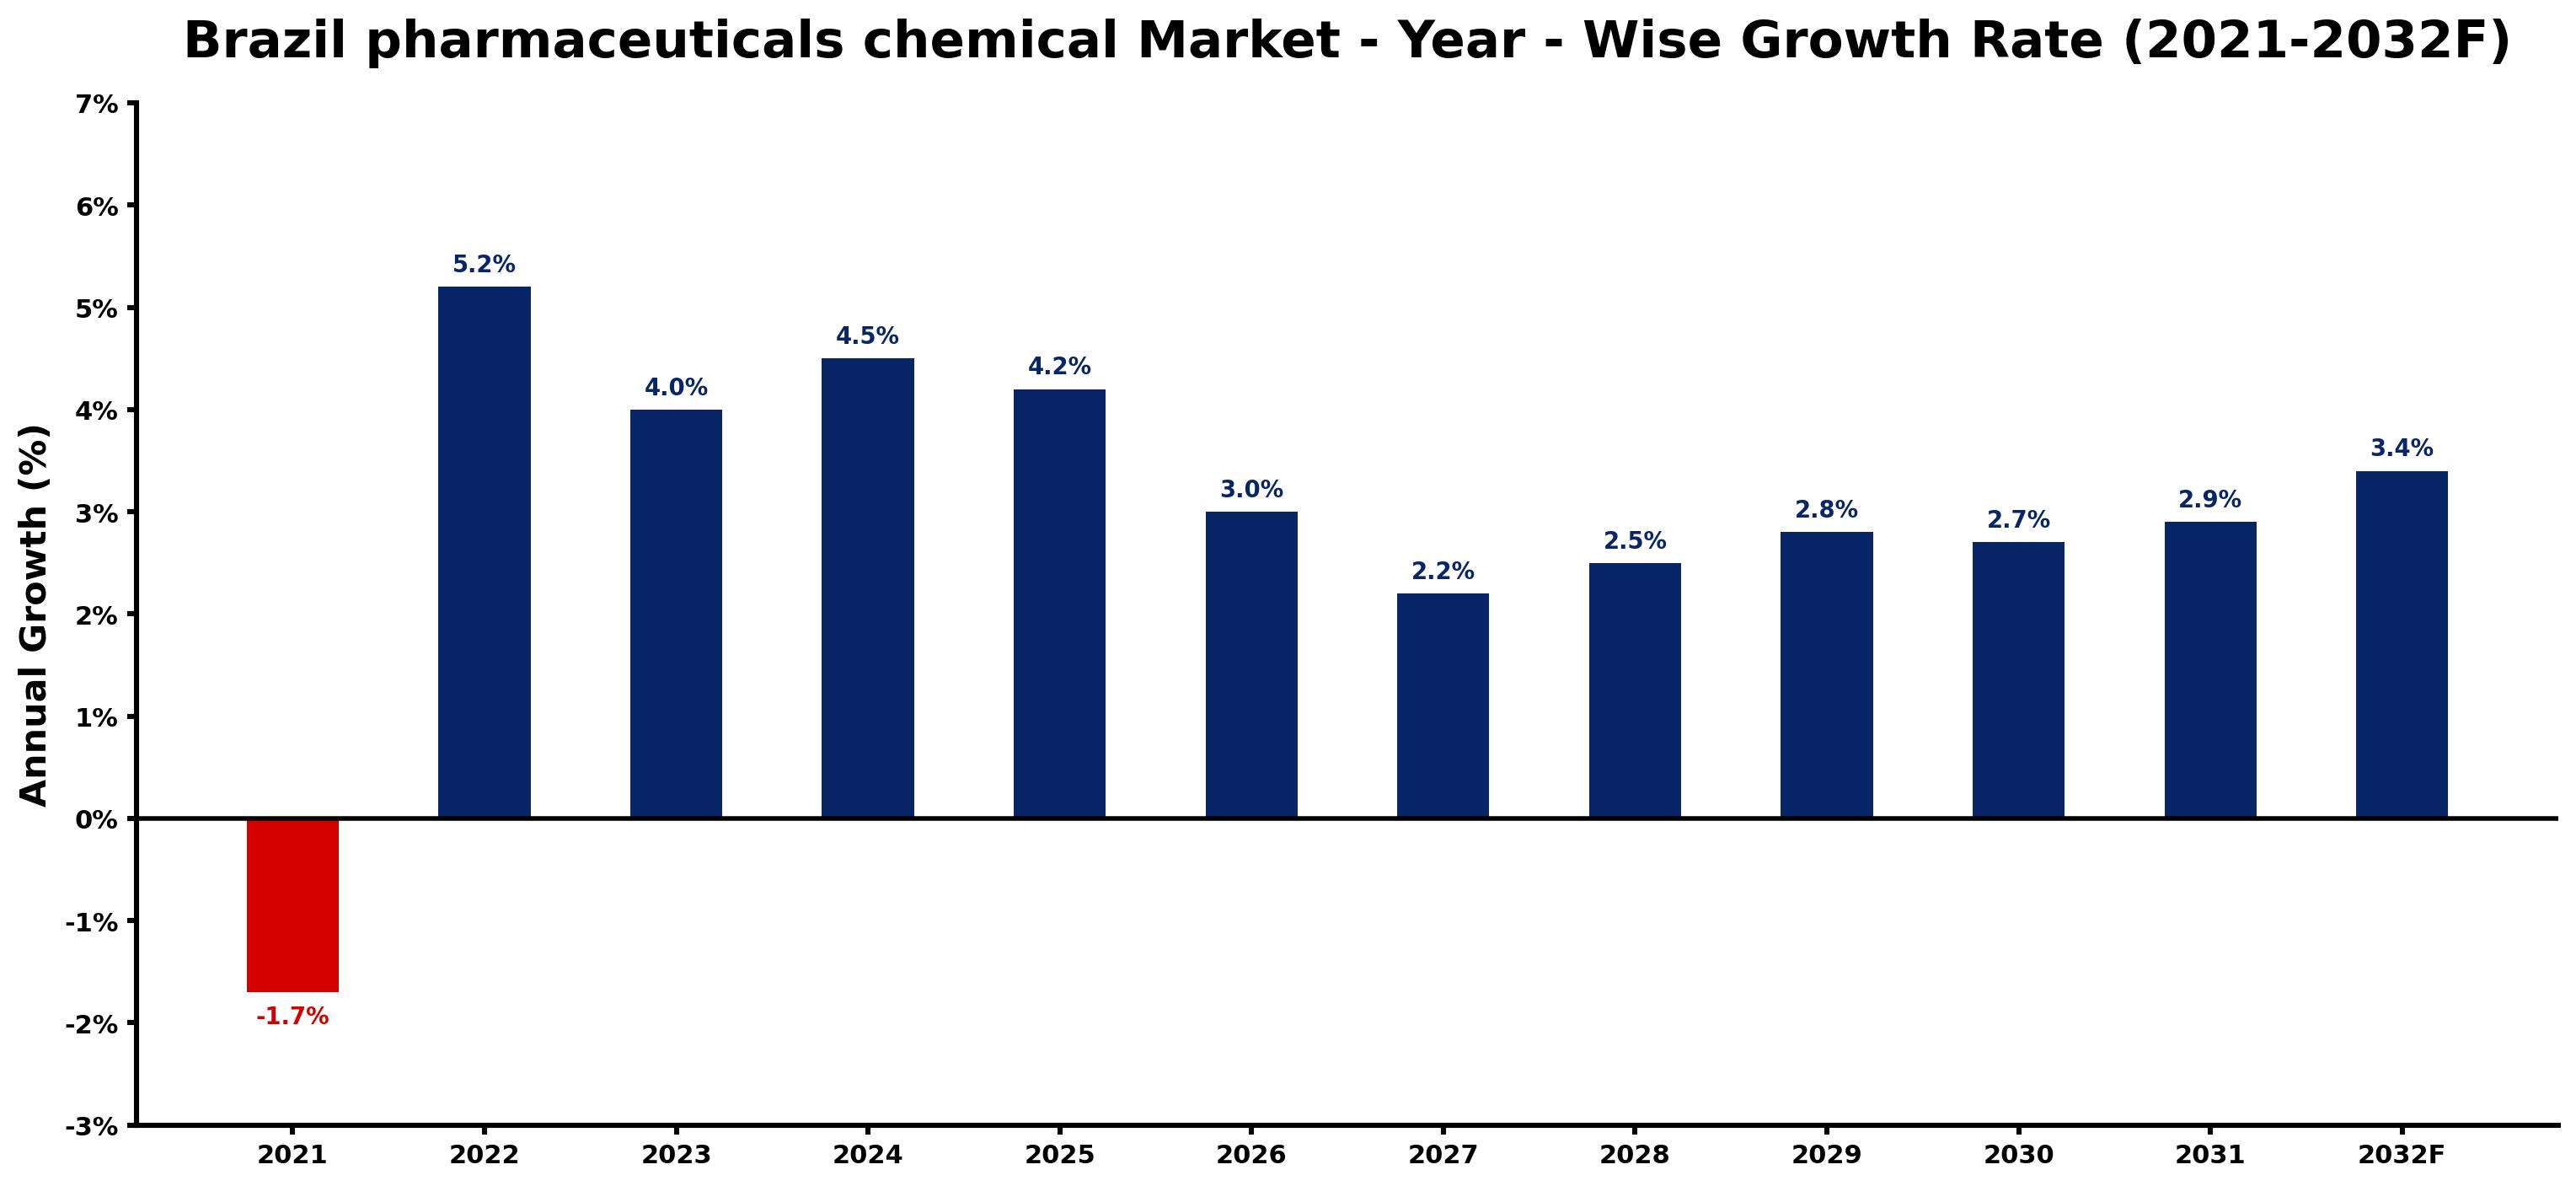
The table below presents the year wise growth rates along with the key drivers influencing the market
| Year | Growth Rate | Major Drivers |
| 2021 | -1.7% | Supply chain disruptions, exacerbated by the pandemic, hindered timely drug production and delivery, impacting overall market performance. |
| 2022 | 5.2% | Collaborations between research institutions and companies enhance innovation in drug development. |
| 2023 | 4.0% | Emerging biotechnologies create new treatment possibilities, expanding market segments significantly. |
| 2024 | 4.5% | Aging demographics result in higher demand for chronic disease management solutions. |
| 2025 | 4.2% | Investment in digital health technologies improves patient access and monitoring capabilities. |
| 2026 | 3.0% | E-commerce platforms facilitate easier access to pharmaceutical products across Brazil. |
| 2027 | 2.2% | Increased health awareness drives consumer interest in preventive medicines and supplements. |
| 2028 | 2.5% | Shifts in insurance coverage patterns encourage growth in pharmaceutical spending habits. |
| 2029 | 2.8% | Partnerships with international firms enhance local product offerings and distribution networks. |
| 2030 | 2.7% | Sustainability trends influence pharmaceutical companies to adopt greener manufacturing practices. |
| 2031 | 2.9% | Rising public health concerns stimulate government support for local pharmaceutical initiatives. |
| 2032 | 3.4% | Technological innovations streamline drug approval processes, encouraging faster market entry. |
Note - Market size estimations and growth projections presented in this report are based on 6Wresearch's advanced forecasting approach, validated with industry datasets as of June 2026.
Brazil pharmaceuticals chemical Market Synopsis
The Brazil pharmaceuticals chemical Market is projected to reach 3.0% and witness significant growth during the forecast period (2026-2032). This market serves as a vital component in the broader pharmaceutical industry, impacting the supply chain through various regulatory changes, research and development activities, and emerging global health trends. A robust focus on quality and adherence to international standards is reshaping the competitive landscape of this sector.
Brazil pharmaceuticals chemical Market Growth Drivers
The growth trajectory of the Brazil pharmaceuticals chemical Market is primarily influenced by several key factors:
- The expansion of the pharmaceutical and healthcare sectors in Brazil is a significant driver, fueled by increasing healthcare expenditures and a growing population that is becoming more aware of health-related issues.
- Advancements in drug development methodologies, including the integration of biotechnology and personalized medicine, are propelling demand for high-quality pharmaceuticals chemicals.
- The rising prevalence of chronic diseases, such as diabetes and cardiovascular conditions, necessitates the development of effective therapeutic solutions, further stimulating market growth.
- Strong regulatory support, particularly from national health organizations, encourages innovation and boosts investor confidence in the pharmaceuticals chemical sector.
- Continuous investments in research and development are fostering an environment for advancements in chemical formulations and innovative drug solutions, catering to the evolving healthcare needs.
Brazil pharmaceuticals chemical Market Challenges and Restraints
Despite its promising growth prospects, the Brazil pharmaceuticals chemical Market faces several challenges:
- Stringent regulatory requirements pose a significant hurdle for new entrants and existing players, necessitating rigorous compliance to ensure product safety and efficacy.
- The necessity for ongoing research and development introduces considerable financial pressure on companies, as they must continually innovate to stay competitive in the global landscape.
- Global competition has intensified, particularly from nations with lower production costs, compelling Brazilian companies to enhance their operational efficiencies and R&D investments.
- Adhering to increasingly stringent quality standards is paramount, yet it presents logistical challenges for manufacturers, who must invest in advanced technologies and staff training.
- Ethical considerations within the industry, including sourcing raw materials and fair pricing strategies, remain ongoing challenges that require careful navigation.
Brazil pharmaceuticals chemical Market Government Investment and Initiatives
The government plays a pivotal role in shaping the Brazil pharmaceuticals chemical Market through various investment and policy initiatives:
- Government regulations focus on ensuring the safety, efficacy, and quality of pharmaceutical products, which fosters an environment conducive to industry growth.
- Public spending on healthcare infrastructure is projected to increase, providing a favorable backdrop for pharmaceuticals chemicals as part of Brazil's broader health strategy.
- Development plans aimed at enhancing research capabilities are being supported through grants and incentives for R&D investment, particularly in innovative chemical formulations.
- Policies encouraging public-private partnerships are increasingly being enacted to bolster innovation while enhancing access to pharmaceuticals across diverse health sectors.
- The Brazilian government is also actively working to create a more streamlined regulatory process to encourage foreign investments and improve the market landscape.
Brazil pharmaceuticals chemical Market Latest Developments (May 2025 - June 2026)
Recent developments within the Brazil pharmaceuticals chemical Market indicate a dynamic shift towards innovation and compliance:
- There has been an observable increase in collaboration between academia and industry, aiming to push the boundaries of drug development and chemical research.
- Several key initiatives have emerged focusing on enhancing supply chain transparency, responding to both consumer demand and regulatory pressures for responsible sourcing.
- The market saw increased funding allocated towards digital health and analytics capabilities, reflecting the growing trend toward data-driven decision-making in drug development.
- Innovations in chemical synthesis technologies have gained traction, offering the potential to optimize production processes and reduce costs.
- Heightened attention to environmental sustainability practices within pharmaceuticals manufacturing has begun influencing operational strategies, aligning with global trends.
Brazil pharmaceuticals chemical Market - Key Attractiveness of the Report
- 10 Years of Market Numbers
- Historical Data Starting from 2022 to 2025
- Base Year: 2025
- Forecast Data until 2032
- Key Performance Indicators Impacting the Market
- Major Upcoming Developments and Projects
Key Highlights of the Report:
- Brazil pharmaceuticals chemical Market Outlook
- Market Size of Brazil pharmaceuticals chemical Market, 2025
- Forecast of Brazil pharmaceuticals chemical Market, 2032
- Historical Data and Forecast of Brazil pharmaceuticals chemical Revenues & Volume for the Period 2022-2032F
- Brazil pharmaceuticals chemical Market Trend Evolution
- Brazil pharmaceuticals chemical Market Drivers and Challenges
- Brazil pharmaceuticals chemical Price Trends
- Brazil pharmaceuticals chemical Porter's Five Forces
- Brazil pharmaceuticals chemical Industry Life Cycle
- Historical Data and Forecast of Brazil pharmaceuticals chemical Market Revenues & Volume By Type for the Period 2022-2032F
- Historical Data and Forecast of Brazil pharmaceuticals chemical Market Revenues & Volume By Basic building blocks for the Period 2022-2032F
- Historical Data and Forecast of Brazil pharmaceuticals chemical Market Revenues & Volume By Advanced intermediates for the Period 2022-2032F
- Historical Data and Forecast of Brazil pharmaceuticals chemical Market Revenues & Volume By Active ingredients for the Period 2022-2032F
- Historical Data and Forecast of Brazil pharmaceuticals chemical Market Revenues & Volume By Application for the Period 2022-2032F
- Historical Data and Forecast of Brazil pharmaceuticals chemical Market Revenues & Volume By Cardiovascular for the Period 2022-2032F
- Historical Data and Forecast of Brazil pharmaceuticals chemical Market Revenues & Volume By Neurology for the Period 2022-2032F
- Historical Data and Forecast of Brazil pharmaceuticals chemical Market Revenues & Volume By Oncology for the Period 2022-2032F
- Historical Data and Forecast of Brazil pharmaceuticals chemical Market Revenues & Volume By Infectious diseases for the Period 2022-2032F
- Historical Data and Forecast of Brazil pharmaceuticals chemical Market Revenues & Volume By Metabolic system for the Period 2022-2032F
- Historical Data and Forecast of Brazil pharmaceuticals chemical Market Revenues & Volume By Diabetes for the Period 2022-2032F
- Historical Data and Forecast of Brazil pharmaceuticals chemical Market Revenues & Volume By Respiratory diseases for the Period 2022-2032F
- Historical Data and Forecast of Brazil pharmaceuticals chemical Market Revenues & Volume By Other for the Period 2022-2032F
- Historical Data and Forecast of Brazil pharmaceuticals chemical Market Revenues & Volume By Sales Channel for the Period 2022-2032F
- Historical Data and Forecast of Brazil pharmaceuticals chemical Market Revenues & Volume By Offline for the Period 2022-2032F
- Historical Data and Forecast of Brazil pharmaceuticals chemical Market Revenues & Volume By Online for the Period 2022-2032F
- Brazil pharmaceuticals chemical Import Export Trade Statistics
- Market Opportunity Assessment By Type
- Market Opportunity Assessment By Application
- Market Opportunity Assessment By Sales Channel
- Brazil pharmaceuticals chemical Top Companies Market Share
- Brazil pharmaceuticals chemical Competitive Benchmarking By Technical and Operational Parameters
- Brazil pharmaceuticals chemical Company Profiles
- Brazil pharmaceuticals chemical Key Strategic Recommendations
Frequently Asked Questions About the Market Study (FAQs):
The growth is primarily driven by an expanding pharmaceutical sector, advancements in drug development, and a rising prevalence of chronic diseases.
The market faces challenges related to stringent regulatory requirements, the need for continual R&D, and maintaining quality standards amid global competition.
The government supports the market through regulatory frameworks, public spending on healthcare, and initiatives that encourage research and development.
Recent trends include increased collaboration between academia and industry, advancements in digital health technologies, and a growing focus on sustainability in manufacturing practices.
6Wresearch actively monitors the Brazil pharmaceuticals chemical Market and publishes its comprehensive annual report, highlighting emerging trends, growth drivers, revenue analysis, and forecast outlook. Our insights help businesses to make data-backed strategic decisions with ongoing market dynamics. Our analysts track relevent industries related to the Brazil pharmaceuticals chemical Market, allowing our clients with actionable intelligence and reliable forecasts tailored to emerging regional needs.
Yes, we provide customisation as per your requirements. To learn more, feel free to contact us on sales@6wresearch.com
1 Executive Summary |
2 Introduction |
2.1 Key Highlights of the Report |
2.2 Report Description |
2.3 Market Scope & Segmentation |
2.4 Research Methodology |
2.5 Assumptions |
3 Brazil pharmaceuticals chemical Market Overview |
3.1 Brazil Country Macro Economic Indicators |
3.2 Brazil pharmaceuticals chemical Market Revenues & Volume, 2022 & 2032F |
3.3 Brazil pharmaceuticals chemical Market - Industry Life Cycle |
3.4 Brazil pharmaceuticals chemical Market - Porter's Five Forces |
3.5 Brazil pharmaceuticals chemical Market Revenues & Volume Share, By Type, 2022 & 2032F |
3.6 Brazil pharmaceuticals chemical Market Revenues & Volume Share, By Application, 2022 & 2032F |
3.7 Brazil pharmaceuticals chemical Market Revenues & Volume Share, By Sales Channel, 2022 & 2032F |
4 Brazil pharmaceuticals chemical Market Dynamics |
4.1 Impact Analysis |
4.2 Market Drivers |
4.2.1 Increasing demand for pharmaceutical products in Brazil |
4.2.2 Government initiatives to promote the pharmaceutical industry |
4.2.3 Growth in research and development activities in the pharmaceutical sector |
4.3 Market Restraints |
4.3.1 Stringent regulations and approval processes for pharmaceutical chemicals |
4.3.2 Fluctuating raw material prices |
4.3.3 Competition from generic drugs |
5 Brazil pharmaceuticals chemical Market Trends |
6 Brazil pharmaceuticals chemical Market, By Types |
6.1 Brazil pharmaceuticals chemical Market, By Type |
6.1.1 Overview and Analysis |
6.1.2 Brazil pharmaceuticals chemical Market Revenues & Volume, By Type, 2022-2032F |
6.1.3 Brazil pharmaceuticals chemical Market Revenues & Volume, By Basic building blocks , 2022-2032F |
6.1.4 Brazil pharmaceuticals chemical Market Revenues & Volume, By Advanced intermediates , 2022-2032F |
6.1.5 Brazil pharmaceuticals chemical Market Revenues & Volume, By Active ingredients, 2022-2032F |
6.2 Brazil pharmaceuticals chemical Market, By Application |
6.2.1 Overview and Analysis |
6.2.2 Brazil pharmaceuticals chemical Market Revenues & Volume, By Cardiovascular , 2022-2032F |
6.2.3 Brazil pharmaceuticals chemical Market Revenues & Volume, By Neurology , 2022-2032F |
6.2.4 Brazil pharmaceuticals chemical Market Revenues & Volume, By Oncology , 2022-2032F |
6.2.5 Brazil pharmaceuticals chemical Market Revenues & Volume, By Infectious diseases, 2022-2032F |
6.2.6 Brazil pharmaceuticals chemical Market Revenues & Volume, By Metabolic system , 2022-2032F |
6.2.7 Brazil pharmaceuticals chemical Market Revenues & Volume, By Diabetes , 2022-2032F |
6.2.8 Brazil pharmaceuticals chemical Market Revenues & Volume, By Other, 2022-2032F |
6.2.9 Brazil pharmaceuticals chemical Market Revenues & Volume, By Other, 2022-2032F |
6.3 Brazil pharmaceuticals chemical Market, By Sales Channel |
6.3.1 Overview and Analysis |
6.3.2 Brazil pharmaceuticals chemical Market Revenues & Volume, By Offline, 2022-2032F |
6.3.3 Brazil pharmaceuticals chemical Market Revenues & Volume, By Online, 2022-2032F |
7 Brazil pharmaceuticals chemical Market Import-Export Trade Statistics |
7.1 Brazil pharmaceuticals chemical Market Export to Major Countries |
7.2 Brazil pharmaceuticals chemical Market Imports from Major Countries |
8 Brazil pharmaceuticals chemical Market Key Performance Indicators |
8.1 Research and development investment in pharmaceutical chemicals |
8.2 Number of new drug approvals in Brazil |
8.3 Regulatory compliance rate in the pharmaceutical chemical industry |
9 Brazil pharmaceuticals chemical Market - Opportunity Assessment |
9.1 Brazil pharmaceuticals chemical Market Opportunity Assessment, By Type, 2022 & 2032F |
9.2 Brazil pharmaceuticals chemical Market Opportunity Assessment, By Application, 2022 & 2032F |
9.3 Brazil pharmaceuticals chemical Market Opportunity Assessment, By Sales Channel, 2022 & 2032F |
10 Brazil pharmaceuticals chemical Market - Competitive Landscape |
10.1 Brazil pharmaceuticals chemical Market Revenue Share, By Companies, 2025 |
10.2 Brazil pharmaceuticals chemical Market Competitive Benchmarking, By Operating and Technical Parameters |
11 Company Profiles |
12 Recommendations |
13 Disclaimer |
Global Go To Market Strategy - 2030
Export potential enables firms to identify high-growth global markets with greater confidence by combining advanced trade intelligence with a structured quantitative methodology. The framework analyzes emerging demand trends and country-level import patterns while integrating macroeconomic and trade datasets such as GDP and population forecasts, bilateral import–export flows, tariff structures, elasticity differentials between developed and developing economies, geographic distance, and import demand projections. Using weighted trade values from 2020–2024 as the base period to project country-to-country export potential for 2030, these inputs are operationalized through calculated drivers such as gravity model parameters, tariff impact factors, and projected GDP per-capita growth. Through an analysis of hidden potentials, demand hotspots, and market conditions that are most favorable to success, this method enables firms to focus on target countries, maximize returns, and global expansion with data, backed by accuracy.
By factoring in the projected importer demand gap that is currently unmet and could be potential opportunity, it identifies the potential for the Exporter (Country) among 190 countries, against the general trade analysis, which identifies the biggest importer or exporter.
To discover high-growth global markets and optimize your business strategy:
Click Here
Pricing
- Single User License$ 1,995
- Department License$ 2,400
- Site License$ 3,120
- Global License$ 3,795

Leadership Perspectives from Industry Events
Search
Thought Leadership and Analyst Meet


Our Clients
6WResearch In News
- India Air Conditioner Market Set for Strong Rebound in 2026 After Weather-Led Correction and GST-Driven Recovery: 6Wresearch
- ADAS in India: How Automatic Emergency Braking, Blind Spot Detection & Driver Monitoring are Transforming Road Safety
- Doha a strategic location for EV manufacturing hub: IPA Qatar
- Demand for luxury TVs surging in the GCC, says Samsung
- Empowering Growth: The Thriving Journey of Bangladesh’s Cable Industry
- Demand for luxury TVs surging in the GCC, says Samsung
Latest Reports
- Nicaragua RPG Gaming Market (2026-2032)
- New Zealand RPG Gaming Market (2026-2032)
- Netherlands RPG Gaming Market (2026-2032)
- Nauru RPG Gaming Market (2026-2032)
- Namibia RPG Gaming Market (2026-2032)
- Mozambique RPG Gaming Market (2026-2032)
- Montenegro RPG Gaming Market (2026-2032)
- Mongolia RPG Gaming Market (2026-2032)
- Monaco RPG Gaming Market (2026-2032)
- Micronesia RPG Gaming Market (2026-2032)
Industry Events and Analyst Meet

EV India Expo 2026

HIMTEX 2026

India Refining Summit 2026

India EV Show 2026

EV tech India Expo 2026
Whitepaper
- Middle East & Africa Commercial Security Market Click here to view more.
- Middle East & Africa Fire Safety Systems & Equipment Market Click here to view more.
- GCC Drone Market Click here to view more.
- Middle East Lighting Fixture Market Click here to view more.
- GCC Physical & Perimeter Security Market Click here to view more.