Brazil Phosphorus Market (2025-2031) Outlook | Analysis, Value, Industry, Companies, Share, Forecast, Revenue, Size, Growth, Trends
Market Forecast By Type (White phosphorus, Red phosphorus, Phosphorous chloride, Phosphoric acid, Industrial phosphates, Phosphorous penta-oxide), By Application (Detergents, Water treatment, Flame retardants, Batteries, Chemical intermediates, Fertilizers) And Competitive Landscape
| Product Code: ETC198254 | Publication Date: May 2022 | Updated Date: Oct 2025 | Product Type: Market Research Report | |
| Publisher: 6Wresearch | Author: Ravi Bhandari | No. of Pages: 60 | No. of Figures: 40 | No. of Tables: 7 |
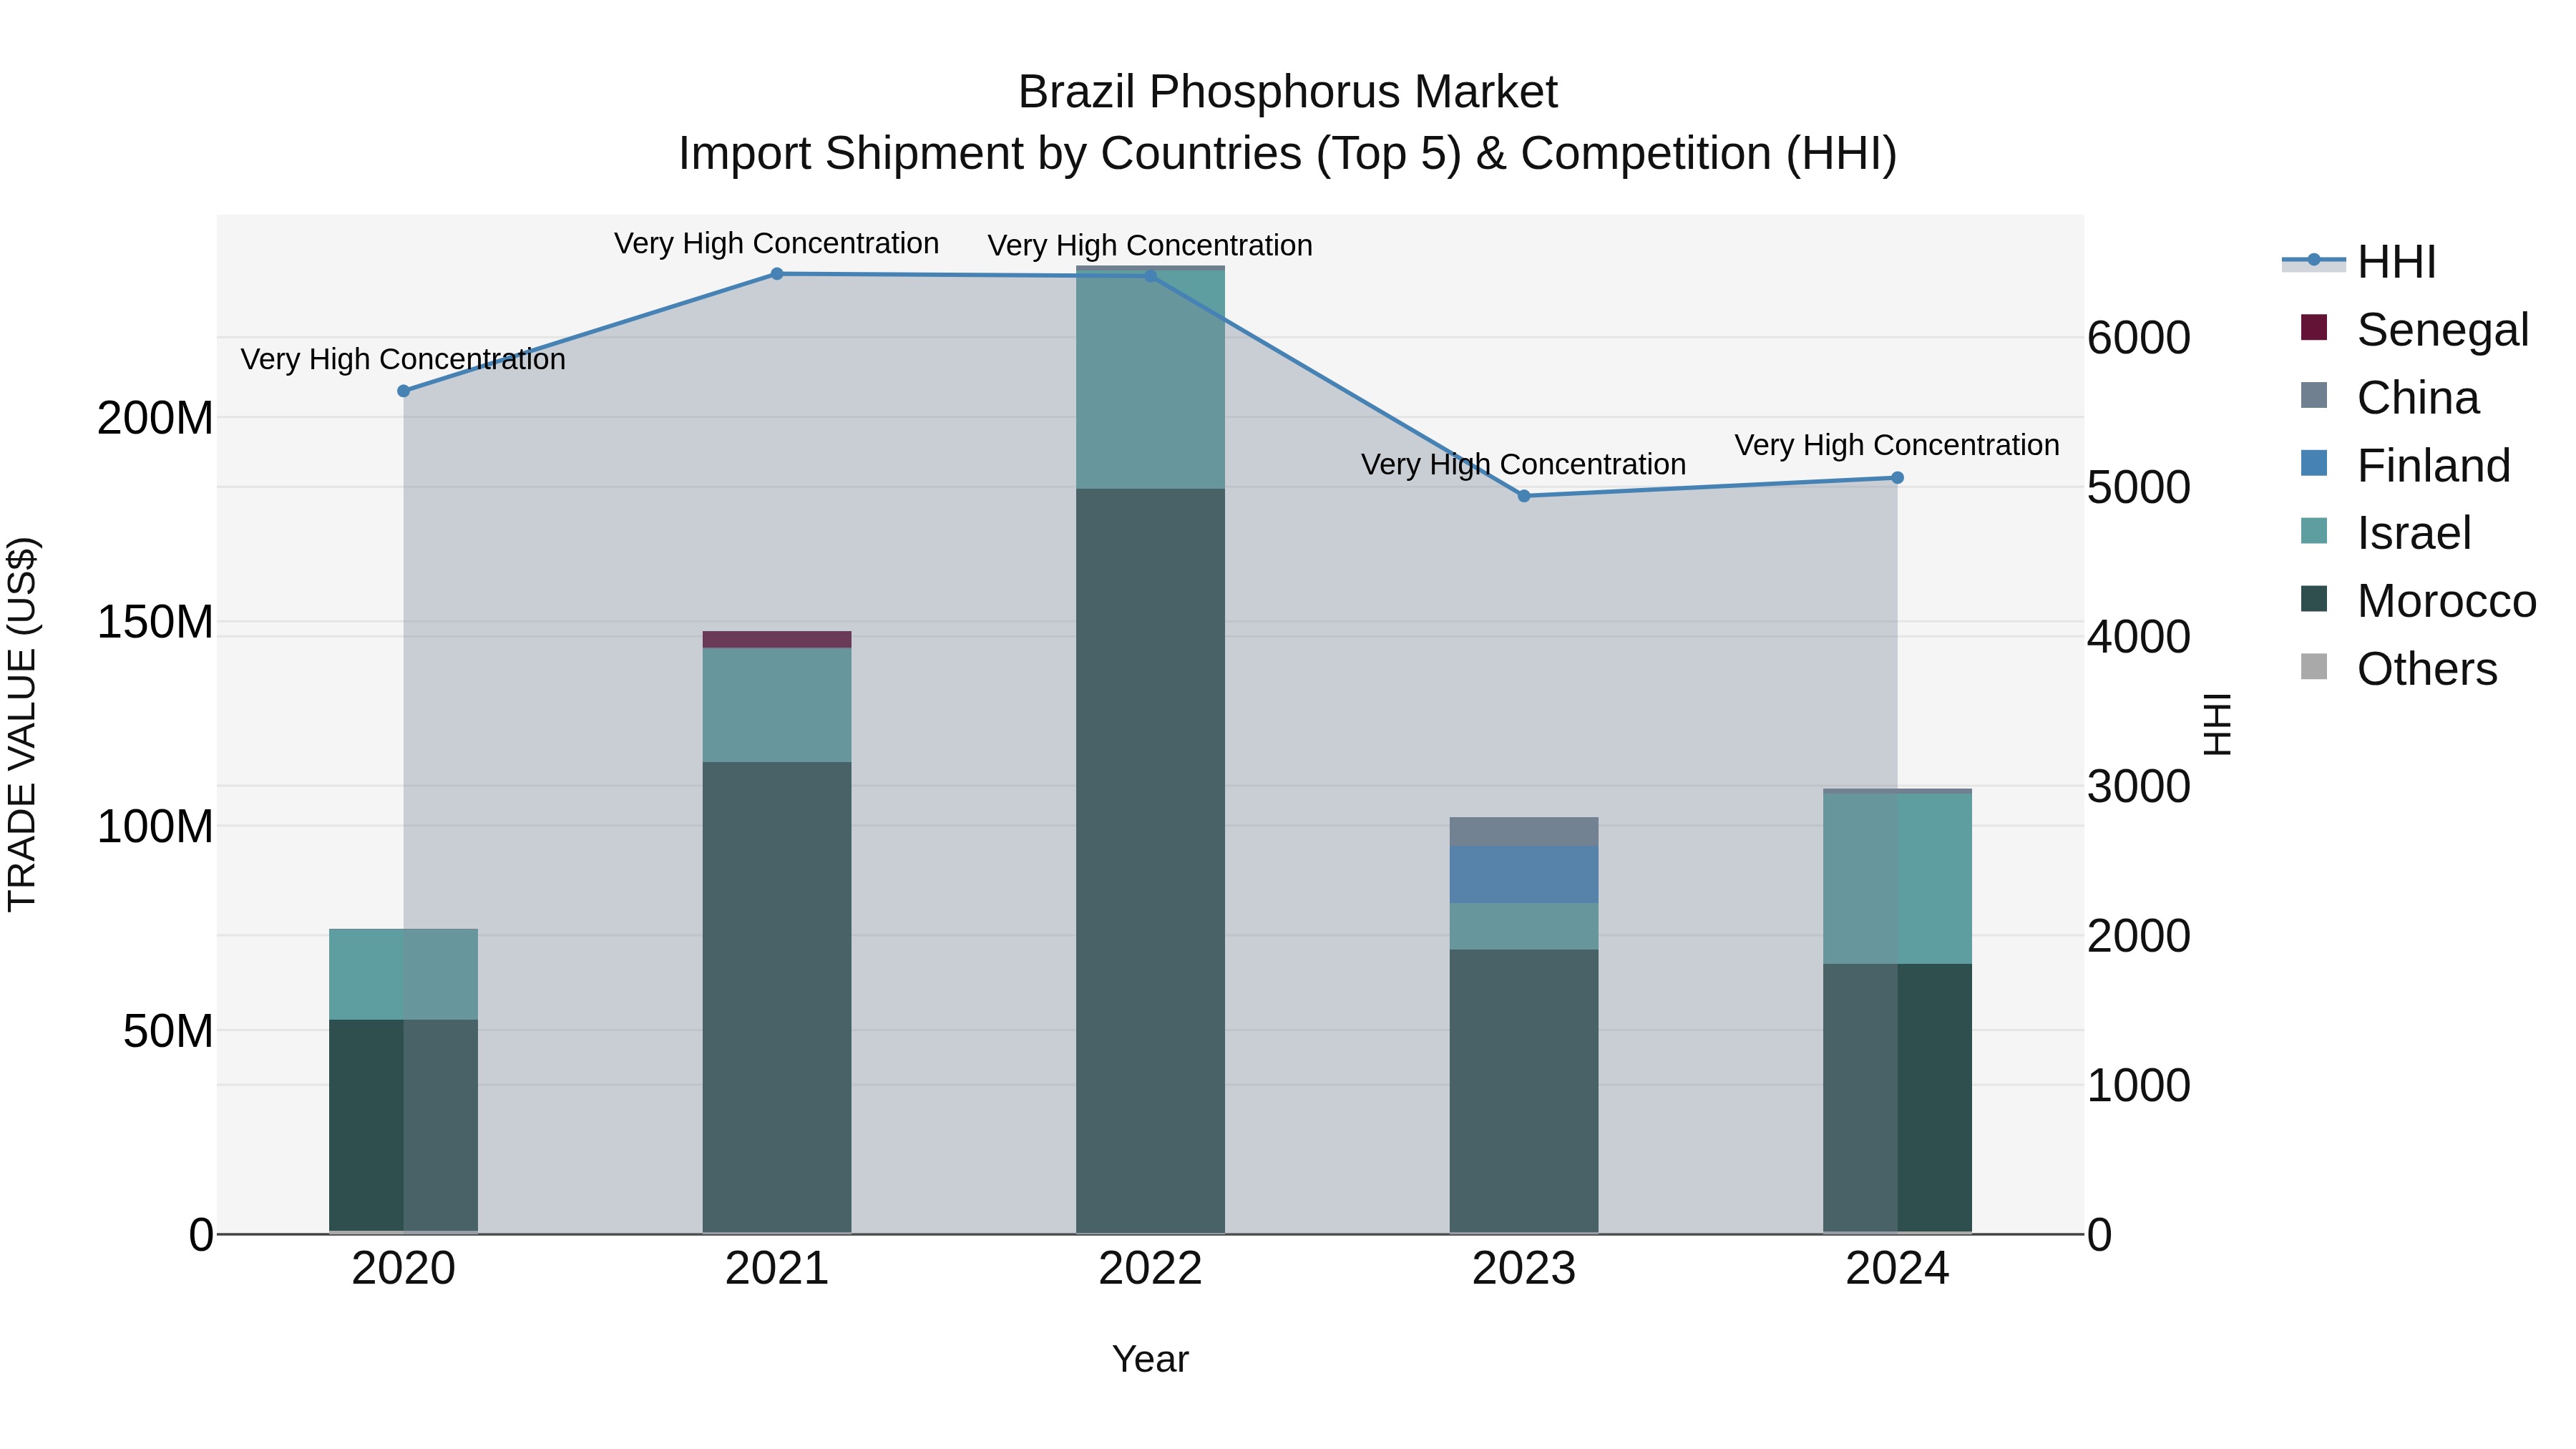
Brazil Phosphorus Market Top 5 Importing Countries and Market Competition (HHI) Analysis
Brazil`s phosphorus import market in 2024 continued to be dominated by key exporters such as Morocco, Israel, China, USA, and Switzerland. The high Herfindahl-Hirschman Index (HHI) indicates a concentrated market, reflecting the significant market share held by these countries. With a strong compound annual growth rate (CAGR) of 9.95% from 2020 to 2024, the industry shows promising expansion. Additionally, the growth rate of 6.89% from 2023 to 2024 suggests continued momentum in phosphorus imports, highlighting Brazil`s ongoing reliance on these key trading partners for this essential resource.
Brazil Phosphorus Market Overview
In Brazil, the phosphorus market exhibits steady growth driven by its essential role in agricultural fertilizers. With the country being a major agricultural producer, the demand for phosphorus remains robust, supported by both domestic consumption and export markets. The steady expansion of the agricultural sector and ongoing efforts to enhance crop yields further bolster the demand for phosphorus-based fertilizers.
Drivers of the market
The Brazil Phosphorus Market is primarily steered by agricultural demands. Phosphorus is a crucial component in fertilizers, playing a pivotal role in enhancing crop yield and quality. As Brazil maintains its status as a global agricultural powerhouse, the demand for phosphorus remains robust, propelled by ongoing agricultural activities and endeavors to optimize crop production.
Challenges of the market
The Brazil Phosphorus Market faces several challenges, including fluctuating global demand and supply dynamics, environmental concerns regarding phosphorus runoff and pollution, and competition from alternative fertilizers. Additionally, the market may encounter regulatory hurdles related to sustainable phosphorus sourcing and usage.
Government Policy of the market
In the phosphorus market, the Brazil government implements policies aimed at ensuring sustainable extraction practices, environmental protection, and market stability. Regulations on mining operations, environmental impact assessments, and export quotas are key components of government intervention.
Key Highlights of the Report:
- Brazil Phosphorus Market Outlook
- Market Size of Brazil Phosphorus Market, 2024
- Forecast of Brazil Phosphorus Market, 2031
- Historical Data and Forecast of Brazil Phosphorus Revenues & Volume for the Period 2021-2031
- Brazil Phosphorus Market Trend Evolution
- Brazil Phosphorus Market Drivers and Challenges
- Brazil Phosphorus Price Trends
- Brazil Phosphorus Porter's Five Forces
- Brazil Phosphorus Industry Life Cycle
- Historical Data and Forecast of Brazil Phosphorus Market Revenues & Volume By Type for the Period 2021-2031
- Historical Data and Forecast of Brazil Phosphorus Market Revenues & Volume By White phosphorus for the Period 2021-2031
- Historical Data and Forecast of Brazil Phosphorus Market Revenues & Volume By Red phosphorus for the Period 2021-2031
- Historical Data and Forecast of Brazil Phosphorus Market Revenues & Volume By Phosphorous chloride for the Period 2021-2031
- Historical Data and Forecast of Brazil Phosphorus Market Revenues & Volume By Phosphoric acid for the Period 2021-2031
- Historical Data and Forecast of Brazil Phosphorus Market Revenues & Volume By Industrial phosphates for the Period 2021-2031
- Historical Data and Forecast of Brazil Phosphorus Market Revenues & Volume By Phosphorous penta-oxide for the Period 2021-2031
- Historical Data and Forecast of Brazil Phosphorus Market Revenues & Volume By Application for the Period 2021-2031
- Historical Data and Forecast of Brazil Phosphorus Market Revenues & Volume By Detergents for the Period 2021-2031
- Historical Data and Forecast of Brazil Phosphorus Market Revenues & Volume By Water treatment for the Period 2021-2031
- Historical Data and Forecast of Brazil Phosphorus Market Revenues & Volume By Flame retardants for the Period 2021-2031
- Historical Data and Forecast of Brazil Phosphorus Market Revenues & Volume By Batteries for the Period 2021-2031
- Historical Data and Forecast of Brazil Phosphorus Market Revenues & Volume By Chemical intermediates for the Period 2021-2031
- Historical Data and Forecast of Brazil Phosphorus Market Revenues & Volume By Fertilizers for the Period 2021-2031
- Brazil Phosphorus Import Export Trade Statistics
- Market Opportunity Assessment By Type
- Market Opportunity Assessment By Application
- Brazil Phosphorus Top Companies Market Share
- Brazil Phosphorus Competitive Benchmarking By Technical and Operational Parameters
- Brazil Phosphorus Company Profiles
- Brazil Phosphorus Key Strategic Recommendations
Frequently Asked Questions About the Market Study (FAQs):
6Wresearch actively monitors the Brazil Phosphorus Market and publishes its comprehensive annual report, highlighting emerging trends, growth drivers, revenue analysis, and forecast outlook. Our insights help businesses to make data-backed strategic decisions with ongoing market dynamics. Our analysts track relevent industries related to the Brazil Phosphorus Market, allowing our clients with actionable intelligence and reliable forecasts tailored to emerging regional needs.
Yes, we provide customisation as per your requirements. To learn more, feel free to contact us on sales@6wresearch.com
1 Executive Summary |
2 Introduction |
2.1 Key Highlights of the Report |
2.2 Report Description |
2.3 Market Scope & Segmentation |
2.4 Research Methodology |
2.5 Assumptions |
3 Brazil Phosphorus Market Overview |
3.1 Brazil Country Macro Economic Indicators |
3.2 Brazil Phosphorus Market Revenues & Volume, 2021 & 2031F |
3.3 Brazil Phosphorus Market - Industry Life Cycle |
3.4 Brazil Phosphorus Market - Porter's Five Forces |
3.5 Brazil Phosphorus Market Revenues & Volume Share, By Type, 2021 & 2031F |
3.6 Brazil Phosphorus Market Revenues & Volume Share, By Application, 2021 & 2031F |
4 Brazil Phosphorus Market Dynamics |
4.1 Impact Analysis |
4.2 Market Drivers |
4.2.1 Increasing demand for fertilizers in agriculture sector |
4.2.2 Growing adoption of phosphorus-based fertilizers for crop yield enhancement |
4.2.3 Government initiatives to support agriculture industry in Brazil |
4.3 Market Restraints |
4.3.1 Fluctuating prices of raw materials for phosphorus production |
4.3.2 Environmental concerns related to excessive use of phosphorus in agriculture |
5 Brazil Phosphorus Market Trends |
6 Brazil Phosphorus Market, By Types |
6.1 Brazil Phosphorus Market, By Type |
6.1.1 Overview and Analysis |
6.1.2 Brazil Phosphorus Market Revenues & Volume, By Type, 2021-2031F |
6.1.3 Brazil Phosphorus Market Revenues & Volume, By White phosphorus, 2021-2031F |
6.1.4 Brazil Phosphorus Market Revenues & Volume, By Red phosphorus, 2021-2031F |
6.1.5 Brazil Phosphorus Market Revenues & Volume, By Phosphorous chloride, 2021-2031F |
6.1.6 Brazil Phosphorus Market Revenues & Volume, By Phosphoric acid, 2021-2031F |
6.1.7 Brazil Phosphorus Market Revenues & Volume, By Industrial phosphates, 2021-2031F |
6.1.8 Brazil Phosphorus Market Revenues & Volume, By Phosphorous penta-oxide, 2021-2031F |
6.2 Brazil Phosphorus Market, By Application |
6.2.1 Overview and Analysis |
6.2.2 Brazil Phosphorus Market Revenues & Volume, By Detergents, 2021-2031F |
6.2.3 Brazil Phosphorus Market Revenues & Volume, By Water treatment, 2021-2031F |
6.2.4 Brazil Phosphorus Market Revenues & Volume, By Flame retardants, 2021-2031F |
6.2.5 Brazil Phosphorus Market Revenues & Volume, By Batteries, 2021-2031F |
6.2.6 Brazil Phosphorus Market Revenues & Volume, By Chemical intermediates, 2021-2031F |
6.2.7 Brazil Phosphorus Market Revenues & Volume, By Fertilizers, 2021-2031F |
7 Brazil Phosphorus Market Import-Export Trade Statistics |
7.1 Brazil Phosphorus Market Export to Major Countries |
7.2 Brazil Phosphorus Market Imports from Major Countries |
8 Brazil Phosphorus Market Key Performance Indicators |
8.1 Average selling price of phosphorus-based fertilizers in Brazil |
8.2 Percentage of agricultural land in Brazil using phosphorus-based fertilizers |
8.3 Investment in research and development of phosphorus technologies in Brazil |
9 Brazil Phosphorus Market - Opportunity Assessment |
9.1 Brazil Phosphorus Market Opportunity Assessment, By Type, 2021 & 2031F |
9.2 Brazil Phosphorus Market Opportunity Assessment, By Application, 2021 & 2031F |
10 Brazil Phosphorus Market - Competitive Landscape |
10.1 Brazil Phosphorus Market Revenue Share, By Companies, 2024 |
10.2 Brazil Phosphorus Market Competitive Benchmarking, By Operating and Technical Parameters |
11 Company Profiles |
12 Recommendations |
13 Disclaimer |
Global Go To Market Strategy - 2030
Export potential enables firms to identify high-growth global markets with greater confidence by combining advanced trade intelligence with a structured quantitative methodology. The framework analyzes emerging demand trends and country-level import patterns while integrating macroeconomic and trade datasets such as GDP and population forecasts, bilateral import–export flows, tariff structures, elasticity differentials between developed and developing economies, geographic distance, and import demand projections. Using weighted trade values from 2020–2024 as the base period to project country-to-country export potential for 2030, these inputs are operationalized through calculated drivers such as gravity model parameters, tariff impact factors, and projected GDP per-capita growth. Through an analysis of hidden potentials, demand hotspots, and market conditions that are most favorable to success, this method enables firms to focus on target countries, maximize returns, and global expansion with data, backed by accuracy.
By factoring in the projected importer demand gap that is currently unmet and could be potential opportunity, it identifies the potential for the Exporter (Country) among 190 countries, against the general trade analysis, which identifies the biggest importer or exporter.
To discover high-growth global markets and optimize your business strategy:
Click Here
Pricing
- Single User License$ 1,995
- Department License$ 2,400
- Site License$ 3,120
- Global License$ 3,795

Leadership Perspectives from Industry Events
Search
Thought Leadership and Analyst Meet


Our Clients
6WResearch In News
- Doha a strategic location for EV manufacturing hub: IPA Qatar
- Demand for luxury TVs surging in the GCC, says Samsung
- Empowering Growth: The Thriving Journey of Bangladesh’s Cable Industry
- Demand for luxury TVs surging in the GCC, says Samsung
- Video call with a traditional healer? Once unthinkable, it’s now common in South Africa
- Intelligent Buildings To Smooth GCC’s Path To Net Zero
Latest Reports
- New Zealand Aseptic Manufacturing Market (2026-2032)
- Netherlands Aseptic Manufacturing Market (2026-2032)
- Nauru Aseptic Manufacturing Market (2026-2032)
- Namibia Aseptic Manufacturing Market (2026-2032)
- Mozambique Aseptic Manufacturing Market (2026-2032)
- Montenegro Aseptic Manufacturing Market (2026-2032)
- Mongolia Aseptic Manufacturing Market (2026-2032)
- Monaco Aseptic Manufacturing Market (2026-2032)
- Micronesia Aseptic Manufacturing Market (2026-2032)
- Mauritius Aseptic Manufacturing Market (2026-2032)
Industry Events and Analyst Meet

HIMTEX 2026

India Refining Summit 2026

India EV Show 2026

EV tech India Expo 2026

Auto Tech Asia 2026
Whitepaper
- Middle East & Africa Commercial Security Market Click here to view more.
- Middle East & Africa Fire Safety Systems & Equipment Market Click here to view more.
- GCC Drone Market Click here to view more.
- Middle East Lighting Fixture Market Click here to view more.
- GCC Physical & Perimeter Security Market Click here to view more.