Brazil Plastic Pipes And Shapes Market (2026-2032) | Size, Trends, Analysis, Value, Forecast, Revenue, Growth, Companies, Outlook, Share & Industry
Market Forecast By Product Types (Plastic Pipes and Pipe Fittings, Unlaminated Plastic Profile Shapes), By End-users (Oil and Gas, Sewage/Drainage, Irrigation and Water Use, Industrial Use, Others) And Competitive Landscape
| Product Code: ETC037903 | Publication Date: Jan 2021 | Updated Date: Jun 2026 | Product Type: Report | |
| Publisher: 6Wresearch | Author: Ravi Bhandari | No. of Pages: 70 | No. of Figures: 35 | No. of Tables: 5 |
Brazil Plastic Pipes And Shapes Market Summary
The brazil plastic pipes and shapes market was estimated at USD 148 Million in 2025 and is projected to reach USD 175 Million by 2032, growing at a CAGR of 2.5% from 2026 to 2032.
Brazil Plastic Pipes And Shapes Market Year-wise Growth Rate and Key Drivers
This graph highlights how the Brazil Plastic Pipes And Shapes Market has steadily grown over the years, supported by major growth factors.
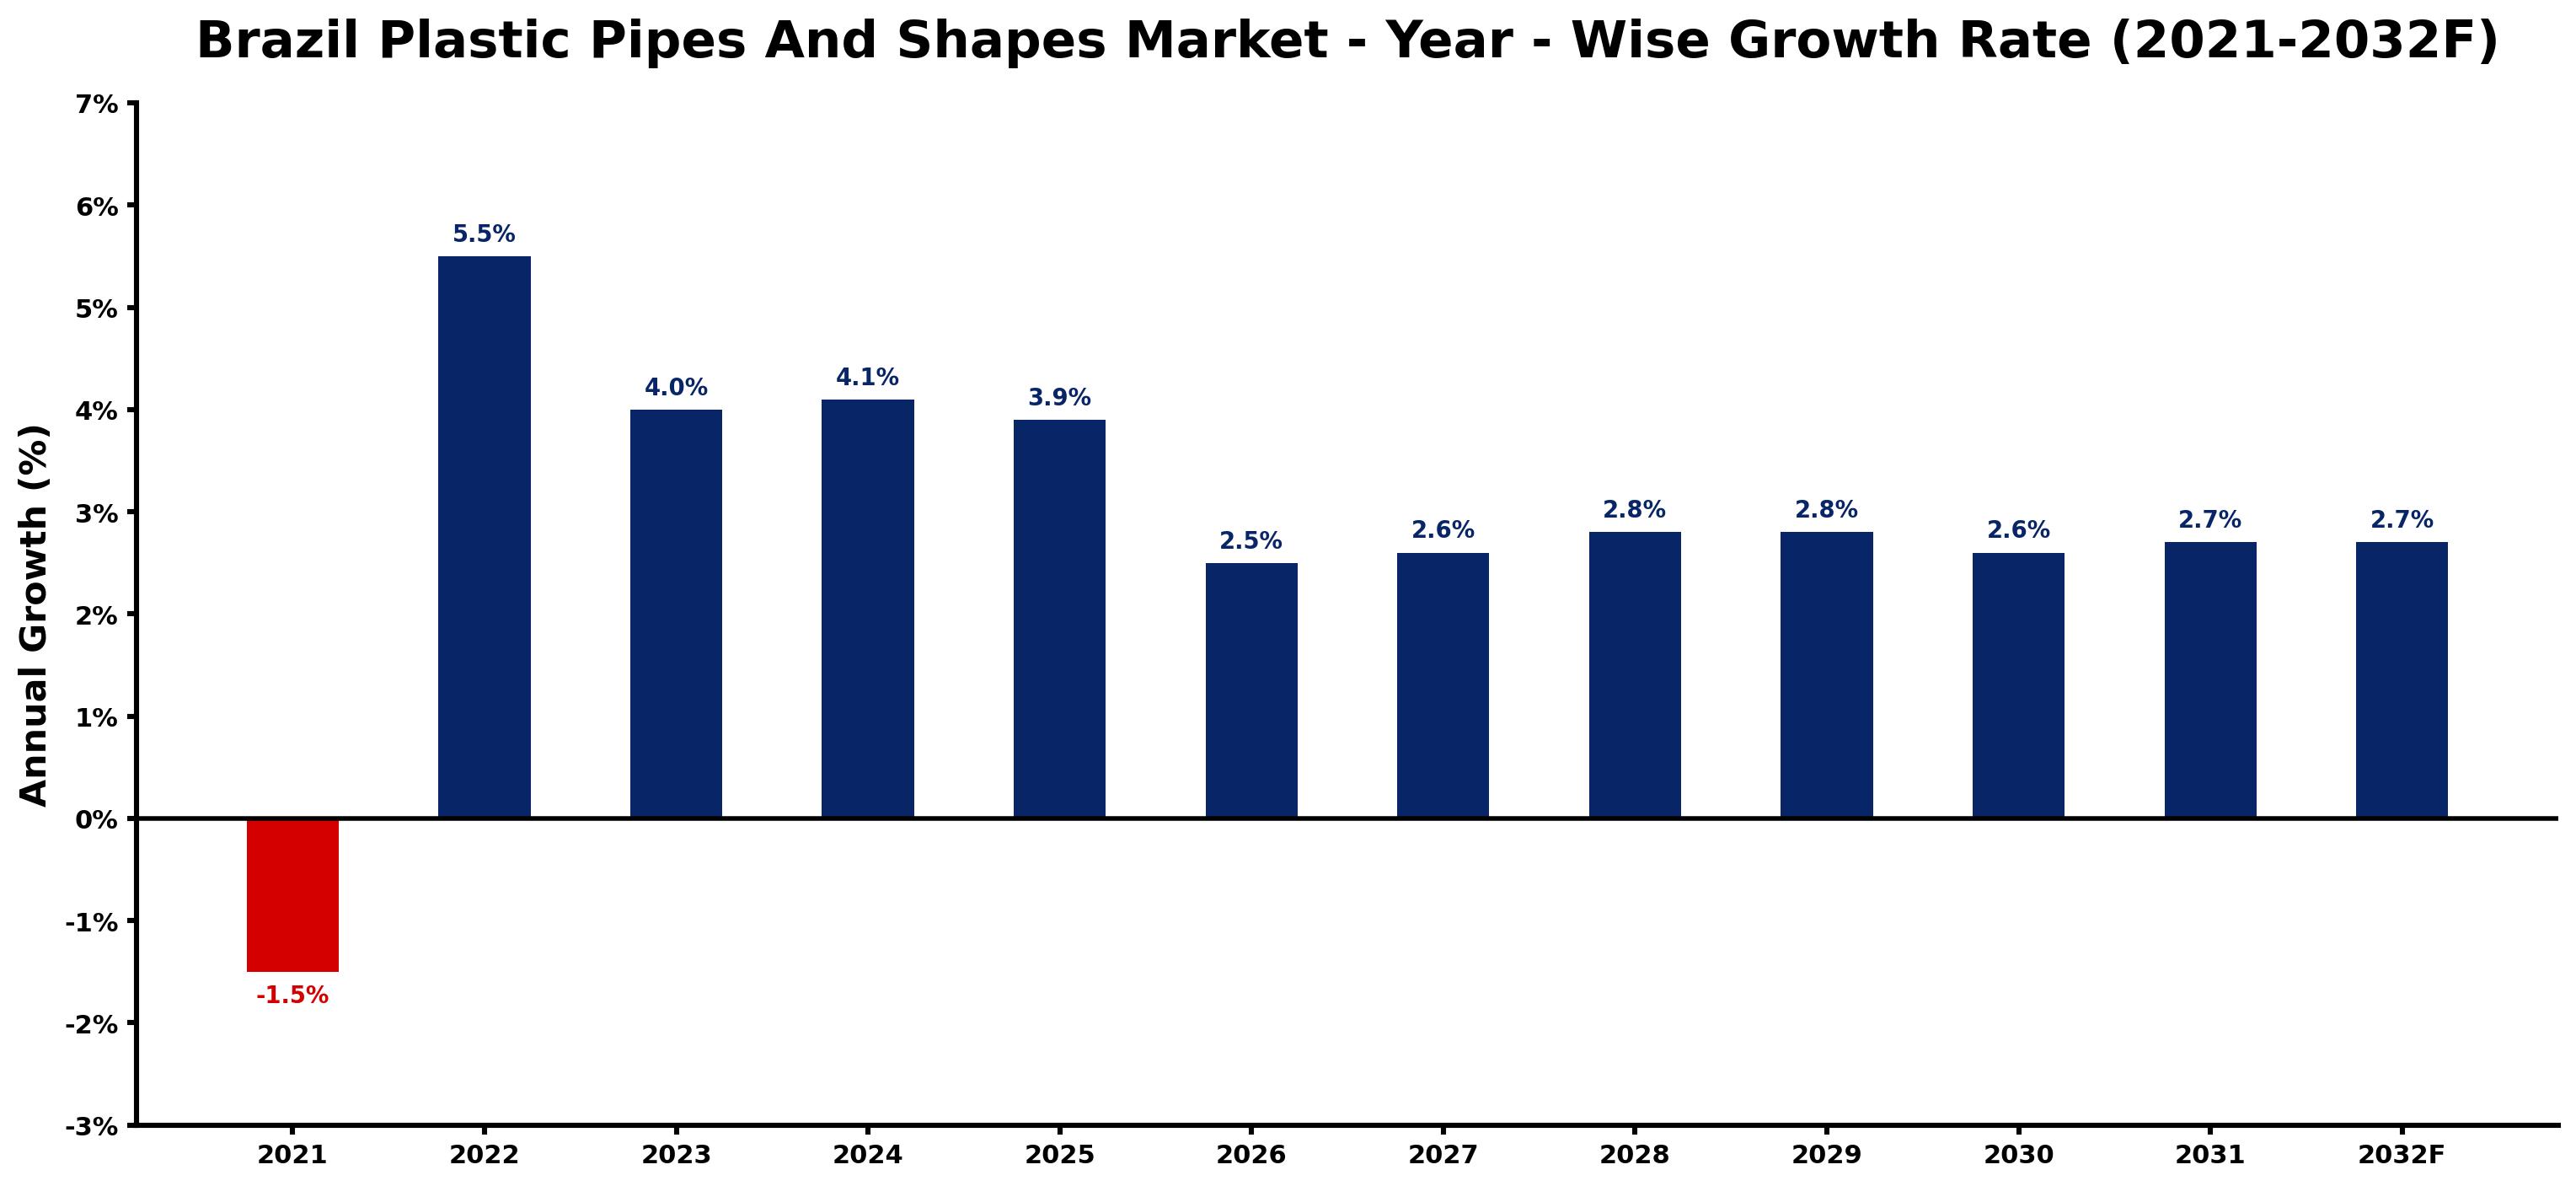
The table below presents the year wise growth rates along with the key drivers influencing the market
| Year | Growth Rate | Major Drivers |
| 2021 | -1.5% | Increased environmental regulations shifted demand toward sustainable alternatives, negatively impacting traditional plastic pipe sales. |
| 2022 | 5.5% | Sustainable construction practices prompted shifts towards eco-friendly materials in the building sector. |
| 2023 | 4.0% | Urbanization trends drove significant expansions in water and sewage infrastructure across Brazil. |
| 2024 | 4.1% | Technological innovations in manufacturing processes improved cost efficiency for plastic pipe production. |
| 2025 | 3.9% | Rising awareness of environmental sustainability increased preference for recycled plastic materials. |
| 2026 | 2.5% | Investment in irrigation projects reflected the agricultural sector's need for reliable water systems. |
| 2027 | 2.6% | Emerging market players focused on enhancing distribution networks, boosting accessibility for consumers. |
| 2028 | 2.8% | Urban planning initiatives prioritized waste management solutions, intensifying plastic pipe installations. |
| 2029 | 2.8% | Collaborations between private and public sectors led to large-scale infrastructure development projects. |
| 2030 | 2.6% | Shifts towards smart city frameworks incorporated advanced piping solutions for efficient resource management. |
| 2031 | 2.7% | Consumer preferences for low-maintenance materials drove innovations in plastic pipe durability and design. |
| 2032 | 2.7% | Enhanced recycling technologies established a circular economy approach within the plastic pipes market. |
Note - Market size estimations and growth projections presented in this report are based on 6Wresearch's advanced forecasting approach, validated with industry datasets as of June 2026.
Brazil Plastic Pipes And Shapes Market Synopsis
The Brazil Plastic Pipes And Shapes Market is projected to reach 2.5% and witness significant growth during the forecast period (2026-2032). This growth is primarily fueled by the ongoing advancements in the construction and infrastructure development sectors, where plastic pipes are increasingly favored due to their versatility, durability, and cost-effectiveness. With a competitive landscape marked by continuous product innovation and adherence to stringent quality standards, the demand for plastic pipes and shapes in Brazil is expected to maintain a robust trajectory as further investments are made in infrastructure projects.
Brazil Plastic Pipes And Shapes Market Growth Drivers
Several factors are driving the expansion of the Brazil Plastic Pipes And Shapes Market. Firstly, Brazil's ongoing construction boom necessitates efficient plumbing and piping solutions, and plastic pipes fit this requirement perfectly due to their lightweight properties and resilience. Secondly, the rapid urbanization across major Brazilian cities is contributing to increased demand for modern infrastructure, including water supply and sewage systems.
- The construction sector's growth has led to rising investments in infrastructure, boosting the market for plastic pipes.
- Plastic pipes enable quicker installations compared to traditional materials, thereby reducing labor costs and project timelines.
- The adoption of plastic pipes in agricultural applications for irrigation systems is also fostering market growth.
- Government incentives aimed at modernizing infrastructure encourage the use of innovative materials, including plastic piping solutions.
- Technological advancements in manufacturing processes result in the production of higher quality and more durable plastic pipes, further driving market acceptance.
Brazil Plastic Pipes And Shapes Market Challenges and Restraints
Despite the favorable growth landscape, the Brazil Plastic Pipes And Shapes Market faces several challenges. Fluctuations in oil prices, which affect raw material costs for plastic production, pose a significant threat to profitability margins. Moreover, the need for high-quality, durable products can complicate manufacturing processes and increase operational costs.
- Environmental concerns surrounding plastic waste are leading to calls for improved recycling processes and sustainable practices, challenging traditional manufacturing methods.
- The market must navigate the impact of regulatory changes, which may impose stricter safety and environmental standards on plastic products.
- Competition from alternative materials such as metal and ceramics may limit market penetration and pricing strategies for plastic pipes.
- Consumer awareness regarding the carbon footprint of plastic production drives demand for more sustainable solutions, impacting market dynamics.
- Developing efficient end-of-life disposal options for plastic pipes remains essential to addressing environmental concerns and maintaining market growth.
Brazil Plastic Pipes And Shapes Market Government Investment and Initiatives
Government policies significantly influence the trajectory of the Brazil Plastic Pipes And Shapes Market. The Brazilian government has instituted various regulations aimed at enhancing quality standards and safety across the plastic industry. This includes guidelines for the proper disposal and recycling of plastic waste to minimize environmental impact. Public investments are increasingly directed toward infrastructure development, with specific initiatives fostering the adoption of innovative technologies and sustainable materials in construction projects.
- Incentives for utilizing eco-friendly materials in public projects drive demand for sustainable plastic pipe options.
- The government's commitment to building resilient infrastructure aligns with market growth, ensuring ongoing demand for reliable plumbing solutions.
- Investment programs targeting urban expansion and rural development further bolster the need for efficient plastic piping systems.
- Regulatory frameworks are evolving to encourage manufacturers to adopt best practices in environmental sustainability, thus enhancing the market's responsiveness to these concerns.
- Public-private partnerships in infrastructure projects facilitate the integration of advanced plastic piping solutions, benefiting both sectors.
Brazil Plastic Pipes And Shapes Market Latest Developments (May 2025 - June 2026)
Recent developments in the Brazil Plastic Pipes And Shapes Market indicate a continued focus on innovation and sustainability. During this period, industry participants have engaged in research and development efforts to enhance the recyclability of plastic materials and improve product durability. Furthermore, collaborations between government entities and private organizations have emerged to promote sustainable practices and technologies in pipe manufacturing. Awareness campaigns aimed at educating end-users about the benefits of plastic piping systems have gained traction, positively influencing market dynamics. Additionally, the rise in urban infrastructure projects is expected to sustain the momentum for plastic pipes, as cities adopt smart water management systems that leverage plastic materials for efficiency.
Brazil Plastic Pipes And Shapes Market - Key Attractiveness of the Report
- 10 Years of Market Numbers
- Historical Data Starting from 2022 to 2025
- Base Year: 2025
- Forecast Data until 2032
- Key Performance Indicators Impacting the Market
- Major Upcoming Developments and Projects
Key Highlights of the Report:
- Brazil Plastic Pipes And Shapes Market Outlook
- Market Size of Brazil Plastic Pipes And Shapes Market, 2025
- Forecast of Brazil Plastic Pipes And Shapes Market, 2032
- Historical Data and Forecast of Brazil Plastic Pipes And Shapes Revenues & Volume for the Period 2022-2032F
- Brazil Plastic Pipes And Shapes Market Trend Evolution
- Brazil Plastic Pipes And Shapes Market Drivers and Challenges
- Brazil Plastic Pipes And Shapes Price Trends
- Brazil Plastic Pipes And Shapes Porter's Five Forces
- Brazil Plastic Pipes And Shapes Industry Life Cycle
- Historical Data and Forecast of Brazil Plastic Pipes And Shapes Market Revenues & Volume By Product Types for the Period 2022-2032F
- Historical Data and Forecast of Brazil Plastic Pipes And Shapes Market Revenues & Volume By Plastic Pipes and Pipe Fittings for the Period 2022-2032F
- Historical Data and Forecast of Brazil Plastic Pipes And Shapes Market Revenues & Volume By Unlaminated Plastic Profile Shapes for the Period 2022-2032F
- Historical Data and Forecast of Brazil Plastic Pipes And Shapes Market Revenues & Volume By End-users for the Period 2022-2032F
- Historical Data and Forecast of Brazil Plastic Pipes And Shapes Market Revenues & Volume By Oil and Gas for the Period 2022-2032F
- Historical Data and Forecast of Brazil Plastic Pipes And Shapes Market Revenues & Volume By Sewage/Drainage for the Period 2022-2032F
- Historical Data and Forecast of Brazil Plastic Pipes And Shapes Market Revenues & Volume By Irrigation and Water Use for the Period 2022-2032F
- Historical Data and Forecast of Brazil Plastic Pipes And Shapes Market Revenues & Volume By Industrial Use for the Period 2022-2032F
- Historical Data and Forecast of Brazil Plastic Pipes And Shapes Market Revenues & Volume By Others for the Period 2022-2032F
- Brazil Plastic Pipes And Shapes Import Export Trade Statistics
- Market Opportunity Assessment By Product Types
- Market Opportunity Assessment By End-users
- Brazil Plastic Pipes And Shapes Top Companies Market Share
- Brazil Plastic Pipes And Shapes Competitive Benchmarking By Technical and Operational Parameters
- Brazil Plastic Pipes And Shapes Company Profiles
- Brazil Plastic Pipes And Shapes Key Strategic Recommendations
Frequently Asked Questions About the Market Study (FAQs):
Factors such as ongoing construction projects, urbanization, and the need for efficient plumbing solutions are driving market growth. Additionally, the lightweight and durable nature of plastic pipes makes them a preferred choice in various applications.
The market faces challenges including fluctuations in raw material costs due to oil price changes, increasing environmental concerns, and competition from alternative piping materials.
Government policies aimed at ensuring quality standards, promoting sustainable practices, and investing in infrastructure development are significant influencers in the market.
Recent trends include a focus on sustainability, technological innovations in manufacturing processes, and increased investments in urban infrastructure projects, all contributing to a positive market outlook.
6Wresearch actively monitors the Brazil Plastic Pipes And Shapes Market and publishes its comprehensive annual report, highlighting emerging trends, growth drivers, revenue analysis, and forecast outlook. Our insights help businesses to make data-backed strategic decisions with ongoing market dynamics. Our analysts track relevent industries related to the Brazil Plastic Pipes And Shapes Market, allowing our clients with actionable intelligence and reliable forecasts tailored to emerging regional needs.
Yes, we provide customisation as per your requirements. To learn more, feel free to contact us on sales@6wresearch.com
1 Executive Summary |
2 Introduction |
2.1 Key Highlights of the Report |
2.2 Report Description |
2.3 Market Scope & Segmentation |
2.4 Research Methodology |
2.5 Assumptions |
3 Brazil Plastic Pipes And Shapes Market Overview |
3.1 Brazil Country Macro Economic Indicators |
3.2 Brazil Plastic Pipes And Shapes Market Revenues & Volume, 2022 & 2032F |
3.3 Brazil Plastic Pipes And Shapes Market - Industry Life Cycle |
3.4 Brazil Plastic Pipes And Shapes Market - Porter's Five Forces |
3.5 Brazil Plastic Pipes And Shapes Market Revenues & Volume Share, By Product Types, 2022 & 2032F |
3.6 Brazil Plastic Pipes And Shapes Market Revenues & Volume Share, By End-users, 2022 & 2032F |
4 Brazil Plastic Pipes And Shapes Market Dynamics |
4.1 Impact Analysis |
4.2 Market Drivers |
4.2.1 Increasing demand for plastic pipes and shapes in various industries such as construction, agriculture, and infrastructure development in Brazil. |
4.2.2 Growing awareness about the benefits of plastic pipes, such as durability, cost-effectiveness, and resistance to corrosion. |
4.2.3 Government initiatives promoting the use of plastic pipes and shapes for water supply, sanitation, and irrigation projects. |
4.3 Market Restraints |
4.3.1 Fluctuating prices of raw materials used in the manufacturing of plastic pipes and shapes, impacting the overall production costs. |
4.3.2 Competition from alternative materials such as metal and concrete pipes, which may hinder the market growth. |
4.3.3 Environmental concerns related to plastic usage, leading to potential regulatory challenges and consumer perception issues. |
5 Brazil Plastic Pipes And Shapes Market Trends |
6 Brazil Plastic Pipes And Shapes Market, By Types |
6.1 Brazil Plastic Pipes And Shapes Market, By Product Types |
6.1.1 Overview and Analysis |
6.1.2 Brazil Plastic Pipes And Shapes Market Revenues & Volume, By Product Types, 2022-2032F |
6.1.3 Brazil Plastic Pipes And Shapes Market Revenues & Volume, By Plastic Pipes and Pipe Fittings, 2022-2032F |
6.1.4 Brazil Plastic Pipes And Shapes Market Revenues & Volume, By Unlaminated Plastic Profile Shapes, 2022-2032F |
6.2 Brazil Plastic Pipes And Shapes Market, By End-users |
6.2.1 Overview and Analysis |
6.2.2 Brazil Plastic Pipes And Shapes Market Revenues & Volume, By Oil and Gas, 2022-2032F |
6.2.3 Brazil Plastic Pipes And Shapes Market Revenues & Volume, By Sewage/Drainage, 2022-2032F |
6.2.4 Brazil Plastic Pipes And Shapes Market Revenues & Volume, By Irrigation and Water Use, 2022-2032F |
6.2.5 Brazil Plastic Pipes And Shapes Market Revenues & Volume, By Industrial Use, 2022-2032F |
6.2.6 Brazil Plastic Pipes And Shapes Market Revenues & Volume, By Others, 2022-2032F |
7 Brazil Plastic Pipes And Shapes Market Import-Export Trade Statistics |
7.1 Brazil Plastic Pipes And Shapes Market Export to Major Countries |
7.2 Brazil Plastic Pipes And Shapes Market Imports from Major Countries |
8 Brazil Plastic Pipes And Shapes Market Key Performance Indicators |
8.1 Percentage of recycled materials used in the production of plastic pipes and shapes, indicating sustainability efforts. |
8.2 Research and development investment in new technologies for improving the quality and efficiency of plastic pipes. |
8.3 Number of infrastructure projects utilizing plastic pipes and shapes, reflecting market penetration and growth potential. |
9 Brazil Plastic Pipes And Shapes Market - Opportunity Assessment |
9.1 Brazil Plastic Pipes And Shapes Market Opportunity Assessment, By Product Types, 2022 & 2032F |
9.2 Brazil Plastic Pipes And Shapes Market Opportunity Assessment, By End-users, 2022 & 2032F |
10 Brazil Plastic Pipes And Shapes Market - Competitive Landscape |
10.1 Brazil Plastic Pipes And Shapes Market Revenue Share, By Companies, 2025 |
10.2 Brazil Plastic Pipes And Shapes Market Competitive Benchmarking, By Operating and Technical Parameters |
11 Company Profiles |
12 Recommendations |
13 Disclaimer |
Global Go To Market Strategy - 2030
Export potential enables firms to identify high-growth global markets with greater confidence by combining advanced trade intelligence with a structured quantitative methodology. The framework analyzes emerging demand trends and country-level import patterns while integrating macroeconomic and trade datasets such as GDP and population forecasts, bilateral import–export flows, tariff structures, elasticity differentials between developed and developing economies, geographic distance, and import demand projections. Using weighted trade values from 2020–2024 as the base period to project country-to-country export potential for 2030, these inputs are operationalized through calculated drivers such as gravity model parameters, tariff impact factors, and projected GDP per-capita growth. Through an analysis of hidden potentials, demand hotspots, and market conditions that are most favorable to success, this method enables firms to focus on target countries, maximize returns, and global expansion with data, backed by accuracy.
By factoring in the projected importer demand gap that is currently unmet and could be potential opportunity, it identifies the potential for the Exporter (Country) among 190 countries, against the general trade analysis, which identifies the biggest importer or exporter.
To discover high-growth global markets and optimize your business strategy:
Click Here
Pricing
- Single User License$ 1,995
- Department License$ 2,400
- Site License$ 3,120
- Global License$ 3,795

Leadership Perspectives from Industry Events
Search
Thought Leadership and Analyst Meet


Our Clients
6WResearch In News
- India Air Conditioner Market Set for Strong Rebound in 2026 After Weather-Led Correction and GST-Driven Recovery: 6Wresearch
- ADAS in India: How Automatic Emergency Braking, Blind Spot Detection & Driver Monitoring are Transforming Road Safety
- Doha a strategic location for EV manufacturing hub: IPA Qatar
- Demand for luxury TVs surging in the GCC, says Samsung
- Empowering Growth: The Thriving Journey of Bangladesh’s Cable Industry
- Demand for luxury TVs surging in the GCC, says Samsung
Latest Reports
- Nicaragua RPG Gaming Market (2026-2032)
- New Zealand RPG Gaming Market (2026-2032)
- Netherlands RPG Gaming Market (2026-2032)
- Nauru RPG Gaming Market (2026-2032)
- Namibia RPG Gaming Market (2026-2032)
- Mozambique RPG Gaming Market (2026-2032)
- Montenegro RPG Gaming Market (2026-2032)
- Mongolia RPG Gaming Market (2026-2032)
- Monaco RPG Gaming Market (2026-2032)
- Micronesia RPG Gaming Market (2026-2032)
Industry Events and Analyst Meet

EV India Expo 2026

HIMTEX 2026

India Refining Summit 2026

India EV Show 2026

EV tech India Expo 2026
Whitepaper
- Middle East & Africa Commercial Security Market Click here to view more.
- Middle East & Africa Fire Safety Systems & Equipment Market Click here to view more.
- GCC Drone Market Click here to view more.
- Middle East Lighting Fixture Market Click here to view more.
- GCC Physical & Perimeter Security Market Click here to view more.