Brazil Polysulfide Market Outlook | COVID-19 IMPACT, Value, Analysis, Companies, Growth, Size, Revenue, Industry, Share, Trends & Forecast
Market Forecast By Product Type (Thiokols, Solid Polysulfide Elastomers), By End Use (Automotive & Transportation, Industrial Processing & Application, Building & Construction, Protective Coatings, Specialty Chemicals, others) And Competitive Landscape
| Product Code: ETC342062 | Publication Date: Aug 2022 | Updated Date: Oct 2025 | Product Type: Market Research Report | |
| Publisher: 6Wresearch | Author: Shubham Padhi | No. of Pages: 75 | No. of Figures: 35 | No. of Tables: 20 |
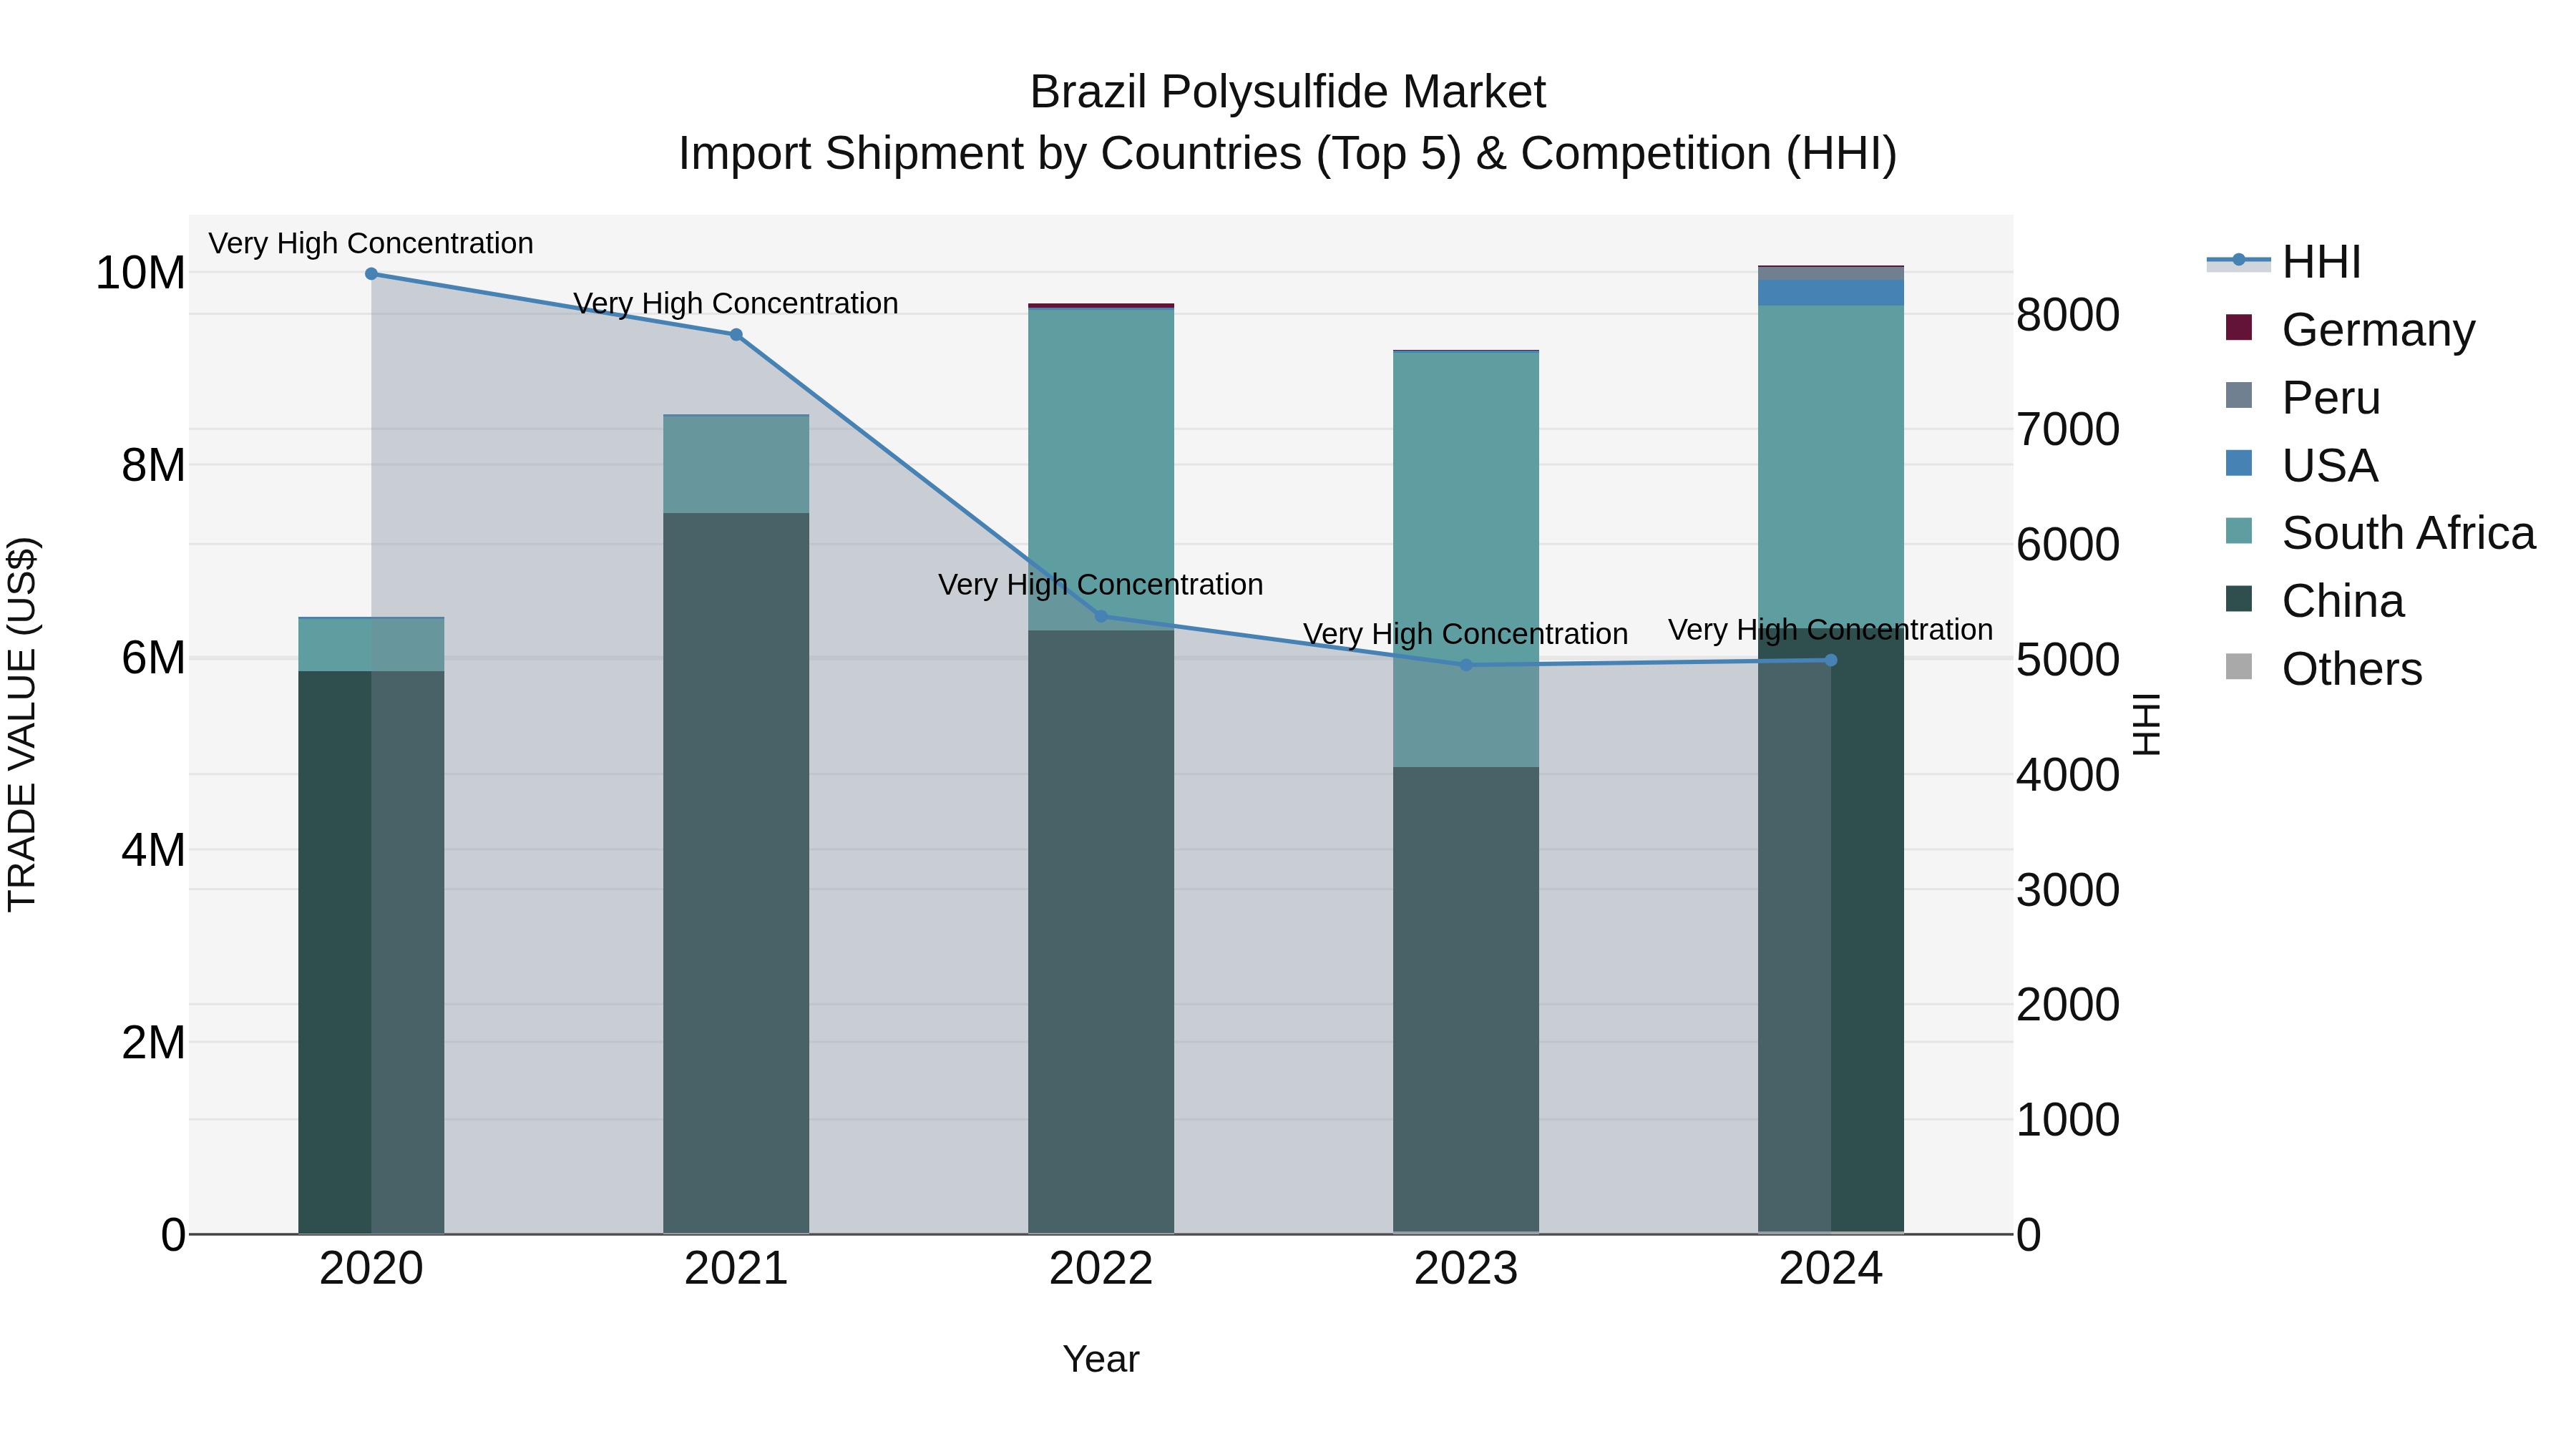
Brazil Polysulfide Market Top 5 Importing Countries and Market Competition (HHI) Analysis
Brazil`s polysulfide import shipments in 2024 continued to be dominated by top exporters such as China, South Africa, USA, Peru, and Germany. The high concentration of the Herfindahl-Hirschman Index (HHI) indicates a competitive market. With a strong compound annual growth rate (CAGR) of 11.91% from 2020 to 2024 and a notable growth rate of 9.52% from 2023 to 2024, the polysulfide market in Brazil demonstrates resilience and promising opportunities for further expansion.
Brazil Polysulfide Market Overview
The polysulfide market in Brazil demonstrates steady growth, propelled by its extensive use in sealants, adhesives, and coatings across various industrial applications. Manufacturers focus on product differentiation and technological advancements to enhance performance characteristics and meet evolving market demands.
Drivers of the market
The polysulfide market in Brazil is influenced by factors such as the demand from the construction industry for sealants, adhesives, and coatings with excellent chemical resistance and durability. Infrastructure development projects, including commercial and residential construction, contribute to market growth. Additionally, advancements in polysulfide formulations and application techniques drive market expansion by improving product performance and versatility.
Challenges of the market
In Brazil, the polysulfide market faces challenges such as stringent regulatory requirements and environmental standards governing product usage and disposal. Market players must invest in research and development to develop innovative applications and formulations that comply with evolving regulations. Moreover, competition from alternative materials and substitutes adds pressure on manufacturers to differentiate their products and enhance performance characteristics.
Government Policy of the market
Government policies governing the polysulfide market in Brazil prioritize environmental sustainability, product quality, and market competitiveness. Regulatory frameworks are designed to promote the adoption of eco-friendly manufacturing processes, waste reduction initiatives, and responsible disposal practices. Incentives such as tax credits, grants, and subsidies are provided to encourage investment in green technologies and innovation. Additionally, collaborative efforts between government agencies, industry associations, and research institutions facilitate knowledge exchange and capacity building, driving continuous improvement in the polysulfide market.
Key Highlights of the Report:
- Brazil Polysulfide Market Outlook
- Market Size of Brazil Polysulfide Market, 2024
- Forecast of Brazil Polysulfide Market, 2031
- Historical Data and Forecast of Brazil Polysulfide Revenues & Volume for the Period 2018 - 2031
- Brazil Polysulfide Market Trend Evolution
- Brazil Polysulfide Market Drivers and Challenges
- Brazil Polysulfide Price Trends
- Brazil Polysulfide Porter's Five Forces
- Brazil Polysulfide Industry Life Cycle
- Historical Data and Forecast of Brazil Polysulfide Market Revenues & Volume By Product Type for the Period 2018 - 2031
- Historical Data and Forecast of Brazil Polysulfide Market Revenues & Volume By Thiokols for the Period 2018 - 2031
- Historical Data and Forecast of Brazil Polysulfide Market Revenues & Volume By Solid Polysulfide Elastomers for the Period 2018 - 2031
- Historical Data and Forecast of Brazil Polysulfide Market Revenues & Volume By End Use for the Period 2018 - 2031
- Historical Data and Forecast of Brazil Polysulfide Market Revenues & Volume By Automotive & Transportation for the Period 2018 - 2031
- Historical Data and Forecast of Brazil Polysulfide Market Revenues & Volume By Industrial Processing & Application for the Period 2018 - 2031
- Historical Data and Forecast of Brazil Polysulfide Market Revenues & Volume By Building & Construction for the Period 2018 - 2031
- Historical Data and Forecast of Brazil Polysulfide Market Revenues & Volume By Protective Coatings for the Period 2018 - 2031
- Historical Data and Forecast of Brazil Polysulfide Market Revenues & Volume By Specialty Chemicals for the Period 2018 - 2031
- Historical Data and Forecast of Brazil Polysulfide Market Revenues & Volume By others for the Period 2018 - 2031
- Brazil Polysulfide Import Export Trade Statistics
- Market Opportunity Assessment By Product Type
- Market Opportunity Assessment By End Use
- Brazil Polysulfide Top Companies Market Share
- Brazil Polysulfide Competitive Benchmarking By Technical and Operational Parameters
- Brazil Polysulfide Company Profiles
- Brazil Polysulfide Key Strategic Recommendations
Frequently Asked Questions About the Market Study (FAQs):
6Wresearch actively monitors the Brazil Polysulfide Market and publishes its comprehensive annual report, highlighting emerging trends, growth drivers, revenue analysis, and forecast outlook. Our insights help businesses to make data-backed strategic decisions with ongoing market dynamics. Our analysts track relevent industries related to the Brazil Polysulfide Market, allowing our clients with actionable intelligence and reliable forecasts tailored to emerging regional needs.
Yes, we provide customisation as per your requirements. To learn more, feel free to contact us on sales@6wresearch.com
1 Executive Summary |
2 Introduction |
2.1 Key Highlights of the Report |
2.2 Report Description |
2.3 Market Scope & Segmentation |
2.4 Research Methodology |
2.5 Assumptions |
3 Brazil Polysulfide Market Overview |
3.1 Brazil Country Macro Economic Indicators |
3.2 Brazil Polysulfide Market Revenues & Volume, 2021 & 2031F |
3.3 Brazil Polysulfide Market - Industry Life Cycle |
3.4 Brazil Polysulfide Market - Porter's Five Forces |
3.5 Brazil Polysulfide Market Revenues & Volume Share, By Product Type, 2021 & 2031F |
3.6 Brazil Polysulfide Market Revenues & Volume Share, By End Use, 2021 & 2031F |
4 Brazil Polysulfide Market Dynamics |
4.1 Impact Analysis |
4.2 Market Drivers |
4.2.1 Increasing demand for waterproofing solutions in construction industry |
4.2.2 Growing adoption of polysulfide sealants due to their durability and chemical resistance |
4.2.3 Rise in infrastructure development projects in Brazil |
4.3 Market Restraints |
4.3.1 Fluctuating raw material prices impacting production costs |
4.3.2 Stringent regulations related to environmental impact and safety concerns |
5 Brazil Polysulfide Market Trends |
6 Brazil Polysulfide Market, By Types |
6.1 Brazil Polysulfide Market, By Product Type |
6.1.1 Overview and Analysis |
6.1.2 Brazil Polysulfide Market Revenues & Volume, By Product Type, 2021-2031F |
6.1.3 Brazil Polysulfide Market Revenues & Volume, By Thiokols, 2021-2031F |
6.1.4 Brazil Polysulfide Market Revenues & Volume, By Solid Polysulfide Elastomers, 2021-2031F |
6.2 Brazil Polysulfide Market, By End Use |
6.2.1 Overview and Analysis |
6.2.2 Brazil Polysulfide Market Revenues & Volume, By Automotive & Transportation, 2021-2031F |
6.2.3 Brazil Polysulfide Market Revenues & Volume, By Industrial Processing & Application, 2021-2031F |
6.2.4 Brazil Polysulfide Market Revenues & Volume, By Building & Construction, 2021-2031F |
6.2.5 Brazil Polysulfide Market Revenues & Volume, By Protective Coatings, 2021-2031F |
6.2.6 Brazil Polysulfide Market Revenues & Volume, By Specialty Chemicals, 2021-2031F |
6.2.7 Brazil Polysulfide Market Revenues & Volume, By others, 2021-2031F |
7 Brazil Polysulfide Market Import-Export Trade Statistics |
7.1 Brazil Polysulfide Market Export to Major Countries |
7.2 Brazil Polysulfide Market Imports from Major Countries |
8 Brazil Polysulfide Market Key Performance Indicators |
8.1 Number of construction permits issued in Brazil |
8.2 Percentage of infrastructure projects utilizing polysulfide sealants |
8.3 Research and development investment in polysulfide technology |
9 Brazil Polysulfide Market - Opportunity Assessment |
9.1 Brazil Polysulfide Market Opportunity Assessment, By Product Type, 2021 & 2031F |
9.2 Brazil Polysulfide Market Opportunity Assessment, By End Use, 2021 & 2031F |
10 Brazil Polysulfide Market - Competitive Landscape |
10.1 Brazil Polysulfide Market Revenue Share, By Companies, 2024 |
10.2 Brazil Polysulfide Market Competitive Benchmarking, By Operating and Technical Parameters |
11 Company Profiles |
12 Recommendations |
13 Disclaimer |
Global Go To Market Strategy - 2030
Export potential enables firms to identify high-growth global markets with greater confidence by combining advanced trade intelligence with a structured quantitative methodology. The framework analyzes emerging demand trends and country-level import patterns while integrating macroeconomic and trade datasets such as GDP and population forecasts, bilateral import–export flows, tariff structures, elasticity differentials between developed and developing economies, geographic distance, and import demand projections. Using weighted trade values from 2020–2024 as the base period to project country-to-country export potential for 2030, these inputs are operationalized through calculated drivers such as gravity model parameters, tariff impact factors, and projected GDP per-capita growth. Through an analysis of hidden potentials, demand hotspots, and market conditions that are most favorable to success, this method enables firms to focus on target countries, maximize returns, and global expansion with data, backed by accuracy.
By factoring in the projected importer demand gap that is currently unmet and could be potential opportunity, it identifies the potential for the Exporter (Country) among 190 countries, against the general trade analysis, which identifies the biggest importer or exporter.
To discover high-growth global markets and optimize your business strategy:
Click Here
Pricing
- Single User License$ 1,995
- Department License$ 2,400
- Site License$ 3,120
- Global License$ 3,795

Leadership Perspectives from Industry Events
Search
Thought Leadership and Analyst Meet


Our Clients
6WResearch In News
- India Air Conditioner Market Set for Strong Rebound in 2026 After Weather-Led Correction and GST-Driven Recovery: 6Wresearch
- ADAS in India: How Automatic Emergency Braking, Blind Spot Detection & Driver Monitoring are Transforming Road Safety
- Doha a strategic location for EV manufacturing hub: IPA Qatar
- Demand for luxury TVs surging in the GCC, says Samsung
- Empowering Growth: The Thriving Journey of Bangladesh’s Cable Industry
- Demand for luxury TVs surging in the GCC, says Samsung
Latest Reports
- Poland Fire Protection Systems Market (2026-2032)
- Cape Verde Portable Hand-Thrown Extinguisher Market (2026-2032)
- Canada Portable Hand-Thrown Extinguisher Market (2026-2032)
- Cameroon Portable Hand-Thrown Extinguisher Market (2026-2032)
- Burundi Portable Hand-Thrown Extinguisher Market (2026-2032)
- Burkina Faso Portable Hand-Thrown Extinguisher Market (2026-2032)
- Bulgaria Portable Hand-Thrown Extinguisher Market (2026-2032)
- Brunei Portable Hand-Thrown Extinguisher Market (2026-2032)
- Botswana Portable Hand-Thrown Extinguisher Market (2026-2032)
- Bosnia and Herzegovina Portable Hand-Thrown Extinguisher Market (2026-2032)
Industry Events and Analyst Meet

HIMTEX 2026

India Refining Summit 2026

India EV Show 2026

EV tech India Expo 2026

Auto Tech Asia 2026
Whitepaper
- Middle East & Africa Commercial Security Market Click here to view more.
- Middle East & Africa Fire Safety Systems & Equipment Market Click here to view more.
- GCC Drone Market Click here to view more.
- Middle East Lighting Fixture Market Click here to view more.
- GCC Physical & Perimeter Security Market Click here to view more.