Brazil Processed Fruit Market Summary
The brazil processed fruit market was estimated at USD 378 Million in 2025 and is projected to reach USD 451 Million by 2032, growing at a CAGR of 3.3% from 2026 to 2032.
Brazil Processed Fruit Market Year-wise Growth Rate and Key Drivers
This graph highlights how the Brazil Processed Fruit Market has steadily grown over the years, supported by major growth factors.
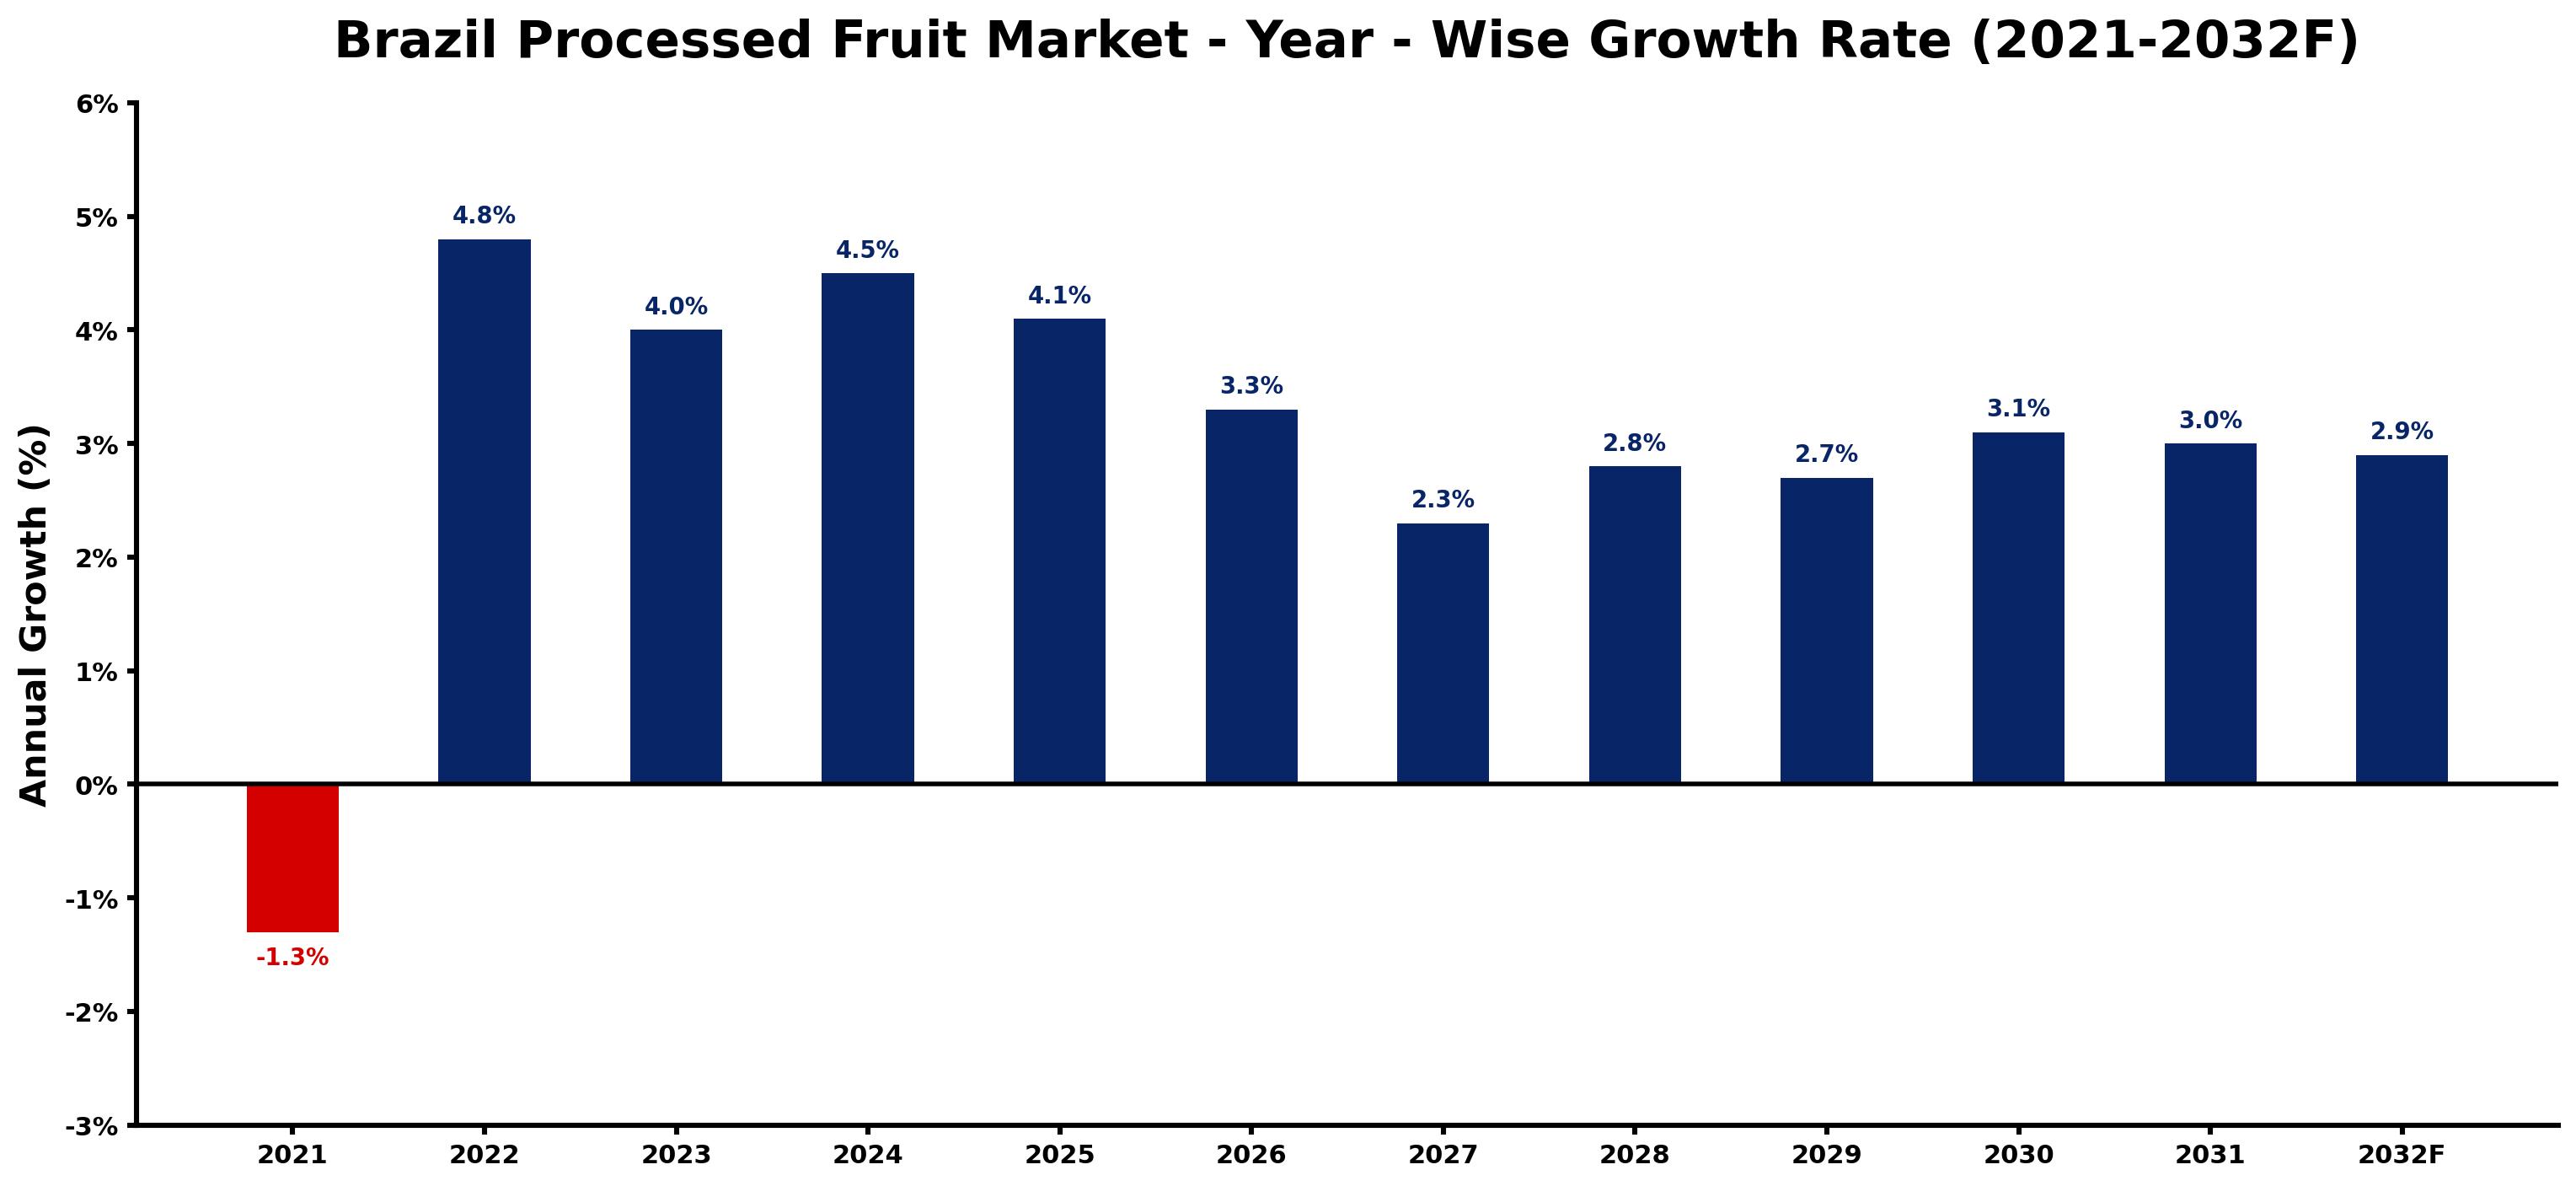
The table below presents the year wise growth rates along with the key drivers influencing the market
| Year | Growth Rate | Major Drivers |
| 2021 | -1.3% | Adverse weather conditions negatively impacted crop yields, causing supply shortages and pricing volatility in processed fruit. |
| 2022 | 4.8% | Health-conscious trends propelled the popularity of organic and natural processed fruits. |
| 2023 | 4.0% | Retailers expanded their online platforms, enhancing accessibility to processed fruit products. |
| 2024 | 4.5% | Local sourcing initiatives gained traction, boosting domestic processed fruit production capabilities. |
| 2025 | 4.1% | Innovations in packaging technology improved shelf life, attracting more consumers to products. |
| 2026 | 3.3% | Culinary trends embraced processed fruits, integrating them into diverse regional recipes. |
| 2027 | 2.3% | Increased tourism in urban areas spurred demand for convenient snacking options. |
| 2028 | 2.8% | Sustainability movements encouraged brands to adopt eco-friendly practices, appealing to consumers. |
| 2029 | 2.7% | Investment in cold chain logistics enhanced distribution efficiency for processed fruit products. |
| 2030 | 3.1% | Health benefits associated with processed fruits became a central theme in marketing strategies. |
| 2031 | 3.0% | Emerging foodservice sectors increasingly incorporated processed fruits into their offerings. |
| 2032 | 2.9% | Market consolidation led to a wider variety of products, catering to diverse consumer preferences. |
Note - Market size estimations and growth projections presented in this report are based on 6Wresearch's advanced forecasting approach, validated with industry datasets as of June 2026.
Brazil Processed Fruit Market Synopsis
The Brazil Processed Fruit Market is projected to reach 3.3% and witness significant growth during the forecast period (2026-2032). This market draws from Brazil's diverse agricultural practices, focusing on extending the shelf life and enhancing the quality of various fruits through processing methods. Key products in this domain include fruit juices, jams, dried fruits, and canned offerings, which resonate with the burgeoning consumer demand for convenient and healthy options.
Brazil Processed Fruit Market Growth Drivers
The growth of the Brazil Processed Fruit Market is primarily fueled by several interrelated factors. First, the increasing consumer awareness regarding nutrition and health benefits associated with processed fruits is significantly boosting sales. Many consumers now seek products that offer both convenience and health advantages. Second, urbanization and changing lifestyles have led to a heightened demand for ready-to-eat and quick preparation fruit products, pushing market growth forward.
- Health consciousness among Brazilian consumers is leading to a rise in the consumption of processed fruits, which are often perceived as healthier alternatives to snacks.
- The convenience factor cannot be understated; as people face busier lifestyles, they increasingly prefer ready-to-use fruit products that fit seamlessly into their daily routines.
- The development of innovative processing technologies has enabled manufacturers to enhance the nutritional profile of fruit products while simultaneously catering to consumer preferences for taste and presentation.
- Increased availability of processed fruit products in local supermarkets and online platforms has facilitated easier access for consumers, thereby driving market expansion.
- Seasonal and regional variations can often lead to fruit surplus; processing them into value-added products ensures that farmers can capitalize on these abundances, stabilizing market supply.
Brazil Processed Fruit Market Challenges and Restraints
Despite the positive growth outlook, the Brazil Processed Fruit Market faces several challenges. One of the most significant hurdles is related to supply chain disruptions. The perishable nature of fruits necessitates rigorous logistics capabilities to maintain quality from farm to consumer. Additionally, inadequate infrastructure in certain regions may limit the efficiency of distribution.
- Supply chain inefficiencies can lead to wastage of fresh produce, impacting overall market availability and pricing.
- The need to adhere to stringent regulatory standards regarding food safety and quality often requires investment in advanced technologies, which can be a barrier for smaller operators.
- Competition from unprocessed fruits, which may be perceived as fresher or more natural, poses a constant challenge to the processed segment.
- Consumer skepticism about additives and preservatives often leads to demands for transparency concerning ingredient sourcing, compelling companies to adapt their marketing strategies.
- Economic fluctuations can lead to uncertainties in consumer spending, affecting overall market growth and profitability.
Brazil Processed Fruit Market Government Investment and Initiatives
The Brazilian government plays an integral role in supporting the processed fruit sector through various policies and initiatives. Recognizing the importance of food safety and traceability, regulatory frameworks have been established to ensure compliance with health standards. Furthermore, initiatives aimed at promoting sustainable farming practices are helping to secure the future of the agricultural landscape in Brazil.
- Investment in infrastructure improvements is pivotal, as enhanced transportation networks are necessary for effective distribution within the processed fruit sector.
- The government has introduced subsidies for local farmers, ensuring that small-scale producers have the resources required to enter the processed fruit market.
- Educational programs aimed at cultivating awareness around food safety and modern agricultural practices are actively promoted by government agencies.
- There are also incentives for investing in sustainable and eco-friendly production methods, aligning with global trends focused on environmental responsibility.
- Collaboration between agricultural universities and the processed fruit industry is encouraged to foster innovation and research in fruit preservation technologies.
Brazil Processed Fruit Market Latest Developments (May 2025 - June 2026)
Recent industry trends indicate a growing inclination towards organic and minimally processed fruit products in the Brazil Processed Fruit Market. This evolution is primarily driven by heightened consumer health awareness and changing dietary preferences. Research and development efforts are being directed towards improving product formulations to enhance both nutritional value and taste.
- Emerging trends highlight a significant increase in the popularity of cold-pressed juices, a segment that emphasizes freshness and minimal processing.
- Collaborations between local producers and technology firms have been established to innovate packaging solutions that prolong shelf life without compromising quality.
- Consumer feedback loops are now more prominent, as companies are actively engaging with customers to tailor products that meet specific health demands.
- The rise of online grocery shopping has spurred companies to enhance their digital presence, broadening their reach to consumers who prioritize convenience and accessibility.
- Investments in automation and supply chain technology are beginning to modernize operations, improving both efficiency and responsiveness to market changes.
Brazil Processed Fruit Market - Key Attractiveness of the Report
- 10 Years of Market Numbers
- Historical Data Starting from 2022 to 2025
- Base Year: 2025
- Forecast Data until 2032
- Key Performance Indicators Impacting the Market
- Major Upcoming Developments and Projects
Key Highlights of the Report:
- Brazil Processed Fruit Market Outlook
- Market Size of Brazil Processed Fruit Market, 2025
- Forecast of Brazil Processed Fruit Market, 2032
- Historical Data and Forecast of Brazil Processed Fruit Revenues & Volume for the Period 2022-2032F
- Brazil Processed Fruit Market Trend Evolution
- Brazil Processed Fruit Market Drivers and Challenges
- Brazil Processed Fruit Price Trends
- Brazil Processed Fruit Porter's Five Forces
- Brazil Processed Fruit Industry Life Cycle
- Historical Data and Forecast of Brazil Processed Fruit Market Revenues & Volume By Product for the Period 2022-2032F
- Historical Data and Forecast of Brazil Processed Fruit Market Revenues & Volume By Fresh for the Period 2022-2032F
- Historical Data and Forecast of Brazil Processed Fruit Market Revenues & Volume By Fresh- Cut for the Period 2022-2032F
- Historical Data and Forecast of Brazil Processed Fruit Market Revenues & Volume By Canned for the Period 2022-2032F
- Historical Data and Forecast of Brazil Processed Fruit Market Revenues & Volume By Frozen for the Period 2022-2032F
- Historical Data and Forecast of Brazil Processed Fruit Market Revenues & Volume By Drying &Dehydration for the Period 2022-2032F
- Historical Data and Forecast of Brazil Processed Fruit Market Revenues & Volume By Processing Equipment for the Period 2022-2032F
- Historical Data and Forecast of Brazil Processed Fruit Market Revenues & Volume By Pre-processing for the Period 2022-2032F
- Historical Data and Forecast of Brazil Processed Fruit Market Revenues & Volume By Processing for the Period 2022-2032F
- Historical Data and Forecast of Brazil Processed Fruit Market Revenues & Volume By Washing for the Period 2022-2032F
- Historical Data and Forecast of Brazil Processed Fruit Market Revenues & Volume By Filling for the Period 2022-2032F
- Historical Data and Forecast of Brazil Processed Fruit Market Revenues & Volume By Seasoning for the Period 2022-2032F
- Historical Data and Forecast of Brazil Processed Fruit Market Revenues & Volume By Packaging for the Period 2022-2032F
- Brazil Processed Fruit Import Export Trade Statistics
- Market Opportunity Assessment By Product
- Market Opportunity Assessment By Processing Equipment
- Brazil Processed Fruit Top Companies Market Share
- Brazil Processed Fruit Competitive Benchmarking By Technical and Operational Parameters
- Brazil Processed Fruit Company Profiles
- Brazil Processed Fruit Key Strategic Recommendations






































