Brazil Silica Sand For Glass Making Market (2025-2031) Outlook | Trends, Industry, Value, Forecast, Revenue, Analysis, Growth, Size, Companies & Share
Market Forecast By Application (Flat Glass, Fiber Glass, Glass Containers, Special & Technical, Tableware Glass, Others), By Purity (High Purity, Ultra High Purity) And Competitive Landscape
| Product Code: ETC346562 | Publication Date: Aug 2022 | Updated Date: Oct 2025 | Product Type: Market Research Report | |
| Publisher: 6Wresearch | Author: Ravi Bhandari | No. of Pages: 75 | No. of Figures: 35 | No. of Tables: 20 |
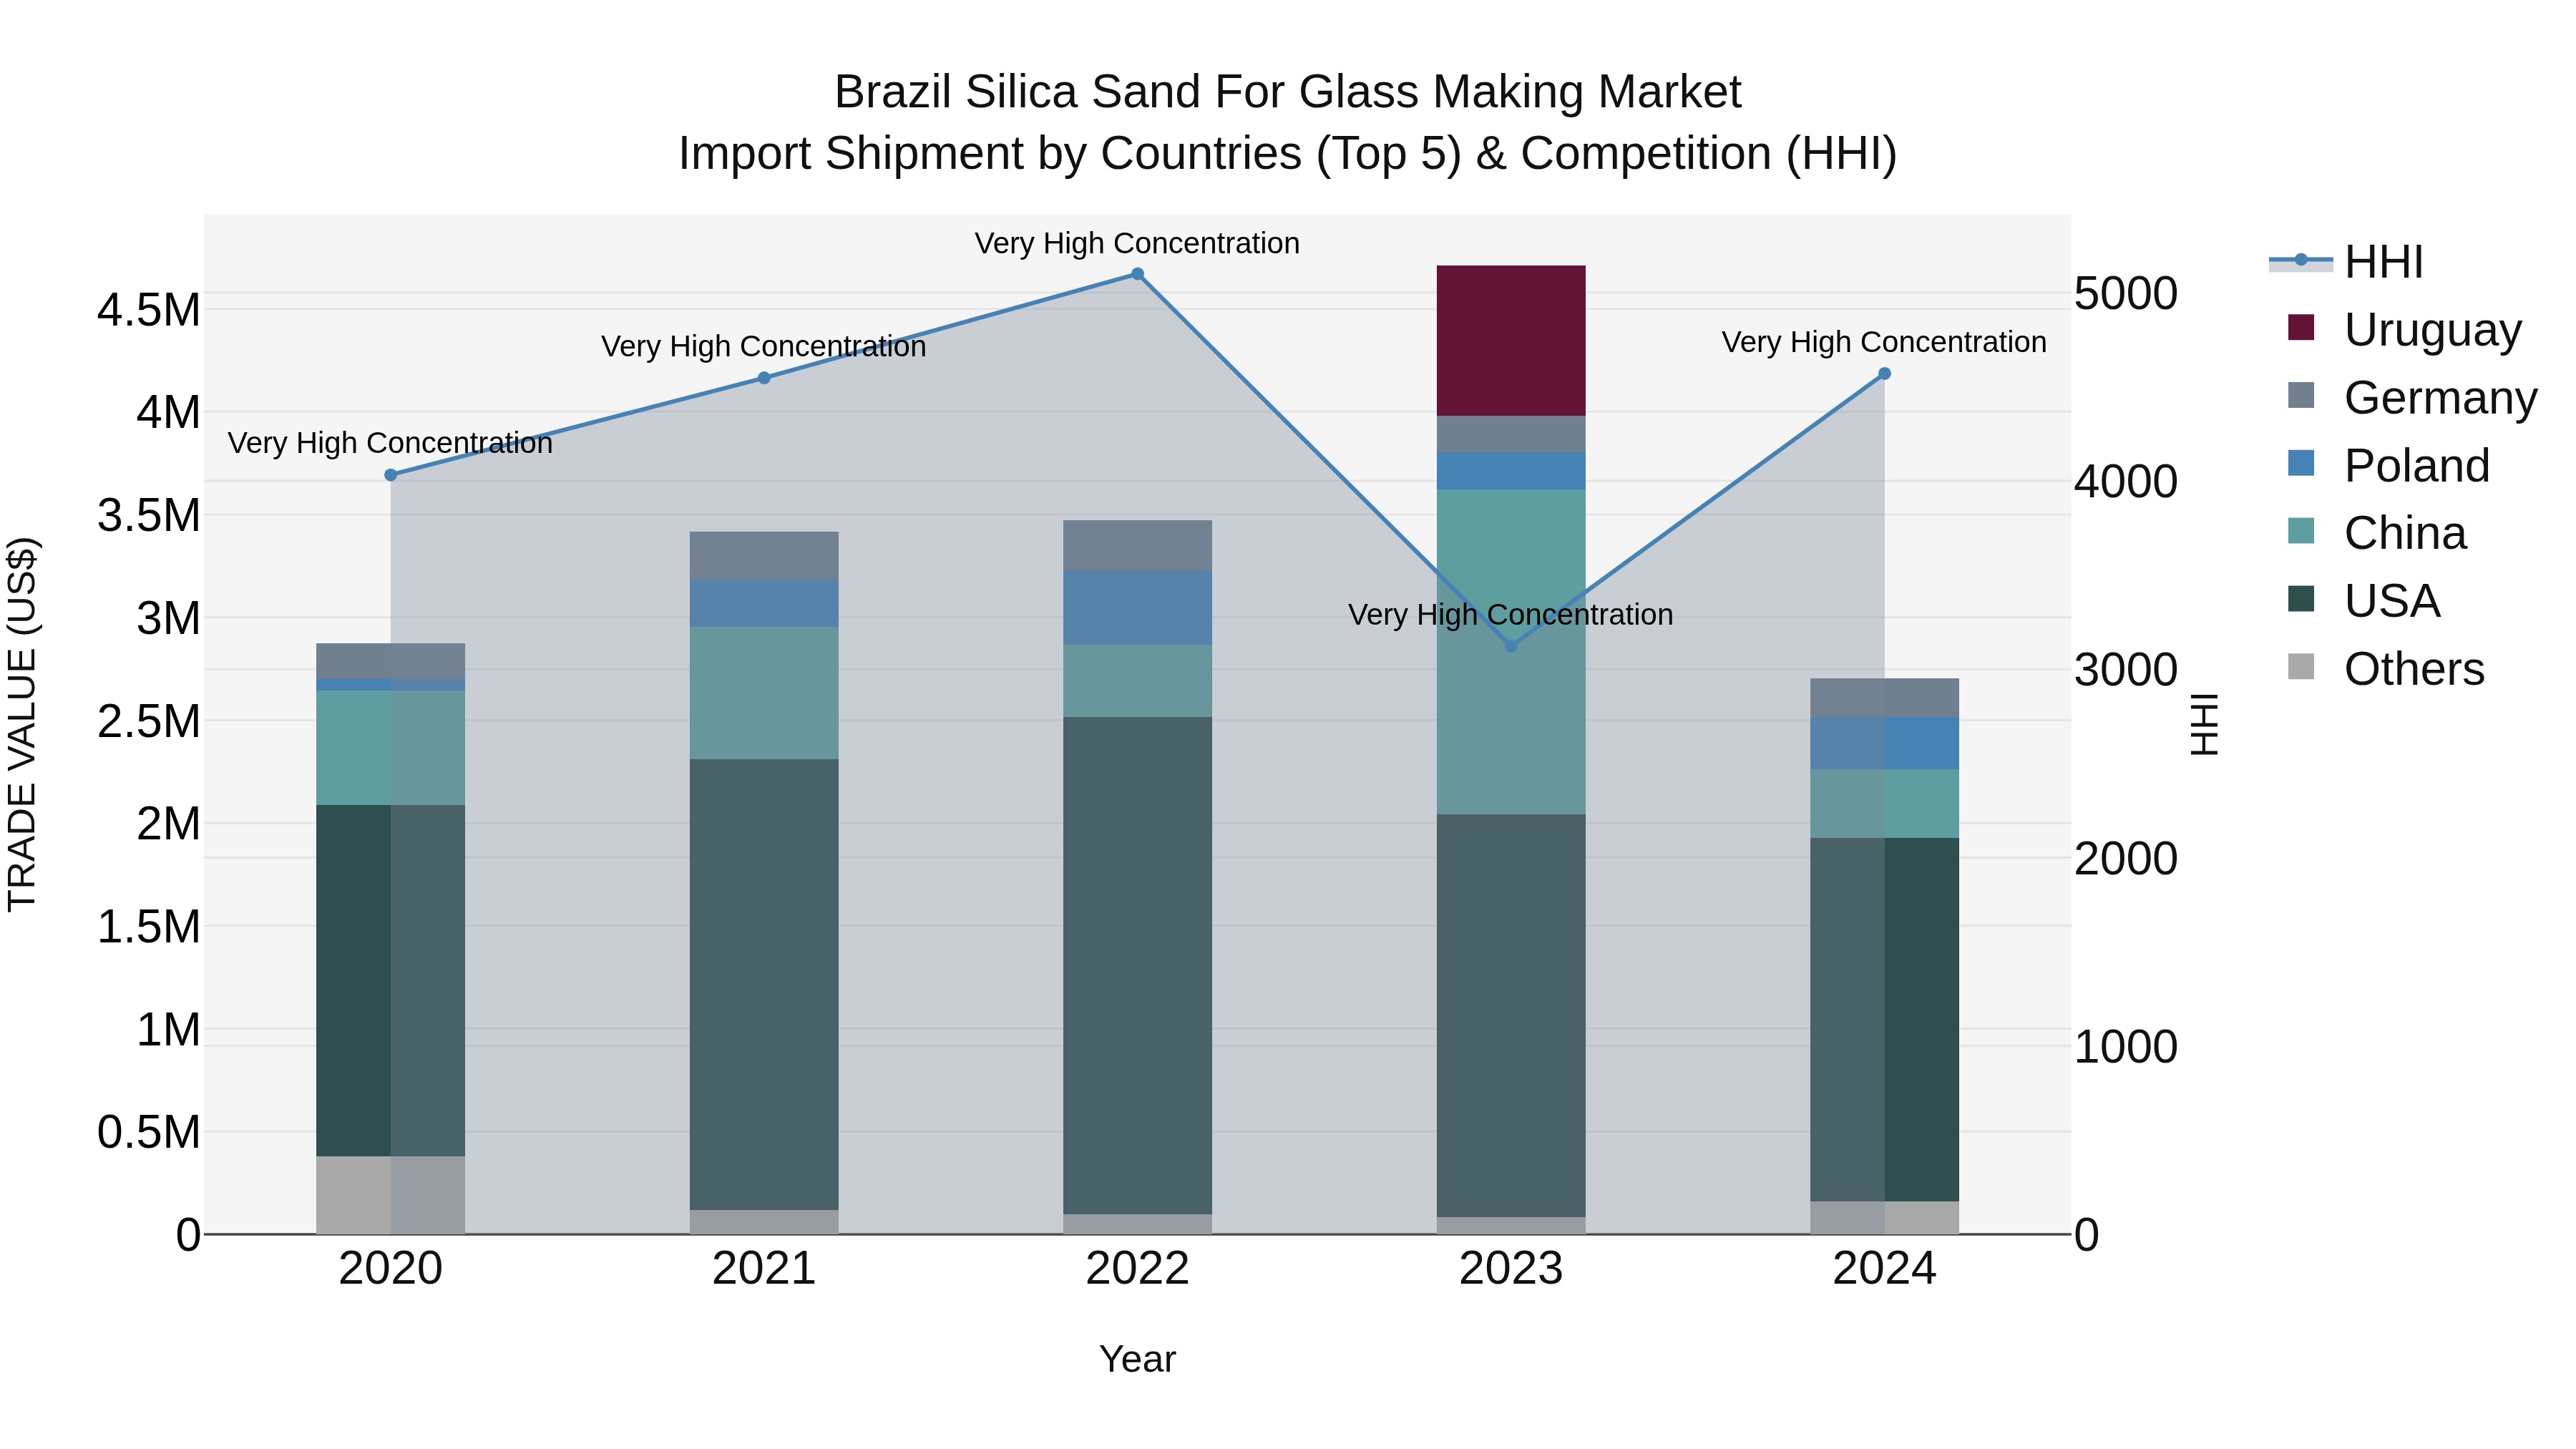
Brazil Silica Sand for Glass Making Market Top 5 Importing Countries and Market Competition (HHI) Analysis
Despite the high concentration of top exporting countries like the USA, China, Poland, Germany, and Belgium, Brazil saw a significant decline in silica sand imports for glass making in 2024, with a negative compound annual growth rate (CAGR) of -1.5% from 2020 to 2024. The sharp drop in growth rate from 2023 to 2024 at -42.58% indicates a challenging year for the market. It will be crucial for industry players to closely monitor these trends and potentially explore strategies to revitalize the silica sand import market in Brazil.
Brazil Silica Sand For Glass Making Market Overview
The demand for silica sand for glassmaking in Brazil is driven by the construction, automotive, and packaging sectors. High-quality silica sand is essential for producing clear, durable, and aesthetically pleasing glass products. Market players focus on securing consistent supply sources, optimizing production processes, and meeting stringent quality standards to maintain competitiveness in this specialized market segment.
Drivers of the market
In Brazil, the silica sand for glassmaking market is driven by the glass manufacturing industry`s demand for high-quality silica sand with specific chemical and physical properties. Factors such as glass quality standards, architectural trends, and consumer preferences for sustainable materials influence market dynamics. Technological advancements in glassmaking processes also impact silica sand requirements.
Challenges of the market
The market for silica sand for glass making in Brazil faces challenges such as sourcing high-purity sand deposits, ensuring consistent quality, and meeting specific particle size requirements. Fluctuations in demand from the construction and automotive industries impact market dynamics. Additionally, addressing environmental and sustainability concerns related to sand extraction and processing presents ongoing challenges for industry stakeholders.
Government Policy of the market
Government policies in the silica sand for glass making market aim to support the glass industry`s supply chain and product quality. Measures focus on sourcing high-purity silica sand, implementing standards for glass production, and fostering partnerships between manufacturers and raw material suppliers to enhance industry competitiveness.
Key Highlights of the Report:
- Brazil Silica Sand For Glass Making Market Outlook
- Market Size of Brazil Silica Sand For Glass Making Market, 2024
- Forecast of Brazil Silica Sand For Glass Making Market, 2031
- Historical Data and Forecast of Brazil Silica Sand For Glass Making Revenues & Volume for the Period 2021-2031
- Brazil Silica Sand For Glass Making Market Trend Evolution
- Brazil Silica Sand For Glass Making Market Drivers and Challenges
- Brazil Silica Sand For Glass Making Price Trends
- Brazil Silica Sand For Glass Making Porter's Five Forces
- Brazil Silica Sand For Glass Making Industry Life Cycle
- Historical Data and Forecast of Brazil Silica Sand For Glass Making Market Revenues & Volume By Application for the Period 2021-2031
- Historical Data and Forecast of Brazil Silica Sand For Glass Making Market Revenues & Volume By Flat Glass for the Period 2021-2031
- Historical Data and Forecast of Brazil Silica Sand For Glass Making Market Revenues & Volume By Fiber Glass for the Period 2021-2031
- Historical Data and Forecast of Brazil Silica Sand For Glass Making Market Revenues & Volume By Glass Containers for the Period 2021-2031
- Historical Data and Forecast of Brazil Silica Sand For Glass Making Market Revenues & Volume By Special & Technical for the Period 2021-2031
- Historical Data and Forecast of Brazil Silica Sand For Glass Making Market Revenues & Volume By Tableware Glass for the Period 2021-2031
- Historical Data and Forecast of Brazil Silica Sand For Glass Making Market Revenues & Volume By Others for the Period 2021-2031
- Historical Data and Forecast of Brazil Silica Sand For Glass Making Market Revenues & Volume By Purity for the Period 2021-2031
- Historical Data and Forecast of Brazil Silica Sand For Glass Making Market Revenues & Volume By High Purity for the Period 2021-2031
- Historical Data and Forecast of Brazil Silica Sand For Glass Making Market Revenues & Volume By Ultra High Purity for the Period 2021-2031
- Brazil Silica Sand For Glass Making Import Export Trade Statistics
- Market Opportunity Assessment By Application
- Market Opportunity Assessment By Purity
- Brazil Silica Sand For Glass Making Top Companies Market Share
- Brazil Silica Sand For Glass Making Competitive Benchmarking By Technical and Operational Parameters
- Brazil Silica Sand For Glass Making Company Profiles
- Brazil Silica Sand For Glass Making Key Strategic Recommendations
Frequently Asked Questions About the Market Study (FAQs):
6Wresearch actively monitors the Brazil Silica Sand For Glass Making Market and publishes its comprehensive annual report, highlighting emerging trends, growth drivers, revenue analysis, and forecast outlook. Our insights help businesses to make data-backed strategic decisions with ongoing market dynamics. Our analysts track relevent industries related to the Brazil Silica Sand For Glass Making Market, allowing our clients with actionable intelligence and reliable forecasts tailored to emerging regional needs.
Yes, we provide customisation as per your requirements. To learn more, feel free to contact us on sales@6wresearch.com
1 Executive Summary |
2 Introduction |
2.1 Key Highlights of the Report |
2.2 Report Description |
2.3 Market Scope & Segmentation |
2.4 Research Methodology |
2.5 Assumptions |
3 Brazil Silica Sand For Glass Making Market Overview |
3.1 Brazil Country Macro Economic Indicators |
3.2 Brazil Silica Sand For Glass Making Market Revenues & Volume, 2021 & 2031F |
3.3 Brazil Silica Sand For Glass Making Market - Industry Life Cycle |
3.4 Brazil Silica Sand For Glass Making Market - Porter's Five Forces |
3.5 Brazil Silica Sand For Glass Making Market Revenues & Volume Share, By Application, 2021 & 2031F |
3.6 Brazil Silica Sand For Glass Making Market Revenues & Volume Share, By Purity, 2021 & 2031F |
4 Brazil Silica Sand For Glass Making Market Dynamics |
4.1 Impact Analysis |
4.2 Market Drivers |
4.2.1 Increasing demand for glass products in construction and automotive industries |
4.2.2 Growing emphasis on sustainable manufacturing practices |
4.2.3 Technological advancements in silica sand extraction and processing methods |
4.3 Market Restraints |
4.3.1 Fluctuating raw material prices |
4.3.2 Environmental concerns related to silica sand mining activities |
4.3.3 Competition from alternative materials in the glass-making industry |
5 Brazil Silica Sand For Glass Making Market Trends |
6 Brazil Silica Sand For Glass Making Market, By Types |
6.1 Brazil Silica Sand For Glass Making Market, By Application |
6.1.1 Overview and Analysis |
6.1.2 Brazil Silica Sand For Glass Making Market Revenues & Volume, By Application, 2021-2031F |
6.1.3 Brazil Silica Sand For Glass Making Market Revenues & Volume, By Flat Glass, 2021-2031F |
6.1.4 Brazil Silica Sand For Glass Making Market Revenues & Volume, By Fiber Glass, 2021-2031F |
6.1.5 Brazil Silica Sand For Glass Making Market Revenues & Volume, By Glass Containers, 2021-2031F |
6.1.6 Brazil Silica Sand For Glass Making Market Revenues & Volume, By Special & Technical, 2021-2031F |
6.1.7 Brazil Silica Sand For Glass Making Market Revenues & Volume, By Tableware Glass, 2021-2031F |
6.1.8 Brazil Silica Sand For Glass Making Market Revenues & Volume, By Others, 2021-2031F |
6.2 Brazil Silica Sand For Glass Making Market, By Purity |
6.2.1 Overview and Analysis |
6.2.2 Brazil Silica Sand For Glass Making Market Revenues & Volume, By High Purity, 2021-2031F |
6.2.3 Brazil Silica Sand For Glass Making Market Revenues & Volume, By Ultra High Purity, 2021-2031F |
7 Brazil Silica Sand For Glass Making Market Import-Export Trade Statistics |
7.1 Brazil Silica Sand For Glass Making Market Export to Major Countries |
7.2 Brazil Silica Sand For Glass Making Market Imports from Major Countries |
8 Brazil Silica Sand For Glass Making Market Key Performance Indicators |
8.1 Sustainability metrics related to silica sand extraction and processing |
8.2 Energy efficiency improvements in the production process |
8.3 Quality control measures in silica sand grading and purity levels |
9 Brazil Silica Sand For Glass Making Market - Opportunity Assessment |
9.1 Brazil Silica Sand For Glass Making Market Opportunity Assessment, By Application, 2021 & 2031F |
9.2 Brazil Silica Sand For Glass Making Market Opportunity Assessment, By Purity, 2021 & 2031F |
10 Brazil Silica Sand For Glass Making Market - Competitive Landscape |
10.1 Brazil Silica Sand For Glass Making Market Revenue Share, By Companies, 2024 |
10.2 Brazil Silica Sand For Glass Making Market Competitive Benchmarking, By Operating and Technical Parameters |
11 Company Profiles |
12 Recommendations |
13 Disclaimer |
Global Go To Market Strategy - 2030
Export potential enables firms to identify high-growth global markets with greater confidence by combining advanced trade intelligence with a structured quantitative methodology. The framework analyzes emerging demand trends and country-level import patterns while integrating macroeconomic and trade datasets such as GDP and population forecasts, bilateral import–export flows, tariff structures, elasticity differentials between developed and developing economies, geographic distance, and import demand projections. Using weighted trade values from 2020–2024 as the base period to project country-to-country export potential for 2030, these inputs are operationalized through calculated drivers such as gravity model parameters, tariff impact factors, and projected GDP per-capita growth. Through an analysis of hidden potentials, demand hotspots, and market conditions that are most favorable to success, this method enables firms to focus on target countries, maximize returns, and global expansion with data, backed by accuracy.
By factoring in the projected importer demand gap that is currently unmet and could be potential opportunity, it identifies the potential for the Exporter (Country) among 190 countries, against the general trade analysis, which identifies the biggest importer or exporter.
To discover high-growth global markets and optimize your business strategy:
Click Here
Pricing
- Single User License$ 1,995
- Department License$ 2,400
- Site License$ 3,120
- Global License$ 3,795

Leadership Perspectives from Industry Events
Search
Thought Leadership and Analyst Meet


Our Clients
6WResearch In News
- India Air Conditioner Market Set for Strong Rebound in 2026 After Weather-Led Correction and GST-Driven Recovery: 6Wresearch
- ADAS in India: How Automatic Emergency Braking, Blind Spot Detection & Driver Monitoring are Transforming Road Safety
- Doha a strategic location for EV manufacturing hub: IPA Qatar
- Demand for luxury TVs surging in the GCC, says Samsung
- Empowering Growth: The Thriving Journey of Bangladesh’s Cable Industry
- Demand for luxury TVs surging in the GCC, says Samsung
Latest Reports
- Nicaragua RPG Gaming Market (2026-2032)
- New Zealand RPG Gaming Market (2026-2032)
- Netherlands RPG Gaming Market (2026-2032)
- Nauru RPG Gaming Market (2026-2032)
- Namibia RPG Gaming Market (2026-2032)
- Mozambique RPG Gaming Market (2026-2032)
- Montenegro RPG Gaming Market (2026-2032)
- Mongolia RPG Gaming Market (2026-2032)
- Monaco RPG Gaming Market (2026-2032)
- Micronesia RPG Gaming Market (2026-2032)
Industry Events and Analyst Meet

EV India Expo 2026

HIMTEX 2026

India Refining Summit 2026

India EV Show 2026

EV tech India Expo 2026
Whitepaper
- Middle East & Africa Commercial Security Market Click here to view more.
- Middle East & Africa Fire Safety Systems & Equipment Market Click here to view more.
- GCC Drone Market Click here to view more.
- Middle East Lighting Fixture Market Click here to view more.
- GCC Physical & Perimeter Security Market Click here to view more.