Brazil Soup and Extracts Market (2026-2032) | Value, Companies, Size, Outlook, Analysis, Growth, Industry, Revenue, Trends, Share & Forecast
Market Forecast By Soup Type (Dried, Wet, Canned, UHT), By Sources (Spices, Herbs, Flowers, Tea leaves), By Distribution Channel (Supermarkets & Hypermarkets, Convenience Stores, Online) And Competitive Landscape
| Product Code: ETC030982 | Publication Date: Oct 2020 | Updated Date: Jun 2026 | Product Type: Report | |
| Publisher: 6Wresearch | Author: Ravi Bhandari | No. of Pages: 70 | No. of Figures: 35 | No. of Tables: 5 |
Brazil Soup and Extracts Market Summary
The brazil soup and extracts market was estimated at USD 223 Million in 2025 and is projected to reach USD 269 Million by 2032, growing at a CAGR of 3.1% from 2026 to 2032.
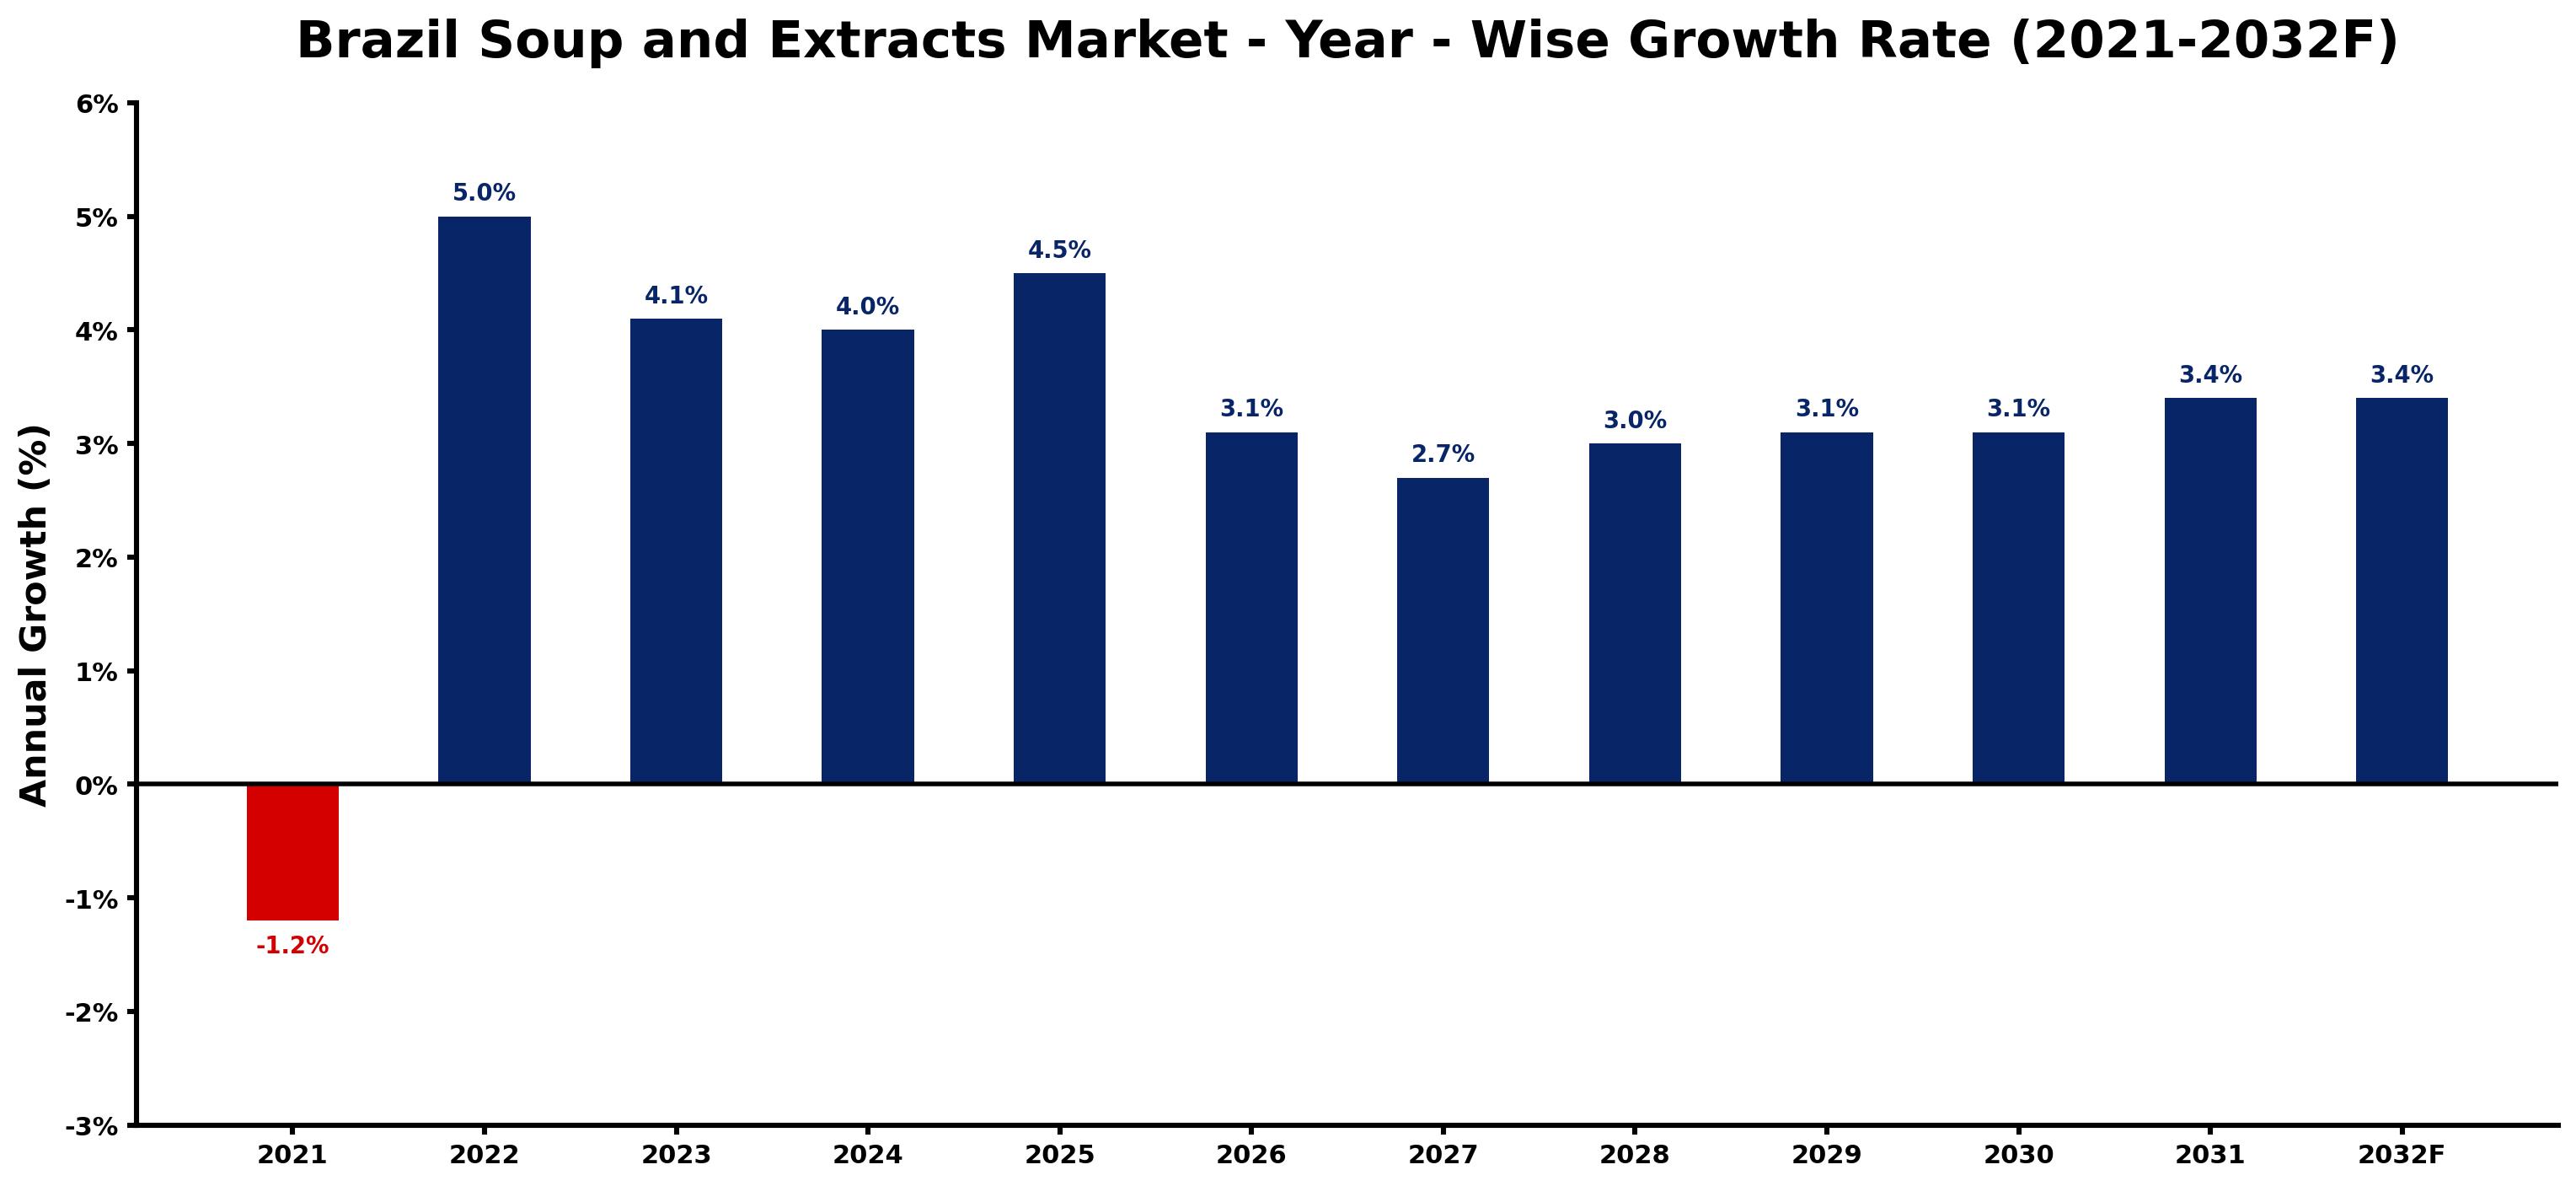
Brazil Soup and Extracts Market Growth Rate Analysis (2021-2032)
The Brazil Soup and Extracts Market has exhibited noteworthy volatility in recent years, starting with a decline of 1.2% in 2021. However, following this downturn, the sector rebounded strongly with growth rates of 5.0% in 2022 and 4.1% in 2023, driven by evolving consumer preferences for convenience and quality. This upward trend is projected to continue, with anticipated growth of 4.0% in 2024 and further improvements through 2025 at 4.5%. Key contributing factors include increased investments in production technology and a focus on sustainable sourcing, which enhance product appeal. Although the growth rate is expected to stabilize at around 3.1% in the following years, robust consumer demand and digital marketing strategies will remain pivotal in sustaining market momentum.
Brazil Soup and Extracts Market Year-wise Growth Rate and Key Drivers
This graph highlights how the Brazil Soup and Extracts Market has steadily grown over the past five years, supported by major growth factors.
The table below presents the year wise growth rates along with the key drivers influencing the market
| Year | Growth Rate | Major Drivers |
| 2021 | -1.2% | Persistently high unemployment rates diminished disposable income, resulting in decreased consumer spending on premium soup products. |
| 2022 | 5.0% | Urban populations turn to ready-to-eat meals, boosting extract sales significantly. |
| 2023 | 4.1% | Health-conscious choices prompt brands to innovate with nutrient-rich soup options. |
| 2024 | 4.0% | E-commerce platforms expand, making soup and extracts more accessible nationwide. |
| 2025 | 4.5% | Local culinary trends influence flavor profiles, attracting diverse consumer demographics. |
| 2026 | 3.1% | Sustainable sourcing practices gain traction, appealing to environmentally conscious buyers. |
| 2027 | 2.7% | Regional partnerships with local farmers enhance the supply chain for soup ingredients. |
| 2028 | 3.0% | Brands embrace cultural authenticity, introducing traditional recipes for wider appeal. |
| 2029 | 3.1% | Innovative packaging solutions provide convenience, attracting busy urban professionals. |
| 2030 | 3.1% | Consumer interest in plant-based diets leads to an increase in plant-based soups. |
| 2031 | 3.4% | Foodservice sectors expand offerings, incorporating soups into diverse dining experiences. |
| 2032 | 3.4% | Emerging health trends emphasize immunity-boosting extracts, driving market diversification. |
Note - Market size estimations and growth projections presented in this report are based on 6Wresearch's advanced forecasting approach, validated with industry datasets as of June 2026.
Brazil Soup and Extracts Market Synopsis
The Brazil Soup and Extracts Market is projected to reach 3.1% and witness significant growth during the forecast period (2026-2032). This market reflects Brazil's diverse culinary landscape and the increasing consumer preference for convenient and healthy meal options. The ongoing shifts in dietary habits, alongside heightened awareness of nutrition, are pivotal drivers of this growth, making the segment an attractive focus for industry stakeholders.
Brazil Soup and Extracts Market Growth Drivers
Several factors are propelling the expansion of the Brazil Soup and Extracts Market. These drivers are essential for understanding the market dynamics and consumer behaviors:
- The rise in urbanization has led to busier lifestyles, prompting consumers to seek convenient meal solutions such as ready-to-eat soups and extracts. This trend is particularly pronounced in metropolitan areas where time constraints are significant.
- Health-conscious consumers are increasingly opting for soups and extracts that boast natural ingredients and nutritional benefits. This shift towards healthier eating is influencing product formulation and marketing strategies.
- Innovation in flavors and packaging remains a crucial driver, as manufacturers expand their offerings to meet evolving tastes. Unique flavor profiles and environmentally friendly packaging are enticing consumers and setting brands apart.
- The growing trend of convenience foods aligns with the demands of modern consumers, who are looking for quick meal solutions that do not compromise on nutrition or taste.
- Sustainability has become a key consideration for many consumers. The market is witnessing a shift towards products that are not only convenient but also environmentally responsible, reflecting a broader trend in food consumption.
Brazil Soup and Extracts Market Challenges and Restraints
While the Brazil Soup and Extracts Market is poised for growth, several challenges must be addressed for sustained development:
- Changing consumer preferences pose a challenge for manufacturers who must quickly adapt their product offerings to align with health and wellness trends, as well as flavor innovations.
- Supply chain disruptions can significantly impact the availability of raw materials necessary for soup and extract production, complicating inventory management and product distribution.
- Regulatory compliance with food safety and labeling standards can create hurdles for manufacturers, necessitating ongoing investment in compliance systems and processes.
- Increased competition from both established and emerging players in the food sector intensifies market pressures, necessitating distinctive marketing and innovation strategies.
- Economic fluctuations, including inflation and changes in consumer spending habits, can affect purchasing behavior, influencing market dynamics and product pricing strategies.
Brazil Soup and Extracts Market Government Investment and Initiatives
Government policies play a vital role in shaping the Brazil Soup and Extracts Market. With food safety regulations and nutritional standards being prioritized, manufacturers must ensure compliance to access this growing market segment. Additionally, initiatives that promote local agriculture can support small-scale producers, thereby enhancing the supply chain for soup and extract production.
Investment in infrastructure to facilitate better distribution channels is another focus area for the Brazilian government, ultimately aiming to improve the efficiency of food logistics. Furthermore, public spending on health campaigns encourages consumers to select more nutritious food options, directly benefiting the soup and extracts sector. These policies collectively influence market dynamics, fostering growth and adaptation in response to consumer demand.
Brazil Soup and Extracts Market Latest Developments (May 2025 - June 2026)
Recent developments in the Brazil Soup and Extracts Market from May 2025 to June 2026 indicate a robust trajectory towards innovation and sustainability. Manufacturers are increasingly incorporating plant-based ingredients in their products to cater to the rising demand for healthy options. Additionally, the trend of premiumization is gaining momentum, with consumers willing to pay more for high-quality, artisanal soup products.
Collaboration between food manufacturers and local farmers has become more prevalent, emphasizing the use of locally sourced ingredients. This not only supports local economies but also enhances the freshness and quality of products offered in the market. As the market landscape evolves, businesses are also exploring digital channels for distribution, adapting to the shifting purchasing behaviors of consumers.
Brazil Soup and Extracts Market - Key Attractiveness of the Report
- 10 Years of Market Numbers
- Historical Data Starting from 2022 to 2025
- Base Year: 2025
- Forecast Data until 2032
- Key Performance Indicators Impacting the Market
- Major Upcoming Developments and Projects
Key Highlights of the Report:
- Brazil Soup and Extracts Market Outlook
- Market Size of Brazil Soup and Extracts Market, 2025
- Forecast of Brazil Soup and Extracts Market, 2032
- Historical Data and Forecast of Brazil Soup and Extracts Revenues & Volume for the Period 2022-2032F
- Brazil Soup and Extracts Market Trend Evolution
- Brazil Soup and Extracts Market Drivers and Challenges
- Brazil Soup and Extracts Price Trends
- Brazil Soup and Extracts Porter's Five Forces
- Brazil Soup and Extracts Industry Life Cycle
- Historical Data and Forecast of Brazil Soup and Extracts Market Revenues & Volume By Soup Type for the Period 2022-2032F
- Historical Data and Forecast of Brazil Soup and Extracts Market Revenues & Volume By Dried for the Period 2022-2032F
- Historical Data and Forecast of Brazil Soup and Extracts Market Revenues & Volume By Wet for the Period 2022-2032F
- Historical Data and Forecast of Brazil Soup and Extracts Market Revenues & Volume By Canned for the Period 2022-2032F
- Historical Data and Forecast of Brazil Soup and Extracts Market Revenues & Volume By UHT for the Period 2022-2032F
- Historical Data and Forecast of Brazil Soup and Extracts Market Revenues & Volume By Sources for the Period 2022-2032F
- Historical Data and Forecast of Brazil Soup and Extracts Market Revenues & Volume By Spices for the Period 2022-2032F
- Historical Data and Forecast of Brazil Soup and Extracts Market Revenues & Volume By Herbs for the Period 2022-2032F
- Historical Data and Forecast of Brazil Soup and Extracts Market Revenues & Volume By Flowers for the Period 2022-2032F
- Historical Data and Forecast of Brazil Soup and Extracts Market Revenues & Volume By Tea leaves for the Period 2022-2032F
- Historical Data and Forecast of Brazil Soup and Extracts Market Revenues & Volume By Distribution Channel for the Period 2022-2032F
- Historical Data and Forecast of Brazil Soup and Extracts Market Revenues & Volume By Supermarkets & Hypermarkets for the Period 2022-2032F
- Historical Data and Forecast of Brazil Soup and Extracts Market Revenues & Volume By Convenience Stores for the Period 2022-2032F
- Historical Data and Forecast of Brazil Soup and Extracts Market Revenues & Volume By Online for the Period 2022-2032F
- Brazil Soup and Extracts Import Export Trade Statistics
- Market Opportunity Assessment By Soup Type
- Market Opportunity Assessment By Sources
- Market Opportunity Assessment By Distribution Channel
- Brazil Soup and Extracts Top Companies Market Share
- Brazil Soup and Extracts Competitive Benchmarking By Technical and Operational Parameters
- Brazil Soup and Extracts Company Profiles
- Brazil Soup and Extracts Key Strategic Recommendations
Frequently Asked Questions About the Market Study (FAQs):
The growth is primarily driven by urbanization, increased demand for convenience foods, health-conscious consumer preferences, and innovation in flavors and packaging.
Key challenges include changing consumer preferences, supply chain disruptions, regulatory compliance, and intense competition from various players.
Government policies on food safety, nutritional standards, and local agriculture promotion significantly influence market dynamics and growth opportunities.
Emerging trends include a shift towards plant-based ingredients, increased premiumization of products, and enhanced collaboration with local farmers.
6Wresearch actively monitors the Brazil Soup and Extracts Market and publishes its comprehensive annual report, highlighting emerging trends, growth drivers, revenue analysis, and forecast outlook. Our insights help businesses to make data-backed strategic decisions with ongoing market dynamics. Our analysts track relevent industries related to the Brazil Soup and Extracts Market, allowing our clients with actionable intelligence and reliable forecasts tailored to emerging regional needs.
Yes, we provide customisation as per your requirements. To learn more, feel free to contact us on sales@6wresearch.com
1 Executive Summary |
2 Introduction |
2.1 Key Highlights of the Report |
2.2 Report Description |
2.3 Market Scope & Segmentation |
2.4 Research Methodology |
2.5 Assumptions |
3 Brazil Soup and Extracts Market Overview |
3.1 Brazil Country Macro Economic Indicators |
3.2 Brazil Soup and Extracts Market Revenues & Volume, 2022 & 2032F |
3.3 Brazil Soup and Extracts Market - Industry Life Cycle |
3.4 Brazil Soup and Extracts Market - Porter's Five Forces |
3.5 Brazil Soup and Extracts Market Revenues & Volume Share, By Soup Type, 2022 & 2032F |
3.6 Brazil Soup and Extracts Market Revenues & Volume Share, By Sources, 2022 & 2032F |
3.7 Brazil Soup and Extracts Market Revenues & Volume Share, By Distribution Channel, 2022 & 2032F |
4 Brazil Soup and Extracts Market Dynamics |
4.1 Impact Analysis |
4.2 Market Drivers |
4.2.1 Increasing consumer awareness about health and wellness benefits of soups and extracts |
4.2.2 Growing demand for convenient and ready-to-eat food products |
4.2.3 Rising disposable income leading to higher spending on premium and organic soup and extracts products |
4.3 Market Restraints |
4.3.1 Fluctuating raw material prices impacting production costs |
4.3.2 Intense competition from other food categories like snacks and ready meals |
4.3.3 Regulatory challenges related to food safety and labeling requirements |
5 Brazil Soup and Extracts Market Trends |
6 Brazil Soup and Extracts Market, By Types |
6.1 Brazil Soup and Extracts Market, By Soup Type |
6.1.1 Overview and Analysis |
6.1.2 Brazil Soup and Extracts Market Revenues & Volume, By Soup Type, 2022-2032F |
6.1.3 Brazil Soup and Extracts Market Revenues & Volume, By Dried, 2022-2032F |
6.1.4 Brazil Soup and Extracts Market Revenues & Volume, By Wet, 2022-2032F |
6.1.5 Brazil Soup and Extracts Market Revenues & Volume, By Canned, 2022-2032F |
6.1.6 Brazil Soup and Extracts Market Revenues & Volume, By UHT, 2022-2032F |
6.2 Brazil Soup and Extracts Market, By Sources |
6.2.1 Overview and Analysis |
6.2.2 Brazil Soup and Extracts Market Revenues & Volume, By Spices, 2022-2032F |
6.2.3 Brazil Soup and Extracts Market Revenues & Volume, By Herbs, 2022-2032F |
6.2.4 Brazil Soup and Extracts Market Revenues & Volume, By Flowers, 2022-2032F |
6.2.5 Brazil Soup and Extracts Market Revenues & Volume, By Tea leaves, 2022-2032F |
6.3 Brazil Soup and Extracts Market, By Distribution Channel |
6.3.1 Overview and Analysis |
6.3.2 Brazil Soup and Extracts Market Revenues & Volume, By Supermarkets & Hypermarkets, 2022-2032F |
6.3.3 Brazil Soup and Extracts Market Revenues & Volume, By Convenience Stores, 2022-2032F |
6.3.4 Brazil Soup and Extracts Market Revenues & Volume, By Online, 2022-2032F |
7 Brazil Soup and Extracts Market Import-Export Trade Statistics |
7.1 Brazil Soup and Extracts Market Export to Major Countries |
7.2 Brazil Soup and Extracts Market Imports from Major Countries |
8 Brazil Soup and Extracts Market Key Performance Indicators |
8.1 Consumer engagement with new product launches and promotions |
8.2 Number of distribution channels expanded to reach wider consumer base |
8.3 Percentage of repeat purchases indicating product loyalty and satisfaction |
9 Brazil Soup and Extracts Market - Opportunity Assessment |
9.1 Brazil Soup and Extracts Market Opportunity Assessment, By Soup Type, 2022 & 2032F |
9.2 Brazil Soup and Extracts Market Opportunity Assessment, By Sources, 2022 & 2032F |
9.3 Brazil Soup and Extracts Market Opportunity Assessment, By Distribution Channel, 2022 & 2032F |
10 Brazil Soup and Extracts Market - Competitive Landscape |
10.1 Brazil Soup and Extracts Market Revenue Share, By Companies, 2025 |
10.2 Brazil Soup and Extracts Market Competitive Benchmarking, By Operating and Technical Parameters |
11 Company Profiles |
12 Recommendations |
13 Disclaimer |
Global Go To Market Strategy - 2030
Export potential enables firms to identify high-growth global markets with greater confidence by combining advanced trade intelligence with a structured quantitative methodology. The framework analyzes emerging demand trends and country-level import patterns while integrating macroeconomic and trade datasets such as GDP and population forecasts, bilateral import–export flows, tariff structures, elasticity differentials between developed and developing economies, geographic distance, and import demand projections. Using weighted trade values from 2020–2024 as the base period to project country-to-country export potential for 2030, these inputs are operationalized through calculated drivers such as gravity model parameters, tariff impact factors, and projected GDP per-capita growth. Through an analysis of hidden potentials, demand hotspots, and market conditions that are most favorable to success, this method enables firms to focus on target countries, maximize returns, and global expansion with data, backed by accuracy.
By factoring in the projected importer demand gap that is currently unmet and could be potential opportunity, it identifies the potential for the Exporter (Country) among 190 countries, against the general trade analysis, which identifies the biggest importer or exporter.
To discover high-growth global markets and optimize your business strategy:
Click Here
Pricing
- Single User License$ 1,995
- Department License$ 2,400
- Site License$ 3,120
- Global License$ 3,795

Leadership Perspectives from Industry Events
Search
Thought Leadership and Analyst Meet


Our Clients
6WResearch In News
- India Air Conditioner Market Set for Strong Rebound in 2026 After Weather-Led Correction and GST-Driven Recovery: 6Wresearch
- ADAS in India: How Automatic Emergency Braking, Blind Spot Detection & Driver Monitoring are Transforming Road Safety
- Doha a strategic location for EV manufacturing hub: IPA Qatar
- Demand for luxury TVs surging in the GCC, says Samsung
- Empowering Growth: The Thriving Journey of Bangladesh’s Cable Industry
- Demand for luxury TVs surging in the GCC, says Samsung
Latest Reports
- Nicaragua RPG Gaming Market (2026-2032)
- New Zealand RPG Gaming Market (2026-2032)
- Netherlands RPG Gaming Market (2026-2032)
- Nauru RPG Gaming Market (2026-2032)
- Namibia RPG Gaming Market (2026-2032)
- Mozambique RPG Gaming Market (2026-2032)
- Montenegro RPG Gaming Market (2026-2032)
- Mongolia RPG Gaming Market (2026-2032)
- Monaco RPG Gaming Market (2026-2032)
- Micronesia RPG Gaming Market (2026-2032)
Industry Events and Analyst Meet

HIMTEX 2026

India Refining Summit 2026

India EV Show 2026

EV tech India Expo 2026

Auto Tech Asia 2026
Whitepaper
- Middle East & Africa Commercial Security Market Click here to view more.
- Middle East & Africa Fire Safety Systems & Equipment Market Click here to view more.
- GCC Drone Market Click here to view more.
- Middle East Lighting Fixture Market Click here to view more.
- GCC Physical & Perimeter Security Market Click here to view more.