United States (US) Soup and Extracts Market (2026-2032) | Industry, Forecast, Outlook, Trends, Growth, Companies, Size, Share, Value, Analysis & Revenue
Market Forecast By Soup Type (Dried, Wet, Canned, UHT), By Sources (Spices, Herbs, Flowers, Tea leaves), By Distribution Channel (Supermarkets & Hypermarkets, Convenience Stores, Online) And Competitive Landscape
| Product Code: ETC030981 | Publication Date: Oct 2020 | Updated Date: Mar 2026 | Product Type: Report | |
| Publisher: 6Wresearch | Author: Ravi Bhandari | No. of Pages: 70 | No. of Figures: 35 | No. of Tables: 5 |
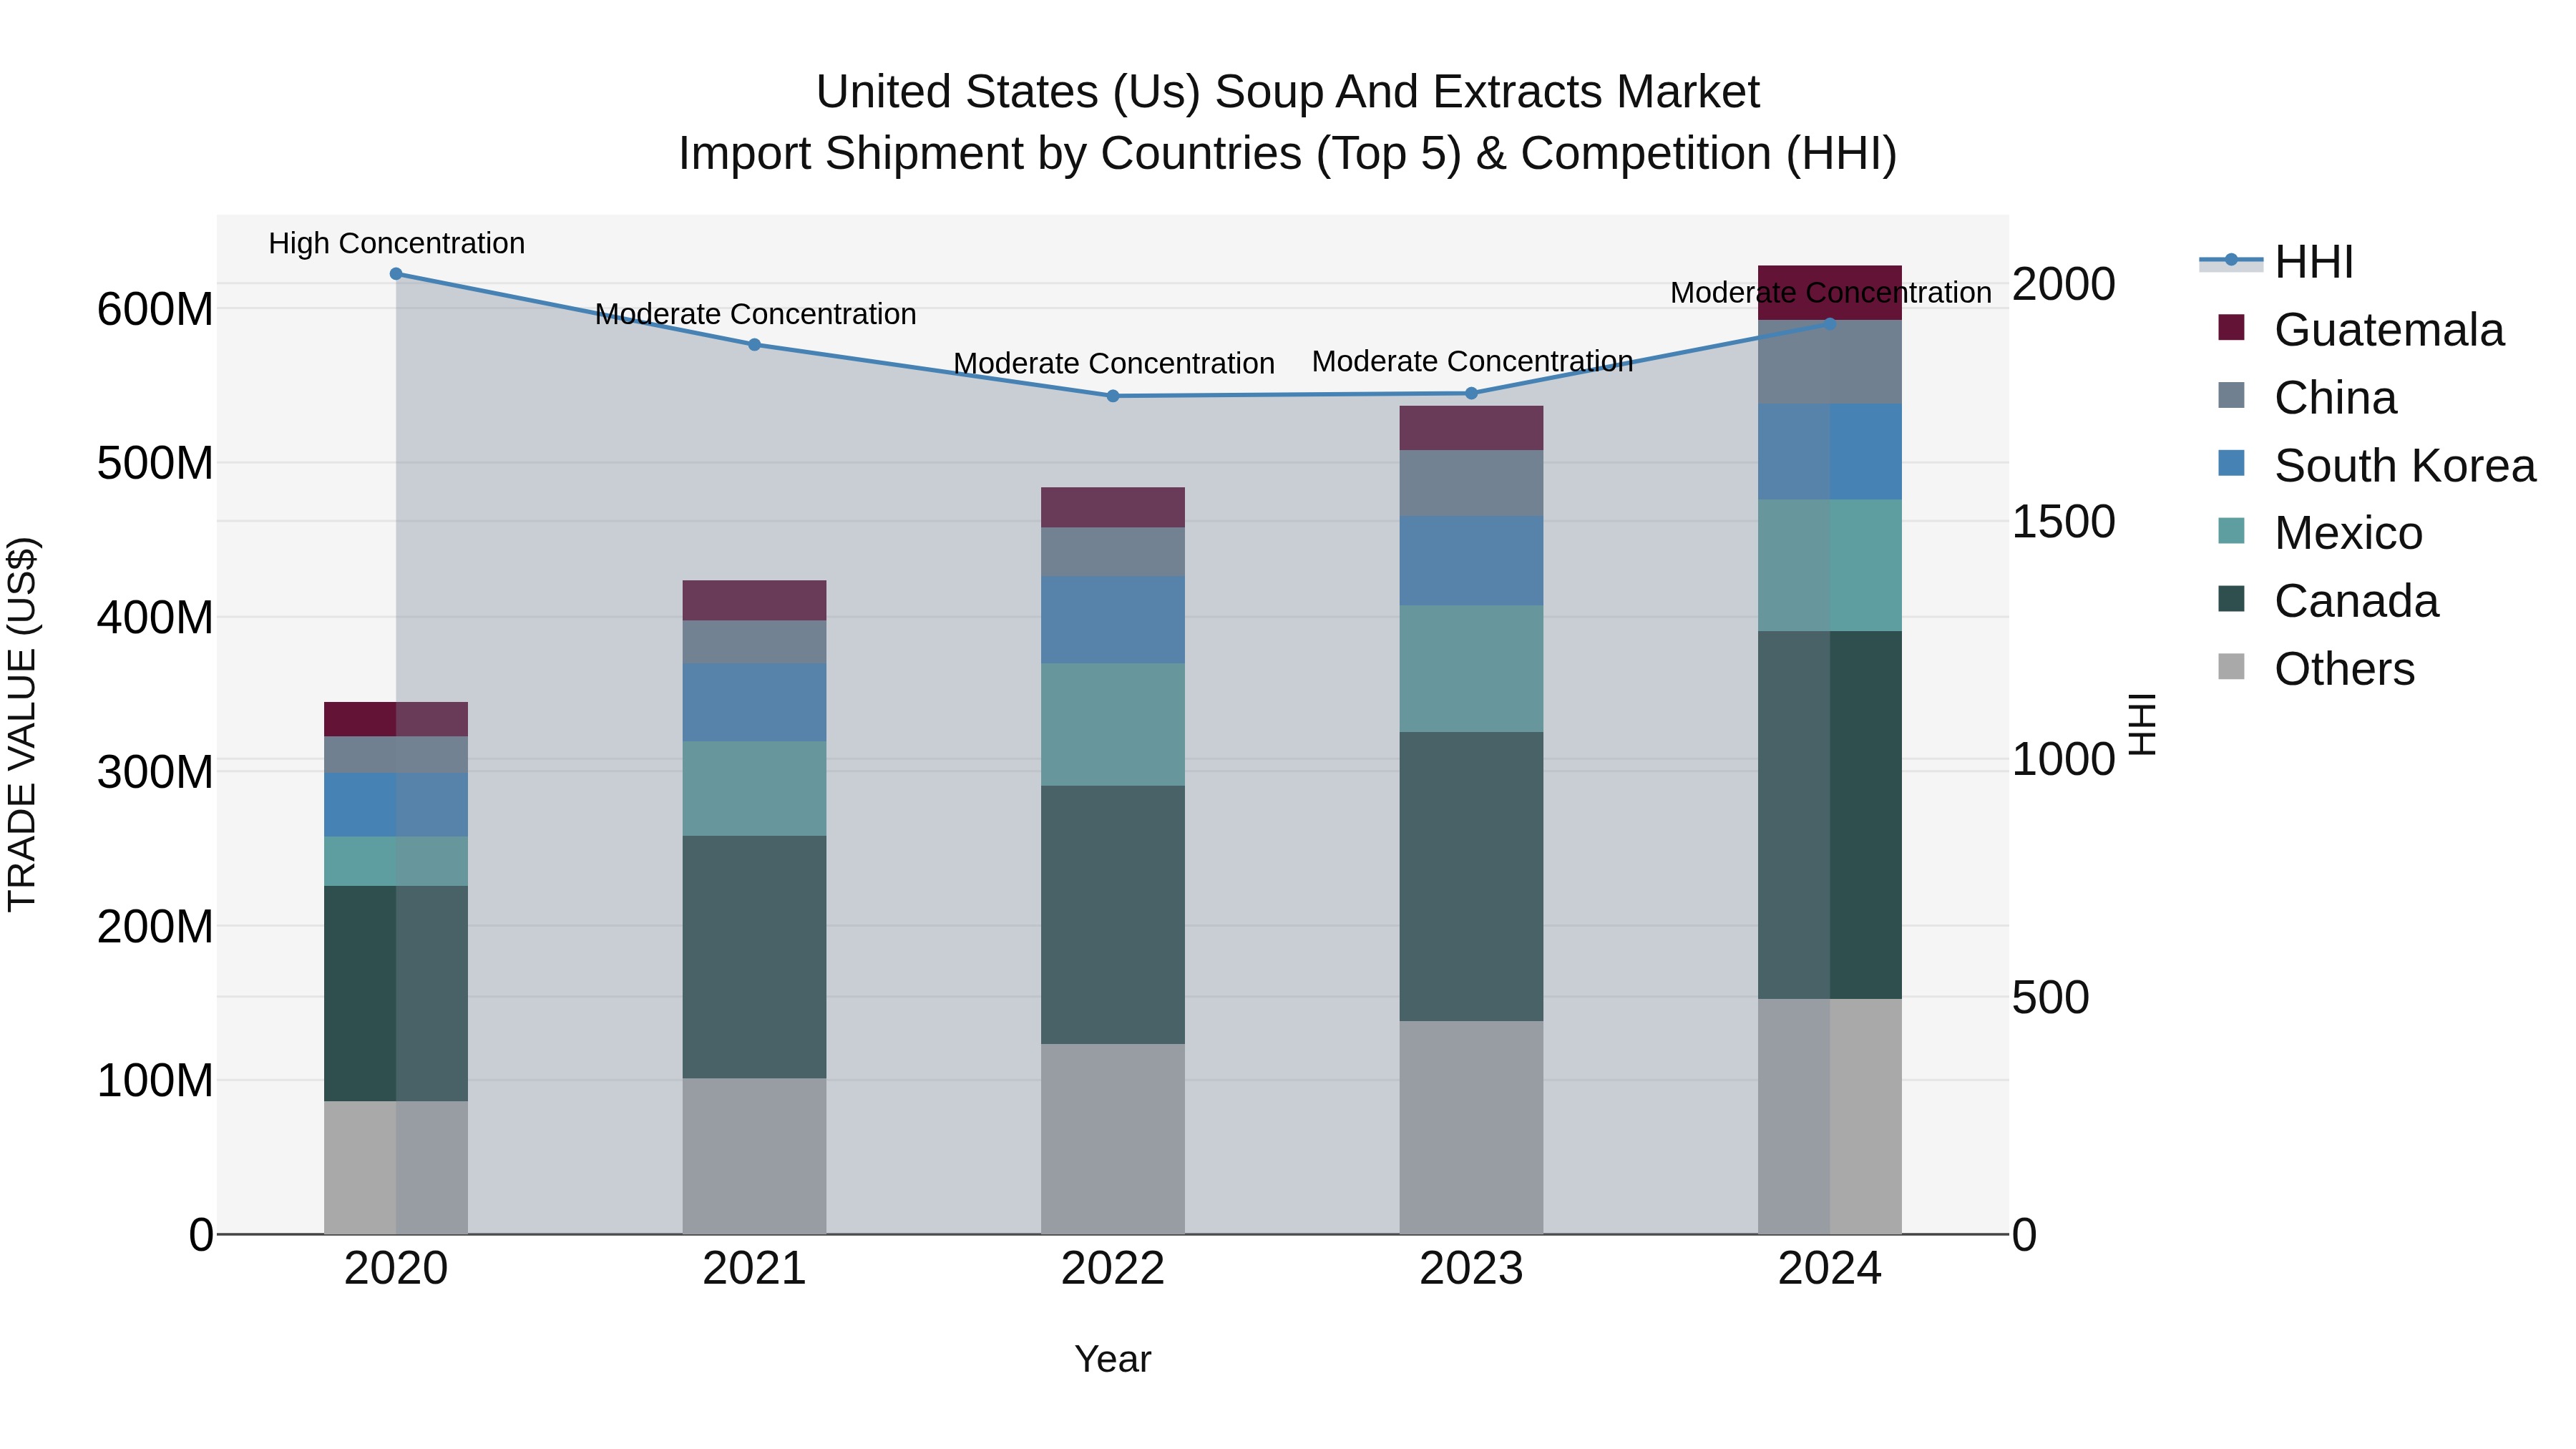
United States (US) Soup and Extracts Market Top 5 Importing Countries and Market Competition (HHI) Analysis
The United States continues to see a steady increase in soup and extracts import shipments, with key suppliers including Canada, Mexico, South Korea, China, and Vietnam. The market shows moderate concentration in 2024, reflecting a healthy level of competition among exporters. The compound annual growth rate (CAGR) from 2020 to 2024 stands at an impressive 16.12%, indicating a strong and consistent upward trend. Furthermore, the growth rate from 2023 to 2024 is even higher at 16.88%, suggesting a flourishing market for soup and extracts imports in the USA.
Key Highlights of the Report:
- United States (US) Soup and Extracts Market Outlook
- Market Size of United States (US) Soup and Extracts Market, 2025
- Forecast of United States (US) Soup and Extracts Market, 2032
- Historical Data and Forecast of United States (US) Soup and Extracts Revenues & Volume for the Period 2022 - 2032F
- United States (US) Soup and Extracts Market Trend Evolution
- United States (US) Soup and Extracts Market Drivers and Challenges
- United States (US) Soup and Extracts Price Trends
- United States (US) Soup and Extracts Porter's Five Forces
- United States (US) Soup and Extracts Industry Life Cycle
- Historical Data and Forecast of United States (US) Soup and Extracts Market Revenues & Volume By Soup Type for the Period 2022 - 2032F
- Historical Data and Forecast of United States (US) Soup and Extracts Market Revenues & Volume By Dried for the Period 2022 - 2032F
- Historical Data and Forecast of United States (US) Soup and Extracts Market Revenues & Volume By Wet for the Period 2022 - 2032F
- Historical Data and Forecast of United States (US) Soup and Extracts Market Revenues & Volume By Canned for the Period 2022 - 2032F
- Historical Data and Forecast of United States (US) Soup and Extracts Market Revenues & Volume By UHT for the Period 2022 - 2032F
- Historical Data and Forecast of United States (US) Soup and Extracts Market Revenues & Volume By Sources for the Period 2022 - 2032F
- Historical Data and Forecast of United States (US) Soup and Extracts Market Revenues & Volume By Spices for the Period 2022 - 2032F
- Historical Data and Forecast of United States (US) Soup and Extracts Market Revenues & Volume By Herbs for the Period 2022 - 2032F
- Historical Data and Forecast of United States (US) Soup and Extracts Market Revenues & Volume By Flowers for the Period 2022 - 2032F
- Historical Data and Forecast of United States (US) Soup and Extracts Market Revenues & Volume By Tea leaves for the Period 2022 - 2032F
- Historical Data and Forecast of United States (US) Soup and Extracts Market Revenues & Volume By Distribution Channel for the Period 2022 - 2032F
- Historical Data and Forecast of United States (US) Soup and Extracts Market Revenues & Volume By Supermarkets & Hypermarkets for the Period 2022 - 2032F
- Historical Data and Forecast of United States (US) Soup and Extracts Market Revenues & Volume By Convenience Stores for the Period 2022 - 2032F
- Historical Data and Forecast of United States (US) Soup and Extracts Market Revenues & Volume By Online for the Period 2022 - 2032F
- United States (US) Soup and Extracts Import Export Trade Statistics
- Market Opportunity Assessment By Soup Type
- Market Opportunity Assessment By Sources
- Market Opportunity Assessment By Distribution Channel
- United States (US) Soup and Extracts Top Companies Market Share
- United States (US) Soup and Extracts Competitive Benchmarking By Technical and Operational Parameters
- United States (US) Soup and Extracts Company Profiles
- United States (US) Soup and Extracts Key Strategic Recommendations
Frequently Asked Questions About the Market Study (FAQs):
6Wresearch actively monitors the United States (US) Soup and Extracts Market and publishes its comprehensive annual report, highlighting emerging trends, growth drivers, revenue analysis, and forecast outlook. Our insights help businesses to make data-backed strategic decisions with ongoing market dynamics. Our analysts track relevent industries related to the United States (US) Soup and Extracts Market, allowing our clients with actionable intelligence and reliable forecasts tailored to emerging regional needs.
Yes, we provide customisation as per your requirements. To learn more, feel free to contact us on sales@6wresearch.com
1 Executive Summary |
2 Introduction |
2.1 Key Highlights of the Report |
2.2 Report Description |
2.3 Market Scope & Segmentation |
2.4 Research Methodology |
2.5 Assumptions |
3 United States (US) Soup and Extracts Market Overview |
3.1 United States (US) Country Macro Economic Indicators |
3.2 United States (US) Soup and Extracts Market Revenues & Volume, 2022 & 2032F |
3.3 United States (US) Soup and Extracts Market - Industry Life Cycle |
3.4 United States (US) Soup and Extracts Market - Porter's Five Forces |
3.5 United States (US) Soup and Extracts Market Revenues & Volume Share, By Soup Type, 2022 & 2032F |
3.6 United States (US) Soup and Extracts Market Revenues & Volume Share, By Sources, 2022 & 2032F |
3.7 United States (US) Soup and Extracts Market Revenues & Volume Share, By Distribution Channel, 2022 & 2032F |
4 United States (US) Soup and Extracts Market Dynamics |
4.1 Impact Analysis |
4.2 Market Drivers |
4.2.1 Increasing consumer awareness towards health and wellness leading to a demand for healthier soup and extracts options. |
4.2.2 Busy lifestyles and the need for convenient meal solutions driving the demand for ready-to-eat soups and extracts. |
4.2.3 Growing interest in ethnic flavors and cuisines influencing the variety and innovation in soup and extracts offerings. |
4.3 Market Restraints |
4.3.1 Fluctuating raw material prices impacting the production costs and pricing of soup and extracts. |
4.3.2 Intense competition among market players leading to price wars and reduced profit margins. |
4.3.3 Changing consumer preferences towards fresh and natural foods affecting the demand for packaged soup and extracts. |
5 United States (US) Soup and Extracts Market Trends |
6 United States (US) Soup and Extracts Market, By Types |
6.1 United States (US) Soup and Extracts Market, By Soup Type |
6.1.1 Overview and Analysis |
6.1.2 United States (US) Soup and Extracts Market Revenues & Volume, By Soup Type, 2022 - 2032F |
6.1.3 United States (US) Soup and Extracts Market Revenues & Volume, By Dried, 2022 - 2032F |
6.1.4 United States (US) Soup and Extracts Market Revenues & Volume, By Wet, 2022 - 2032F |
6.1.5 United States (US) Soup and Extracts Market Revenues & Volume, By Canned, 2022 - 2032F |
6.1.6 United States (US) Soup and Extracts Market Revenues & Volume, By UHT, 2022 - 2032F |
6.2 United States (US) Soup and Extracts Market, By Sources |
6.2.1 Overview and Analysis |
6.2.2 United States (US) Soup and Extracts Market Revenues & Volume, By Spices, 2022 - 2032F |
6.2.3 United States (US) Soup and Extracts Market Revenues & Volume, By Herbs, 2022 - 2032F |
6.2.4 United States (US) Soup and Extracts Market Revenues & Volume, By Flowers, 2022 - 2032F |
6.2.5 United States (US) Soup and Extracts Market Revenues & Volume, By Tea leaves, 2022 - 2032F |
6.3 United States (US) Soup and Extracts Market, By Distribution Channel |
6.3.1 Overview and Analysis |
6.3.2 United States (US) Soup and Extracts Market Revenues & Volume, By Supermarkets & Hypermarkets, 2022 - 2032F |
6.3.3 United States (US) Soup and Extracts Market Revenues & Volume, By Convenience Stores, 2022 - 2032F |
6.3.4 United States (US) Soup and Extracts Market Revenues & Volume, By Online, 2022 - 2032F |
7 United States (US) Soup and Extracts Market Import-Export Trade Statistics |
7.1 United States (US) Soup and Extracts Market Export to Major Countries |
7.2 United States (US) Soup and Extracts Market Imports from Major Countries |
8 United States (US) Soup and Extracts Market Key Performance Indicators |
8.1 Consumer engagement metrics such as website traffic, social media interactions, and online reviews indicating the market's acceptance of new soup and extracts products. |
8.2 Innovation rate measured by the number of new product launches, flavors, or packaging formats introduced in the market. |
8.3 Sustainability metrics like packaging recyclability, carbon footprint reduction, and ingredient sourcing transparency showcasing the market's commitment to environmental responsibility. |
9 United States (US) Soup and Extracts Market - Opportunity Assessment |
9.1 United States (US) Soup and Extracts Market Opportunity Assessment, By Soup Type, 2022 & 2032F |
9.2 United States (US) Soup and Extracts Market Opportunity Assessment, By Sources, 2022 & 2032F |
9.3 United States (US) Soup and Extracts Market Opportunity Assessment, By Distribution Channel, 2022 & 2032F |
10 United States (US) Soup and Extracts Market - Competitive Landscape |
10.1 United States (US) Soup and Extracts Market Revenue Share, By Companies, 2025 |
10.2 United States (US) Soup and Extracts Market Competitive Benchmarking, By Operating and Technical Parameters |
11 Company Profiles |
12 Recommendations |
13 Disclaimer |
Global Go To Market Strategy - 2030
Export potential enables firms to identify high-growth global markets with greater confidence by combining advanced trade intelligence with a structured quantitative methodology. The framework analyzes emerging demand trends and country-level import patterns while integrating macroeconomic and trade datasets such as GDP and population forecasts, bilateral import–export flows, tariff structures, elasticity differentials between developed and developing economies, geographic distance, and import demand projections. Using weighted trade values from 2020–2024 as the base period to project country-to-country export potential for 2030, these inputs are operationalized through calculated drivers such as gravity model parameters, tariff impact factors, and projected GDP per-capita growth. Through an analysis of hidden potentials, demand hotspots, and market conditions that are most favorable to success, this method enables firms to focus on target countries, maximize returns, and global expansion with data, backed by accuracy.
By factoring in the projected importer demand gap that is currently unmet and could be potential opportunity, it identifies the potential for the Exporter (Country) among 190 countries, against the general trade analysis, which identifies the biggest importer or exporter.
To discover high-growth global markets and optimize your business strategy:
Click Here
Pricing
- Single User License$ 1,995
- Department License$ 2,400
- Site License$ 3,120
- Global License$ 3,795

Leadership Perspectives from Industry Events
Search
Thought Leadership and Analyst Meet


Our Clients
6WResearch In News
- India Air Conditioner Market Set for Strong Rebound in 2026 After Weather-Led Correction and GST-Driven Recovery: 6Wresearch
- ADAS in India: How Automatic Emergency Braking, Blind Spot Detection & Driver Monitoring are Transforming Road Safety
- Doha a strategic location for EV manufacturing hub: IPA Qatar
- Demand for luxury TVs surging in the GCC, says Samsung
- Empowering Growth: The Thriving Journey of Bangladesh’s Cable Industry
- Demand for luxury TVs surging in the GCC, says Samsung
Latest Reports
- Nicaragua RPG Gaming Market (2026-2032)
- New Zealand RPG Gaming Market (2026-2032)
- Netherlands RPG Gaming Market (2026-2032)
- Nauru RPG Gaming Market (2026-2032)
- Namibia RPG Gaming Market (2026-2032)
- Mozambique RPG Gaming Market (2026-2032)
- Montenegro RPG Gaming Market (2026-2032)
- Mongolia RPG Gaming Market (2026-2032)
- Monaco RPG Gaming Market (2026-2032)
- Micronesia RPG Gaming Market (2026-2032)
Industry Events and Analyst Meet

EV India Expo 2026

HIMTEX 2026

India Refining Summit 2026

India EV Show 2026

EV tech India Expo 2026
Whitepaper
- Middle East & Africa Commercial Security Market Click here to view more.
- Middle East & Africa Fire Safety Systems & Equipment Market Click here to view more.
- GCC Drone Market Click here to view more.
- Middle East Lighting Fixture Market Click here to view more.
- GCC Physical & Perimeter Security Market Click here to view more.