Bulgaria Technical Ceramics Market (2026-2032) | Size, Trends, Analysis, Value, Growth, Revenue, Outlook, Forecast, Companies, Industry, Segmentation & Share
Market Forecast By Material Type (Oxide ceramics, Non-oxide ceramics), By Product Type (Monolithic ceramics, Ceramic matrix composites, Ceramic coatings, Others), By End-Use Industry (Electronics & semiconductor, Automotive, Energy & power, Industrial, Medical, Military & defense, Others) And Competitive Landscape
| Product Code: ETC5526940 | Publication Date: Nov 2023 | Updated Date: Apr 2026 | Product Type: Market Research Report | |
| Publisher: 6Wresearch | Author: Ravi Bhandari | No. of Pages: 60 | No. of Figures: 30 | No. of Tables: 5 |
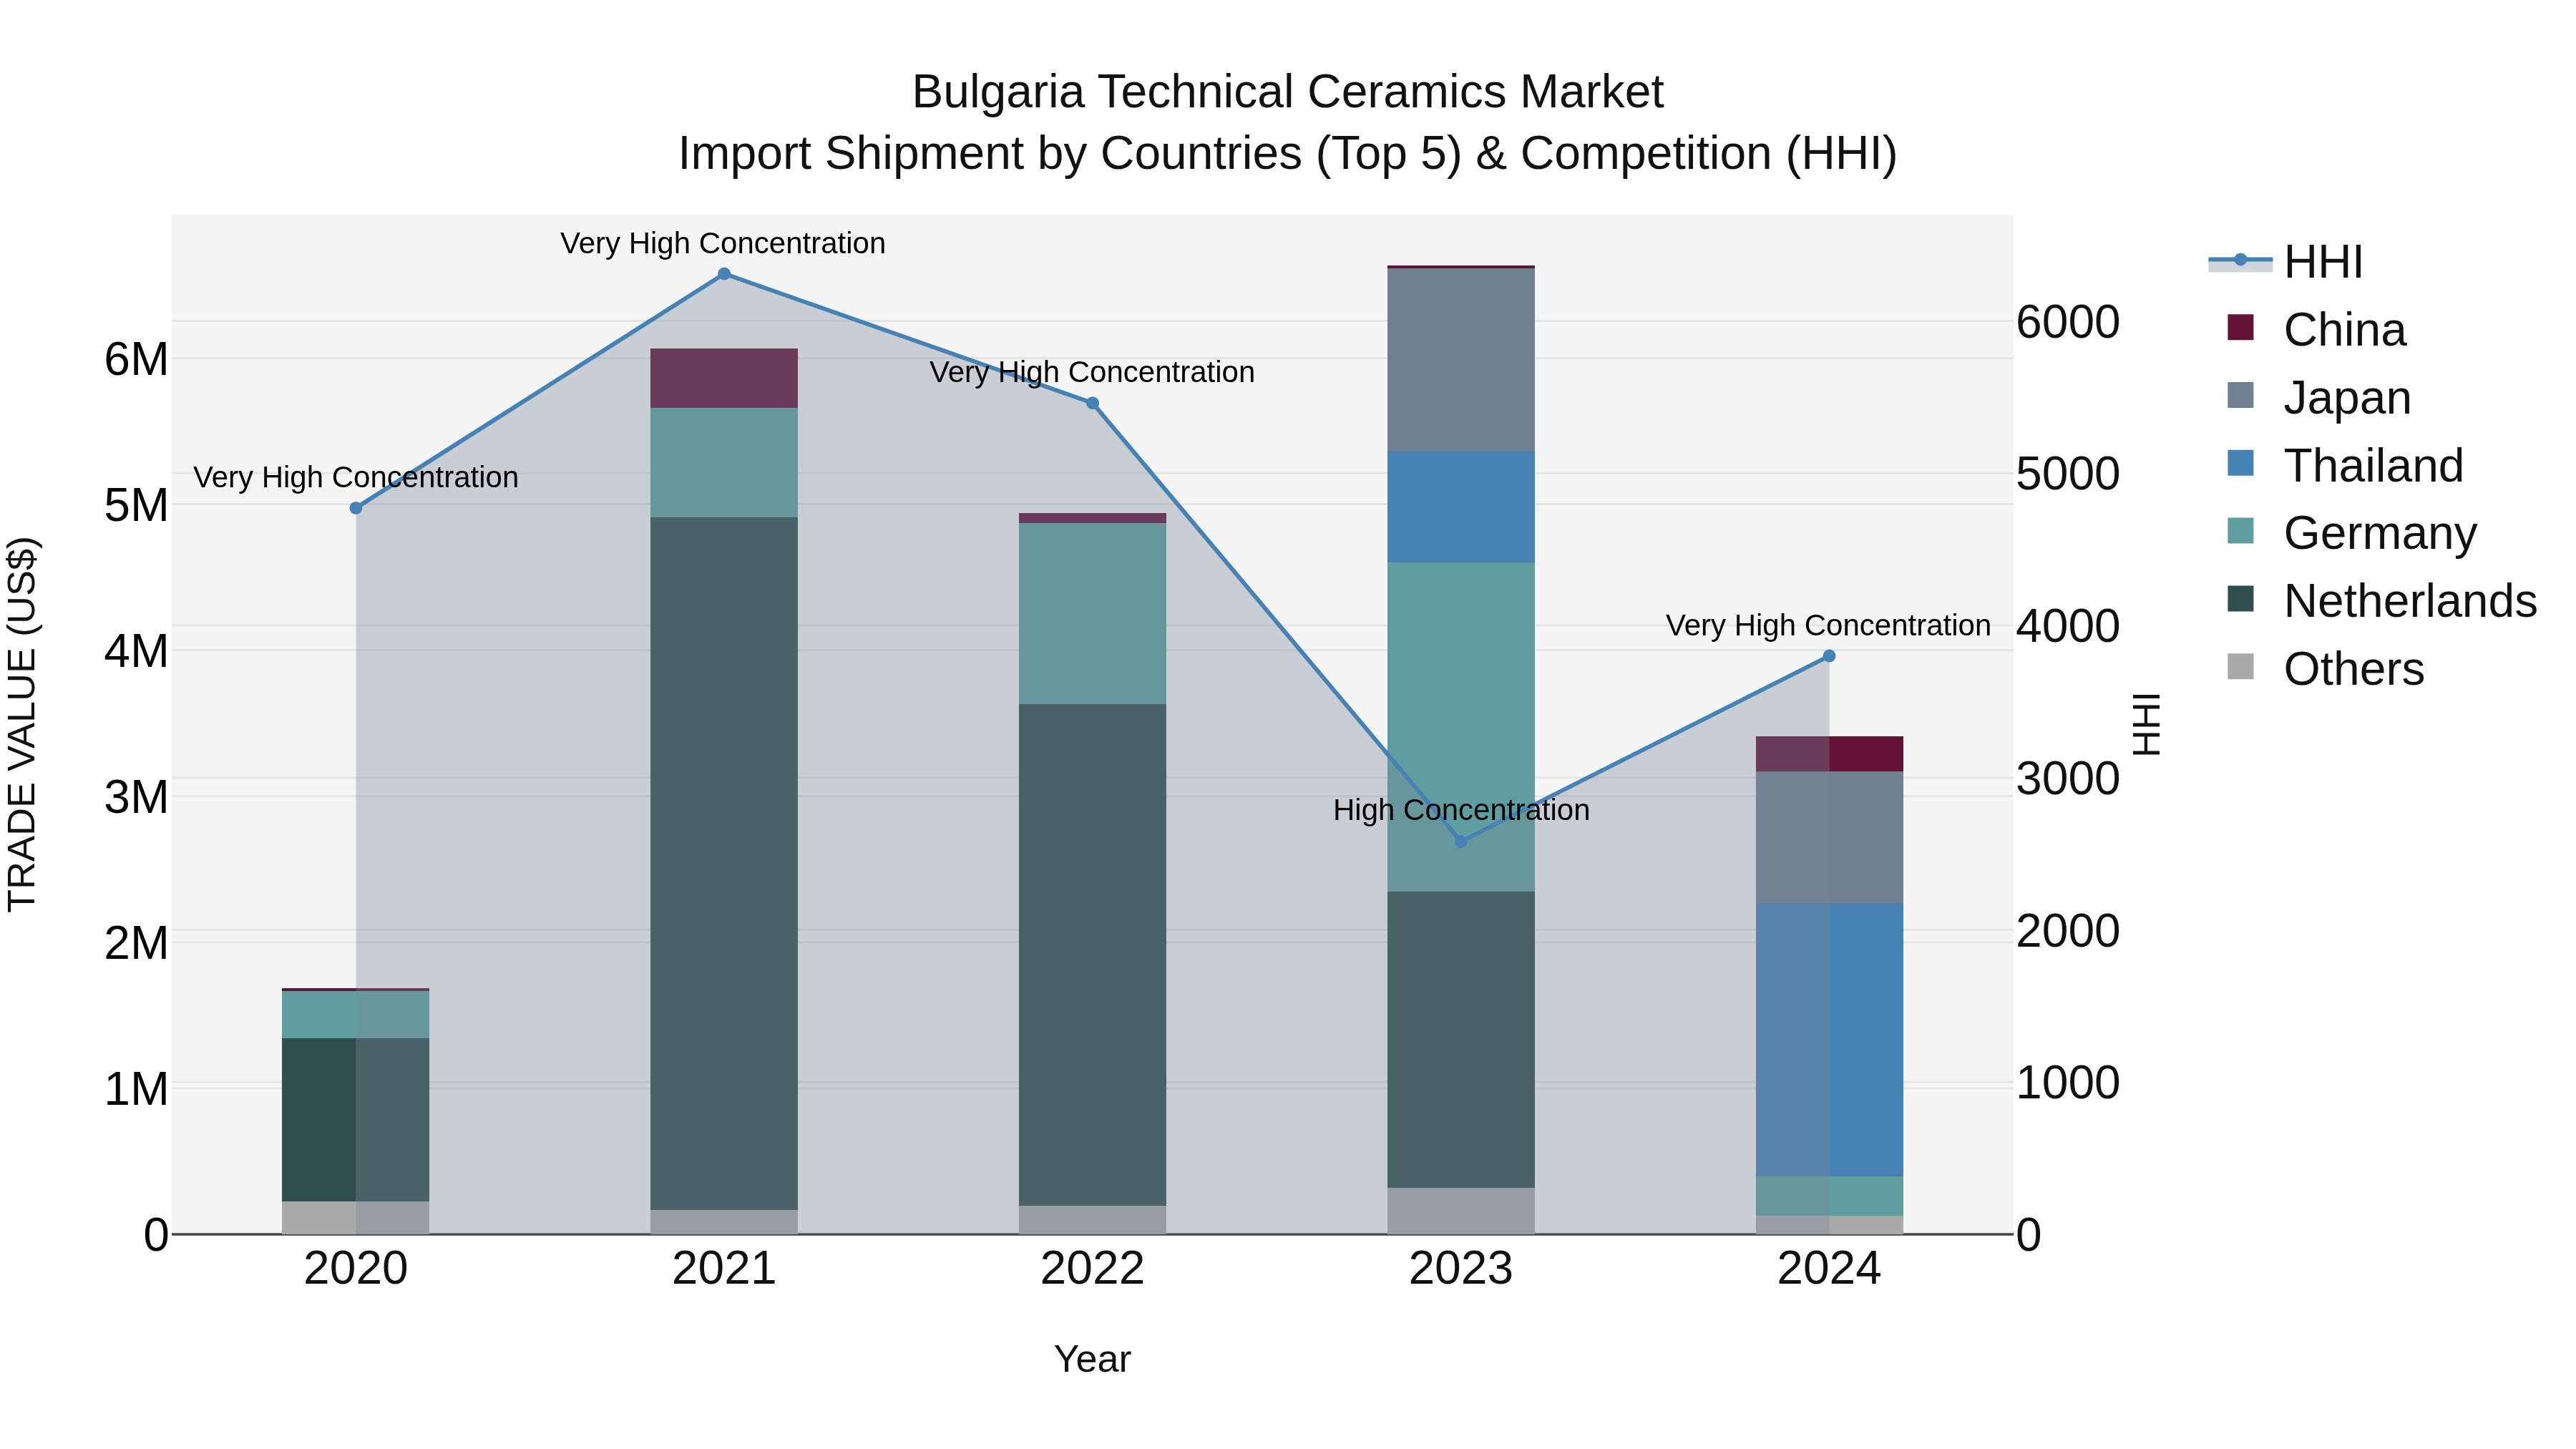
Bulgaria Technical Ceramics Market Top 5 Importing Countries and Market Competition (HHI) Analysis
Bulgaria`s technical ceramics import Market Top 5 Importing Countries and Market Competition (HHI) Analysis saw a significant increase in concentration in 2024, with Thailand, Japan, Germany, China, and the USA dominating the shipments. Despite a steep decline in growth rate from 2023 to 2024, the compound annual growth rate for 2020-2024 remained robust at 19.29%. This data suggests a competitive landscape with a few major players controlling a large portion of the Market Top 5 Importing Countries and Market Competition (HHI) Analysis , indicating potential challenges for smaller exporters looking to enter the Bulgarian Market Top 5 Importing Countries and Market Competition (HHI) Analysis for technical ceramics.
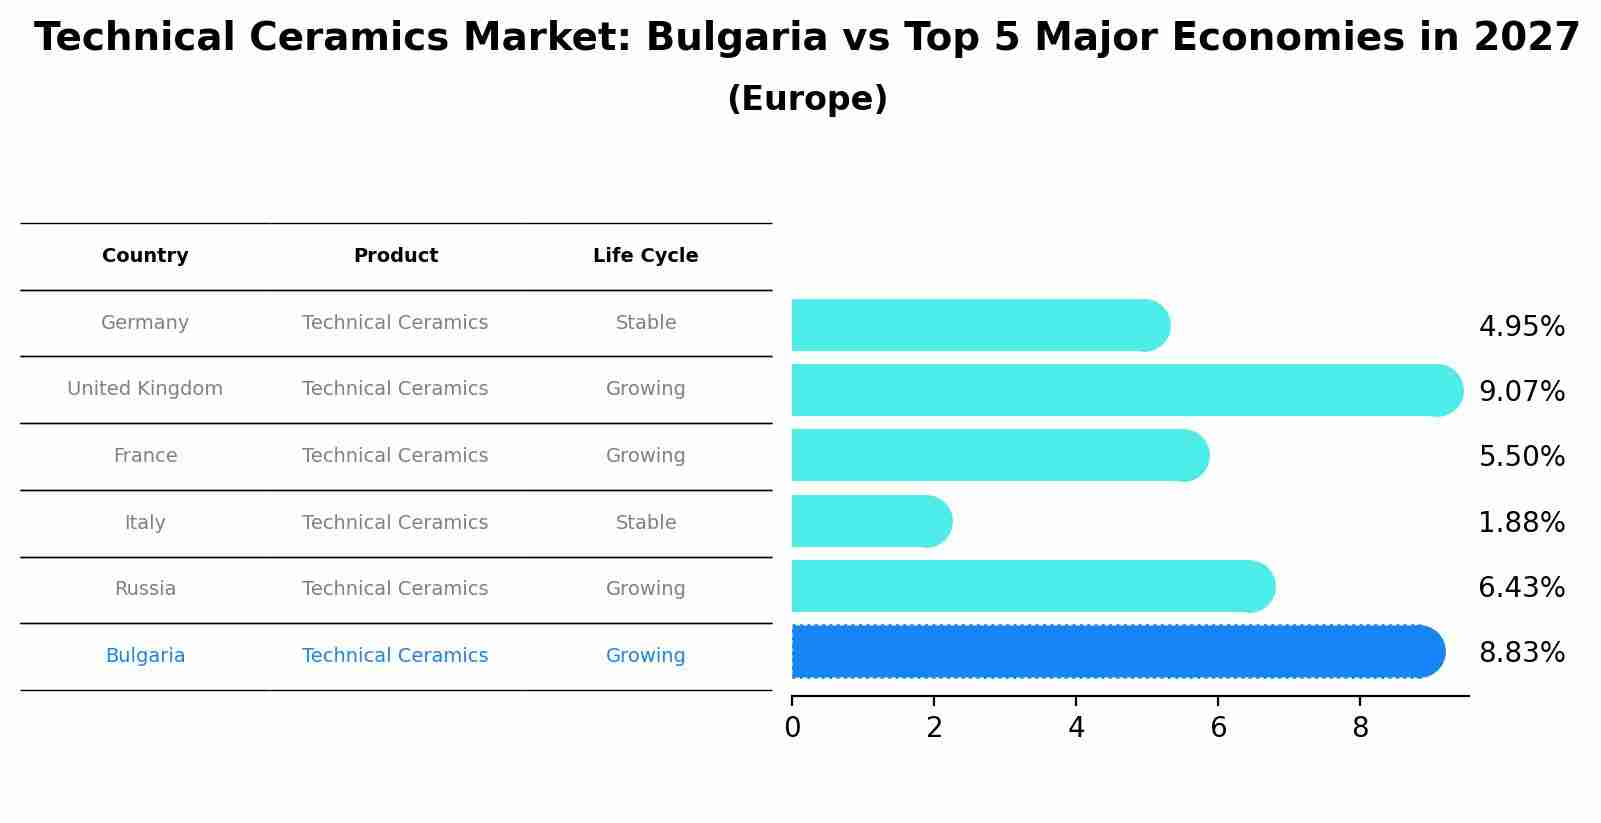
Technical Ceramics Market: Bulgaria vs Top 5 Major Economies in 2027 (Europe)
By 2027, the Technical Ceramics market in Bulgaria is anticipated to reach a growth rate of 8.83%, as part of an increasingly competitive Europe region, where Germany remains at the forefront, supported by United Kingdom, France, Italy and Russia, driving innovations and market adoption across sectors.
Key Highlights of the Report:
- Bulgaria Technical Ceramics Market Outlook
- Market Size of Bulgaria Technical Ceramics Market, 2025
- Forecast of Bulgaria Technical Ceramics Market, 2032
- Historical Data and Forecast of Bulgaria Technical Ceramics Revenues & Volume for the Period 2022 - 2032F
- Bulgaria Technical Ceramics Market Trend Evolution
- Bulgaria Technical Ceramics Market Drivers and Challenges
- Bulgaria Technical Ceramics Price Trends
- Bulgaria Technical Ceramics Porter`s Five Forces
- Bulgaria Technical Ceramics Industry Life Cycle
- Historical Data and Forecast of Bulgaria Technical Ceramics Market Revenues & Volume By Material Type for the Period 2022 - 2032F
- Historical Data and Forecast of Bulgaria Technical Ceramics Market Revenues & Volume By Oxide ceramics for the Period 2022 - 2032F
- Historical Data and Forecast of Bulgaria Technical Ceramics Market Revenues & Volume By Non-oxide ceramics for the Period 2022 - 2032F
- Historical Data and Forecast of Bulgaria Technical Ceramics Market Revenues & Volume By Product Type for the Period 2022 - 2032F
- Historical Data and Forecast of Bulgaria Technical Ceramics Market Revenues & Volume By Monolithic ceramics for the Period 2022 - 2032F
- Historical Data and Forecast of Bulgaria Technical Ceramics Market Revenues & Volume By Ceramic matrix composites for the Period 2022 - 2032F
- Historical Data and Forecast of Bulgaria Technical Ceramics Market Revenues & Volume By Ceramic coatings for the Period 2022 - 2032F
- Historical Data and Forecast of Bulgaria Technical Ceramics Market Revenues & Volume By Others for the Period 2022 - 2032F
- Historical Data and Forecast of Bulgaria Technical Ceramics Market Revenues & Volume By End-Use Industry for the Period 2022 - 2032F
- Historical Data and Forecast of Bulgaria Technical Ceramics Market Revenues & Volume By Electronics & semiconductor for the Period 2022 - 2032F
- Historical Data and Forecast of Bulgaria Technical Ceramics Market Revenues & Volume By Automotive for the Period 2022 - 2032F
- Historical Data and Forecast of Bulgaria Technical Ceramics Market Revenues & Volume By Energy & power for the Period 2022 - 2032F
- Historical Data and Forecast of Bulgaria Technical Ceramics Market Revenues & Volume By Industrial for the Period 2022 - 2032F
- Historical Data and Forecast of Bulgaria Technical Ceramics Market Revenues & Volume By Medical for the Period 2022 - 2032F
- Historical Data and Forecast of Bulgaria Technical Ceramics Market Revenues & Volume By Military & defense for the Period 2022 - 2032F
- Historical Data and Forecast of Bulgaria Technical Ceramics Market Revenues & Volume By Others for the Period 2022 - 2032F
- Bulgaria Technical Ceramics Import Export Trade Statistics
- Market Opportunity Assessment By Material Type
- Market Opportunity Assessment By Product Type
- Market Opportunity Assessment By End-Use Industry
- Bulgaria Technical Ceramics Top Companies Market Share
- Bulgaria Technical Ceramics Competitive Benchmarking By Technical and Operational Parameters
- Bulgaria Technical Ceramics Company Profiles
- Bulgaria Technical Ceramics Key Strategic Recommendations
Frequently Asked Questions About the Market Study (FAQs):
6Wresearch actively monitors the Bulgaria Technical Ceramics Market and publishes its comprehensive annual report, highlighting emerging trends, growth drivers, revenue analysis, and forecast outlook. Our insights help businesses to make data-backed strategic decisions with ongoing market dynamics. Our analysts track relevent industries related to the Bulgaria Technical Ceramics Market, allowing our clients with actionable intelligence and reliable forecasts tailored to emerging regional needs.
Yes, we provide customisation as per your requirements. To learn more, feel free to contact us on sales@6wresearch.com
1 Executive Summary |
2 Introduction |
2.1 Key Highlights of the Report |
2.2 Report Description |
2.3 Market Scope & Segmentation |
2.4 Research Methodology |
2.5 Assumptions |
3 Bulgaria Technical Ceramics Market Overview |
3.1 Bulgaria Country Macro Economic Indicators |
3.2 Bulgaria Technical Ceramics Market Revenues & Volume, 2022 & 2032F |
3.3 Bulgaria Technical Ceramics Market - Industry Life Cycle |
3.4 Bulgaria Technical Ceramics Market - Porter's Five Forces |
3.5 Bulgaria Technical Ceramics Market Revenues & Volume Share, By Material Type, 2022 & 2032F |
3.6 Bulgaria Technical Ceramics Market Revenues & Volume Share, By Product Type, 2022 & 2032F |
3.7 Bulgaria Technical Ceramics Market Revenues & Volume Share, By End-Use Industry, 2022 & 2032F |
4 Bulgaria Technical Ceramics Market Dynamics |
4.1 Impact Analysis |
4.2 Market Drivers |
4.2.1 Increasing demand for technical ceramics in industries such as electronics, automotive, and healthcare |
4.2.2 Growing focus on energy efficiency and sustainability driving the adoption of technical ceramics |
4.2.3 Technological advancements leading to the development of innovative ceramic materials |
4.3 Market Restraints |
4.3.1 High production costs of technical ceramics may hinder market growth |
4.3.2 Lack of skilled workforce for manufacturing and processing of technical ceramics |
4.3.3 Competition from alternative materials such as metals and plastics |
5 Bulgaria Technical Ceramics Market Trends |
6 Bulgaria Technical Ceramics Market Segmentations |
6.1 Bulgaria Technical Ceramics Market, By Material Type |
6.1.1 Overview and Analysis |
6.1.2 Bulgaria Technical Ceramics Market Revenues & Volume, By Oxide ceramics, 2022 - 2032F |
6.1.3 Bulgaria Technical Ceramics Market Revenues & Volume, By Non-oxide ceramics, 2022 - 2032F |
6.2 Bulgaria Technical Ceramics Market, By Product Type |
6.2.1 Overview and Analysis |
6.2.2 Bulgaria Technical Ceramics Market Revenues & Volume, By Monolithic ceramics, 2022 - 2032F |
6.2.3 Bulgaria Technical Ceramics Market Revenues & Volume, By Ceramic matrix composites, 2022 - 2032F |
6.2.4 Bulgaria Technical Ceramics Market Revenues & Volume, By Ceramic coatings, 2022 - 2032F |
6.2.5 Bulgaria Technical Ceramics Market Revenues & Volume, By Others, 2022 - 2032F |
6.3 Bulgaria Technical Ceramics Market, By End-Use Industry |
6.3.1 Overview and Analysis |
6.3.2 Bulgaria Technical Ceramics Market Revenues & Volume, By Electronics & semiconductor, 2022 - 2032F |
6.3.3 Bulgaria Technical Ceramics Market Revenues & Volume, By Automotive, 2022 - 2032F |
6.3.4 Bulgaria Technical Ceramics Market Revenues & Volume, By Energy & power, 2022 - 2032F |
6.3.5 Bulgaria Technical Ceramics Market Revenues & Volume, By Industrial, 2022 - 2032F |
6.3.6 Bulgaria Technical Ceramics Market Revenues & Volume, By Medical, 2022 - 2032F |
6.3.7 Bulgaria Technical Ceramics Market Revenues & Volume, By Military & defense, 2022 - 2032F |
7 Bulgaria Technical Ceramics Market Import-Export Trade Statistics |
7.1 Bulgaria Technical Ceramics Market Export to Major Countries |
7.2 Bulgaria Technical Ceramics Market Imports from Major Countries |
8 Bulgaria Technical Ceramics Market Key Performance Indicators |
8.1 Percentage increase in research and development investments in technical ceramics |
8.2 Number of patents filed for new ceramic materials and applications |
8.3 Adoption rate of technical ceramics in emerging industries such as renewable energy and aerospace |
9 Bulgaria Technical Ceramics Market - Opportunity Assessment |
9.1 Bulgaria Technical Ceramics Market Opportunity Assessment, By Material Type, 2022 & 2032F |
9.2 Bulgaria Technical Ceramics Market Opportunity Assessment, By Product Type, 2022 & 2032F |
9.3 Bulgaria Technical Ceramics Market Opportunity Assessment, By End-Use Industry, 2022 & 2032F |
10 Bulgaria Technical Ceramics Market - Competitive Landscape |
10.1 Bulgaria Technical Ceramics Market Revenue Share, By Companies, 2025 |
10.2 Bulgaria Technical Ceramics Market Competitive Benchmarking, By Operating and Technical Parameters |
11 Company Profiles |
12 Recommendations | 13 Disclaimer |
Export potential assessment - trade Analytics for 2030
Export potential enables firms to identify high-growth global markets with greater confidence by combining advanced trade intelligence with a structured quantitative methodology. The framework analyzes emerging demand trends and country-level import patterns while integrating macroeconomic and trade datasets such as GDP and population forecasts, bilateral import–export flows, tariff structures, elasticity differentials between developed and developing economies, geographic distance, and import demand projections. Using weighted trade values from 2020–2024 as the base period to project country-to-country export potential for 2030, these inputs are operationalized through calculated drivers such as gravity model parameters, tariff impact factors, and projected GDP per-capita growth. Through an analysis of hidden potentials, demand hotspots, and market conditions that are most favorable to success, this method enables firms to focus on target countries, maximize returns, and global expansion with data, backed by accuracy.
By factoring in the projected importer demand gap that is currently unmet and could be potential opportunity, it identifies the potential for the Exporter (Country) among 190 countries, against the general trade analysis, which identifies the biggest importer or exporter.
To discover high-growth global markets and optimize your business strategy:
Click Here
Pricing
- Single User License$ 1,995
- Department License$ 2,400
- Site License$ 3,120
- Global License$ 3,795

Search
Thought Leadership and Analyst Meet


Our Clients
Latest Reports
- United Kingdom (UK) Outdoor Cooking Equipment Market (2026-2032) | Investment Opportunities, Outlook, Growth, Competition, Trends, Pricing, Demand, Insights, Challenges, Drivers, Size, Restraints, segmentation, Value, Share, Forecast, Companies, Analysis, Revenue, Strategy
- United Arab Emirates (UAE) Outdoor Cooking Equipment Market (2026-2032) | Challenges, Value, Restraints, Growth, Competition, Revenue, Trends, Outlook, Analysis, Drivers, Share, Investment Opportunities, Strategy, Demand, Companies, Forecast, Pricing, segmentation, Size, Insights
- Vietnam Outdoor Cooking Equipment Market (2026-2032) | Demand, Investment Opportunities, Growth, Pricing, Trends, Restraints, Competition, Outlook, Drivers, Strategy, Challenges, Revenue, Analysis, segmentation, Value, Size, Share, Insights, Companies, Forecast
- Venezuela Outdoor Cooking Equipment Market (2026-2032) | Challenges, Revenue, Demand, Value, Pricing, Strategy, Competition, Analysis, Companies, Insights, Growth, Outlook, Forecast, Size, Restraints, segmentation, Drivers, Trends, Investment Opportunities, Share
- Uganda Outdoor Cooking Equipment Market (2026-2032) | Drivers, Pricing, Challenges, Value, Growth, Companies, segmentation, Strategy, Analysis, Demand, Outlook, Size, Competition, Restraints, Revenue, Forecast, Investment Opportunities, Insights, Trends, Share
- Turkey Outdoor Cooking Equipment Market (2026-2032) | Size, Competition, Outlook, Strategy, Forecast, Drivers, Trends, Companies, Revenue, Growth, Analysis, segmentation, Insights, Pricing, Restraints, Demand, Investment Opportunities, Value, Share, Challenges
- Tunisia Outdoor Cooking Equipment Market (2026-2032) | Analysis, Share, Pricing, Trends, Size, Outlook, Revenue, segmentation, Demand, Insights, Investment Opportunities, Restraints, Growth, Forecast, Competition, Drivers, Challenges, Companies, Strategy, Value
- Thailand Outdoor Cooking Equipment Market (2026-2032) | Growth, Revenue, Insights, Companies, Drivers, Strategy, Forecast, Size, Analysis, segmentation, Trends, Challenges, Competition, Share, Investment Opportunities, Demand, Pricing, Value, Restraints, Outlook
- Tanzania Outdoor Cooking Equipment Market (2026-2032) | Share, Drivers, Forecast, Revenue, Growth, Outlook, Analysis, Investment Opportunities, Restraints, segmentation, Demand, Pricing, Size, Insights, Challenges, Competition, Companies, Value, Trends, Strategy
- Tajikistan Outdoor Cooking Equipment Market (2026-2032) | Value, Pricing, Companies, Share, Strategy, Revenue, Investment Opportunities, Demand, Forecast, Size, Competition, Challenges, Growth, Insights, Restraints, segmentation, Analysis, Trends, Drivers, Outlook
Industry Events and Analyst Meet

HIMTEX 2026

India Refining Summit 2026

India EV Show 2026

EV tech India Expo 2026

Auto Tech Asia 2026
Whitepaper
- Middle East & Africa Commercial Security Market Click here to view more.
- Middle East & Africa Fire Safety Systems & Equipment Market Click here to view more.
- GCC Drone Market Click here to view more.
- Middle East Lighting Fixture Market Click here to view more.
- GCC Physical & Perimeter Security Market Click here to view more.
6WResearch In News
- Doha a strategic location for EV manufacturing hub: IPA Qatar
- Demand for luxury TVs surging in the GCC, says Samsung
- Empowering Growth: The Thriving Journey of Bangladesh’s Cable Industry
- Demand for luxury TVs surging in the GCC, says Samsung
- Video call with a traditional healer? Once unthinkable, it’s now common in South Africa
- Intelligent Buildings To Smooth GCC’s Path To Net Zero