Cambodia Beryllium Copper Wire Market (2026-2032) Outlook | Revenue, Share, Size, Growth, Trends, Companies, Industry, Analysis, Forecast & Value
Market Forecast By Types (0.02-0.5 mm, 0.5-2 mm, Above 2 mm), By Applications (Electrical Switches, Springs, Connectors, Other) And Competitive Landscape
| Product Code: ETC276333 | Publication Date: Aug 2022 | Updated Date: Mar 2026 | Product Type: Market Research Report | |
| Publisher: 6Wresearch | Author: Ravi Bhandari | No. of Pages: 75 | No. of Figures: 35 | No. of Tables: 20 |
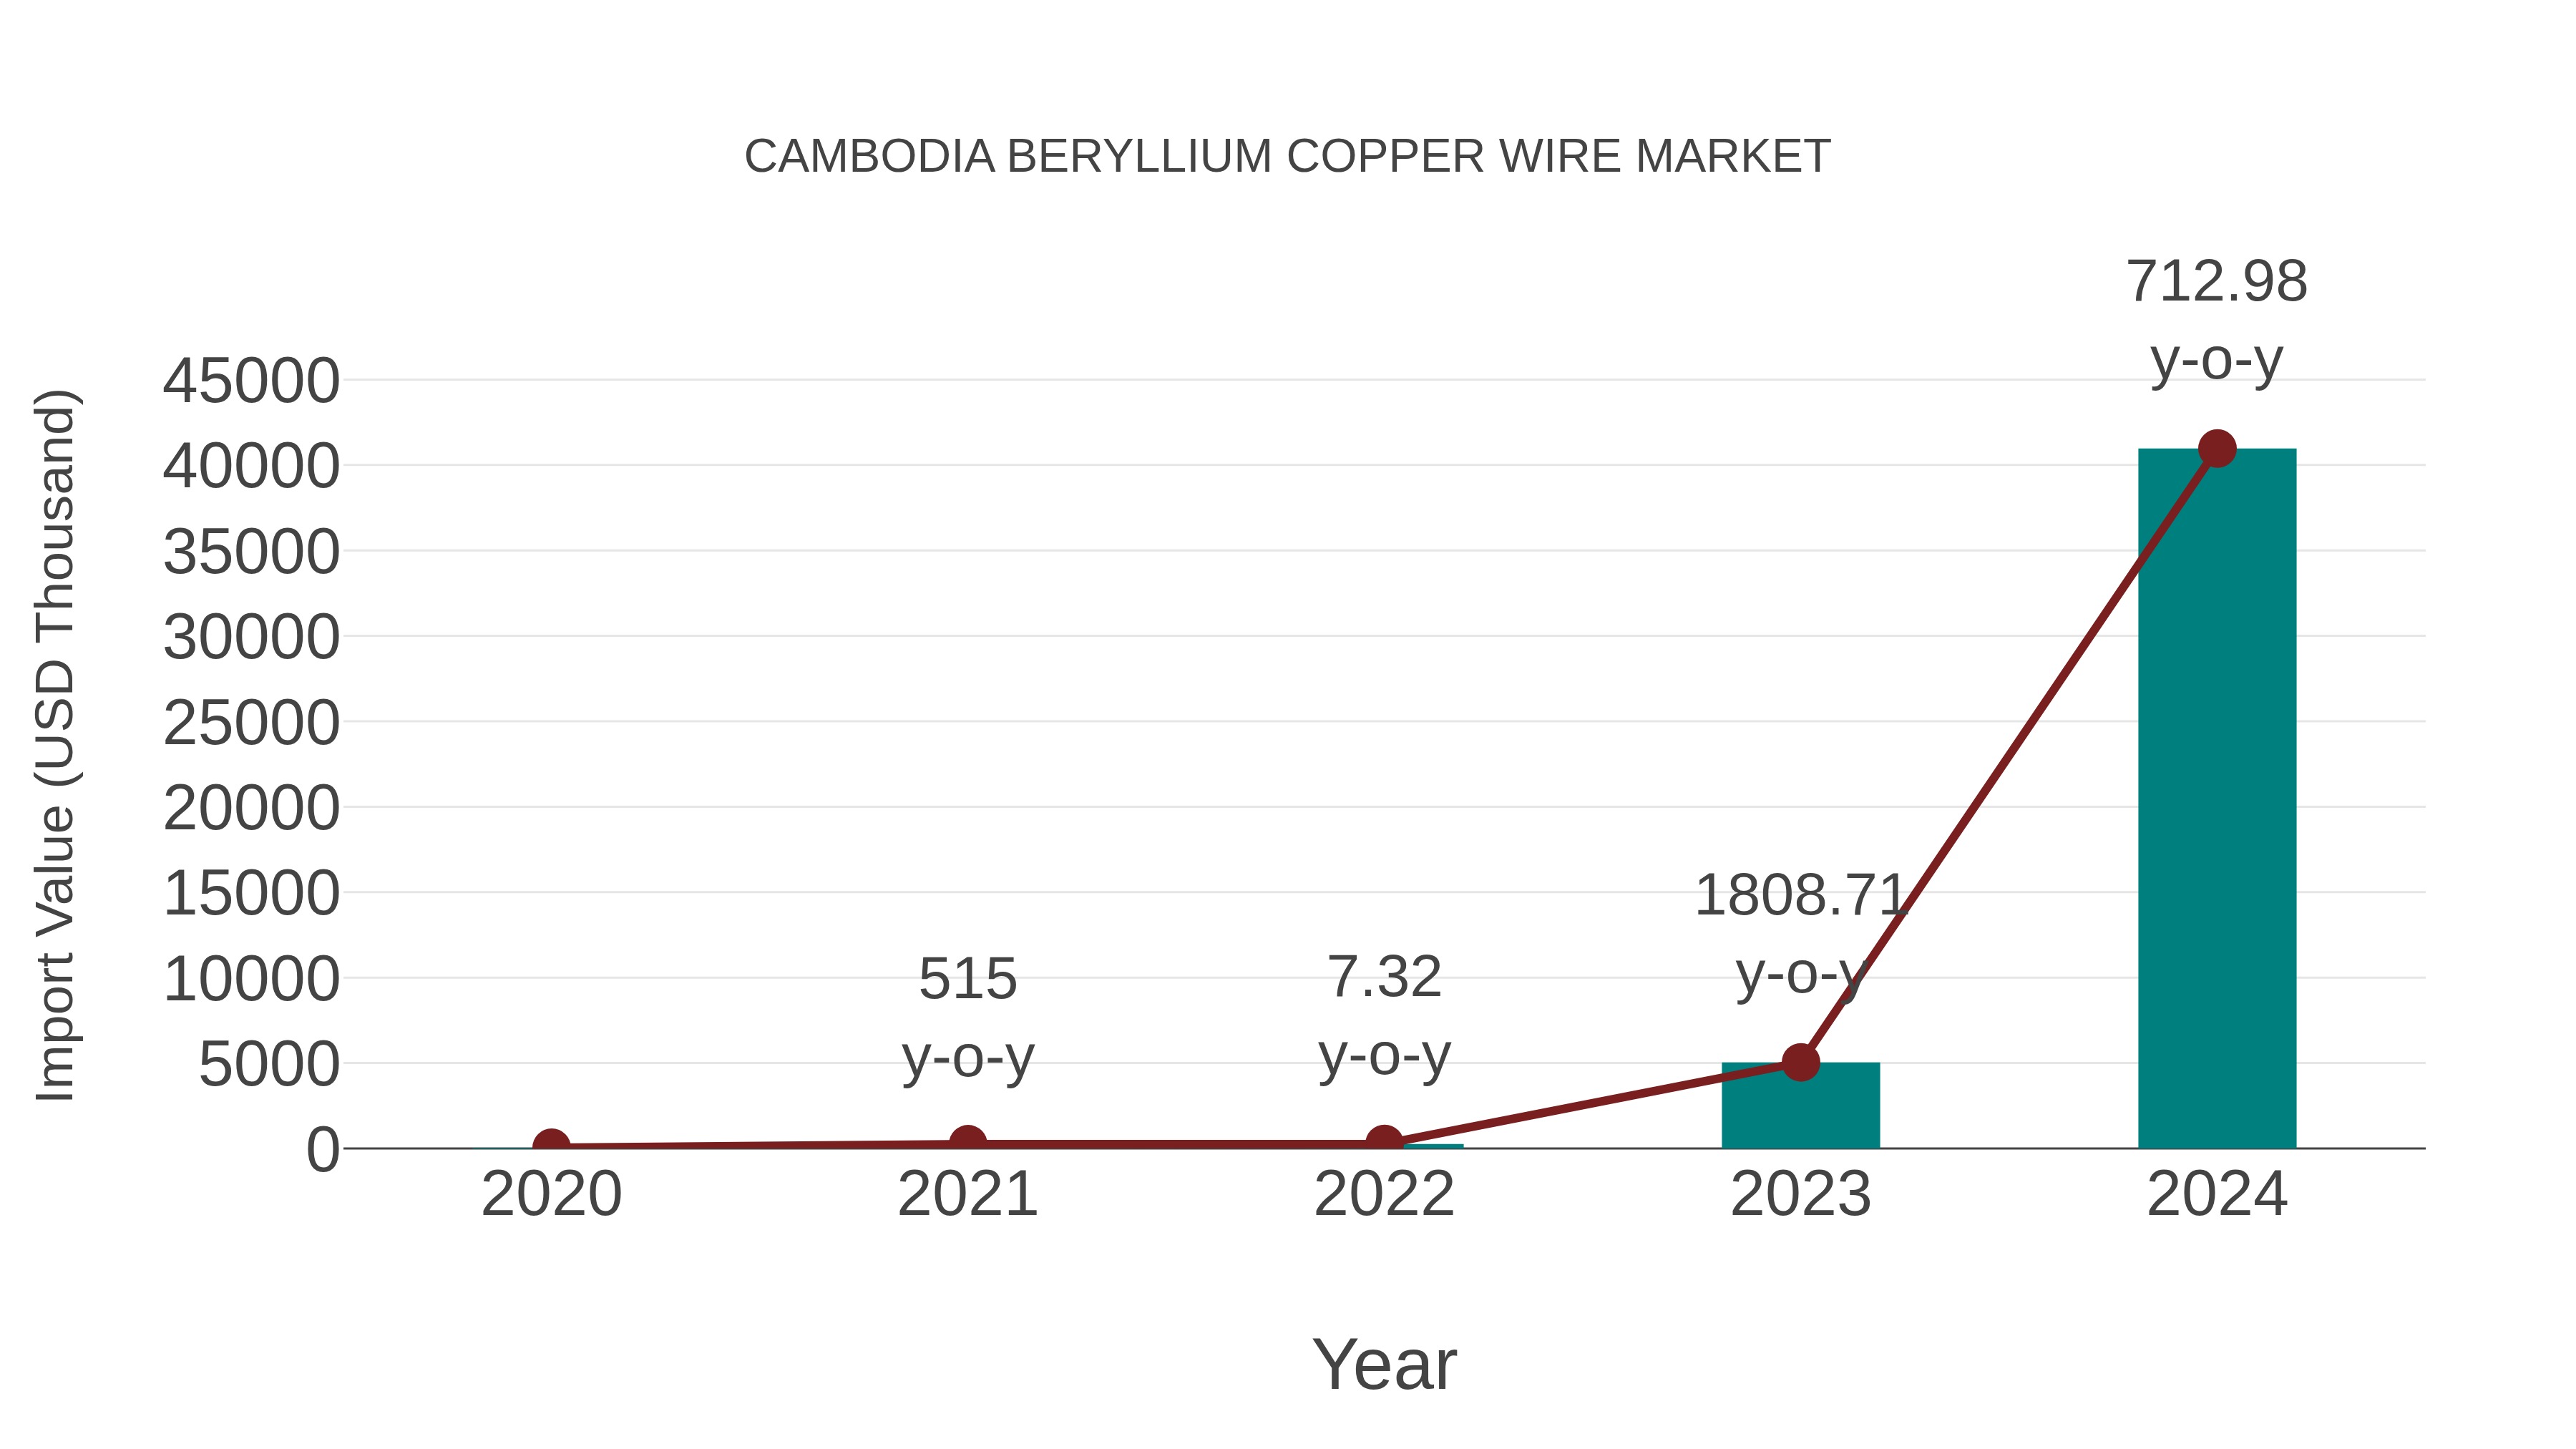
Cambodia Beryllium Copper Wire Market: Import Trend Analysis
Cambodia import trend for beryllium copper wire in the market saw significant growth from 2023 to 2024, with a remarkable rate of 712.98%. The compound annual growth rate (CAGR) for the period from 2020 to 2024 stood at 465.71%. This surge in imports can be attributed to a notable shift in demand dynamics within the market, likely driven by evolving industrial needs or changes in manufacturing processes.
Cambodia Beryllium Copper Wire Market Overview
The Cambodia beryllium copper wire market caters to industries requiring high-performance electrical and electronic components. Beryllium copper wires offer excellent conductivity, corrosion resistance, and thermal conductivity, making them ideal for applications in telecommunications, electronics, and automotive sectors. As Cambodia electronics manufacturing industry develops and demand for high-quality components increases, the market for beryllium copper wires is expected to expand.
Drivers of the market
The Cambodia beryllium copper wire market is driven by its unique properties such as high electrical conductivity, thermal conductivity, and corrosion resistance. Beryllium copper wires find applications in various industries including electronics, automotive, and aerospace. With the growing demand for electronic devices and automotive components in Cambodia, the demand for beryllium copper wires is expected to rise accordingly.
Challenges of the market
The beryllium copper wire market faces challenges related to material sourcing and safety regulations. Beryllium, a critical component of these wires, is rare and expensive, leading to supply constraints and price volatility. Moreover, stringent environmental and occupational health regulations governing beryllium use require compliance measures that add to production costs and complexity.
Government Policy of the market
In line with efforts to promote technological advancement and manufacturing capabilities, the government has implemented policies to support the electronics and electrical industries. These policies include incentives for domestic production and export-oriented strategies, boosting demand for beryllium copper wire used in electronic components.
Key Highlights of the Report:
- Cambodia Beryllium Copper Wire Market Outlook
- Market Size of Cambodia Beryllium Copper Wire Market, 2025
- Forecast of Cambodia Beryllium Copper Wire Market, 2032
- Historical Data and Forecast of Cambodia Beryllium Copper Wire Revenues & Volume for the Period 2022-2032F
- Cambodia Beryllium Copper Wire Market Trend Evolution
- Cambodia Beryllium Copper Wire Market Drivers and Challenges
- Cambodia Beryllium Copper Wire Price Trends
- Cambodia Beryllium Copper Wire Porter's Five Forces
- Cambodia Beryllium Copper Wire Industry Life Cycle
- Historical Data and Forecast of Cambodia Beryllium Copper Wire Market Revenues & Volume By Types for the Period 2022-2032F
- Historical Data and Forecast of Cambodia Beryllium Copper Wire Market Revenues & Volume By 0.02-0.5 mm for the Period 2022-2032F
- Historical Data and Forecast of Cambodia Beryllium Copper Wire Market Revenues & Volume By 0.5-2 mm for the Period 2022-2032F
- Historical Data and Forecast of Cambodia Beryllium Copper Wire Market Revenues & Volume By Above 2 mm for the Period 2022-2032F
- Historical Data and Forecast of Cambodia Beryllium Copper Wire Market Revenues & Volume By Applications for the Period 2022-2032F
- Historical Data and Forecast of Cambodia Beryllium Copper Wire Market Revenues & Volume By Electrical Switches for the Period 2022-2032F
- Historical Data and Forecast of Cambodia Beryllium Copper Wire Market Revenues & Volume By Springs for the Period 2022-2032F
- Historical Data and Forecast of Cambodia Beryllium Copper Wire Market Revenues & Volume By Connectors for the Period 2022-2032F
- Historical Data and Forecast of Cambodia Beryllium Copper Wire Market Revenues & Volume By Other for the Period 2022-2032F
- Cambodia Beryllium Copper Wire Import Export Trade Statistics
- Market Opportunity Assessment By Types
- Market Opportunity Assessment By Applications
- Cambodia Beryllium Copper Wire Top Companies Market Share
- Cambodia Beryllium Copper Wire Competitive Benchmarking By Technical and Operational Parameters
- Cambodia Beryllium Copper Wire Company Profiles
- Cambodia Beryllium Copper Wire Key Strategic Recommendations
Cambodia Beryllium Copper Wire Market (2026-2032): FAQs
6Wresearch actively monitors the Cambodia Beryllium Copper Wire Market and publishes its comprehensive annual report, highlighting emerging trends, growth drivers, revenue analysis, and forecast outlook. Our insights help businesses to make data-backed strategic decisions with ongoing market dynamics. Our analysts track relevent industries related to the Cambodia Beryllium Copper Wire Market, allowing our clients with actionable intelligence and reliable forecasts tailored to emerging regional needs.
Yes, we provide customisation as per your requirements. To learn more, feel free to contact us on sales@6wresearch.com
1 Executive Summary |
2 Introduction |
2.1 Key Highlights of the Report |
2.2 Report Description |
2.3 Market Scope & Segmentation |
2.4 Research Methodology |
2.5 Assumptions |
3 Cambodia Beryllium Copper Wire Market Overview |
3.1 Cambodia Country Macro Economic Indicators |
3.2 Cambodia Beryllium Copper Wire Market Revenues & Volume, 2022 & 2032F |
3.3 Cambodia Beryllium Copper Wire Market - Industry Life Cycle |
3.4 Cambodia Beryllium Copper Wire Market - Porter's Five Forces |
3.5 Cambodia Beryllium Copper Wire Market Revenues & Volume Share, By Types, 2022 & 2032F |
3.6 Cambodia Beryllium Copper Wire Market Revenues & Volume Share, By Applications, 2022 & 2032F |
4 Cambodia Beryllium Copper Wire Market Dynamics |
4.1 Impact Analysis |
4.2 Market Drivers |
4.2.1 Growing demand from the electronics industry |
4.2.2 Increasing adoption in aerospace and defense applications |
4.2.3 Favorable properties such as high conductivity and corrosion resistance |
4.3 Market Restraints |
4.3.1 Fluctuating raw material prices |
4.3.2 Limited availability of beryllium copper resources |
4.3.3 Stringent environmental regulations affecting production processes |
5 Cambodia Beryllium Copper Wire Market Trends |
6 Cambodia Beryllium Copper Wire Market, By Types |
6.1 Cambodia Beryllium Copper Wire Market, By Types |
6.1.1 Overview and Analysis |
6.1.2 Cambodia Beryllium Copper Wire Market Revenues & Volume, By Types, 2022-2032F |
6.1.3 Cambodia Beryllium Copper Wire Market Revenues & Volume, By 0.02-0.5 mm, 2022-2032F |
6.1.4 Cambodia Beryllium Copper Wire Market Revenues & Volume, By 0.5-2 mm, 2022-2032F |
6.1.5 Cambodia Beryllium Copper Wire Market Revenues & Volume, By Above 2 mm, 2022-2032F |
6.2 Cambodia Beryllium Copper Wire Market, By Applications |
6.2.1 Overview and Analysis |
6.2.2 Cambodia Beryllium Copper Wire Market Revenues & Volume, By Electrical Switches, 2022-2032F |
6.2.3 Cambodia Beryllium Copper Wire Market Revenues & Volume, By Springs, 2022-2032F |
6.2.4 Cambodia Beryllium Copper Wire Market Revenues & Volume, By Connectors, 2022-2032F |
6.2.5 Cambodia Beryllium Copper Wire Market Revenues & Volume, By Other, 2022-2032F |
7 Cambodia Beryllium Copper Wire Market Import-Export Trade Statistics |
7.1 Cambodia Beryllium Copper Wire Market Export to Major Countries |
7.2 Cambodia Beryllium Copper Wire Market Imports from Major Countries |
8 Cambodia Beryllium Copper Wire Market Key Performance Indicators |
8.1 Percentage of market share held by beryllium copper wire in key industries |
8.2 Number of new product developments using beryllium copper wire |
8.3 Average selling price of beryllium copper wire compared to traditional alternatives |
8.4 Number of patents related to beryllium copper wire technology filed or granted |
8.5 Adoption rate of beryllium copper wire in emerging applications |
9 Cambodia Beryllium Copper Wire Market - Opportunity Assessment |
9.1 Cambodia Beryllium Copper Wire Market Opportunity Assessment, By Types, 2022 & 2032F |
9.2 Cambodia Beryllium Copper Wire Market Opportunity Assessment, By Applications, 2022 & 2032F |
10 Cambodia Beryllium Copper Wire Market - Competitive Landscape |
10.1 Cambodia Beryllium Copper Wire Market Revenue Share, By Companies, 2025 |
10.2 Cambodia Beryllium Copper Wire Market Competitive Benchmarking, By Operating and Technical Parameters |
11 Company Profiles |
12 Recommendations |
13 Disclaimer |
Global Go To Market Strategy - 2030
Export potential enables firms to identify high-growth global markets with greater confidence by combining advanced trade intelligence with a structured quantitative methodology. The framework analyzes emerging demand trends and country-level import patterns while integrating macroeconomic and trade datasets such as GDP and population forecasts, bilateral import–export flows, tariff structures, elasticity differentials between developed and developing economies, geographic distance, and import demand projections. Using weighted trade values from 2020–2024 as the base period to project country-to-country export potential for 2030, these inputs are operationalized through calculated drivers such as gravity model parameters, tariff impact factors, and projected GDP per-capita growth. Through an analysis of hidden potentials, demand hotspots, and market conditions that are most favorable to success, this method enables firms to focus on target countries, maximize returns, and global expansion with data, backed by accuracy.
By factoring in the projected importer demand gap that is currently unmet and could be potential opportunity, it identifies the potential for the Exporter (Country) among 190 countries, against the general trade analysis, which identifies the biggest importer or exporter.
To discover high-growth global markets and optimize your business strategy:
Click Here
Pricing
- Single User License$ 1,995
- Department License$ 2,400
- Site License$ 3,120
- Global License$ 3,795

Leadership Perspectives from Industry Events
Search
Thought Leadership and Analyst Meet


Our Clients
6WResearch In News
- India Air Conditioner Market Set for Strong Rebound in 2026 After Weather-Led Correction and GST-Driven Recovery: 6Wresearch
- ADAS in India: How Automatic Emergency Braking, Blind Spot Detection & Driver Monitoring are Transforming Road Safety
- Doha a strategic location for EV manufacturing hub: IPA Qatar
- Demand for luxury TVs surging in the GCC, says Samsung
- Empowering Growth: The Thriving Journey of Bangladesh’s Cable Industry
- Demand for luxury TVs surging in the GCC, says Samsung
Latest Reports
- Nicaragua RPG Gaming Market (2026-2032)
- New Zealand RPG Gaming Market (2026-2032)
- Netherlands RPG Gaming Market (2026-2032)
- Nauru RPG Gaming Market (2026-2032)
- Namibia RPG Gaming Market (2026-2032)
- Mozambique RPG Gaming Market (2026-2032)
- Montenegro RPG Gaming Market (2026-2032)
- Mongolia RPG Gaming Market (2026-2032)
- Monaco RPG Gaming Market (2026-2032)
- Micronesia RPG Gaming Market (2026-2032)
Industry Events and Analyst Meet

EV India Expo 2026

HIMTEX 2026

India Refining Summit 2026

India EV Show 2026

EV tech India Expo 2026
Whitepaper
- Middle East & Africa Commercial Security Market Click here to view more.
- Middle East & Africa Fire Safety Systems & Equipment Market Click here to view more.
- GCC Drone Market Click here to view more.
- Middle East Lighting Fixture Market Click here to view more.
- GCC Physical & Perimeter Security Market Click here to view more.