Cambodia Ion exchange resins Market (2026-2032) Outlook | Forecast, Size, Share, Value, Companies, Trends, Industry, Analysis, Growth & Revenue
Market Forecast By Type (Cationic Resins, Anionic Resins, Others), By Application (Water, Non-water), By End-use Industry (Power, Chemical & Petrochemical, Food & Beverage, Pharmaceutical, Electrical & Electronics, Metal & Mining, Others) And Competitive Landscape
| Product Code: ETC100672 | Publication Date: Jun 2021 | Updated Date: Mar 2026 | Product Type: Report | |
| Publisher: 6Wresearch | Author: Ravi Bhandari | No. of Pages: 70 | No. of Figures: 35 | No. of Tables: 5 |
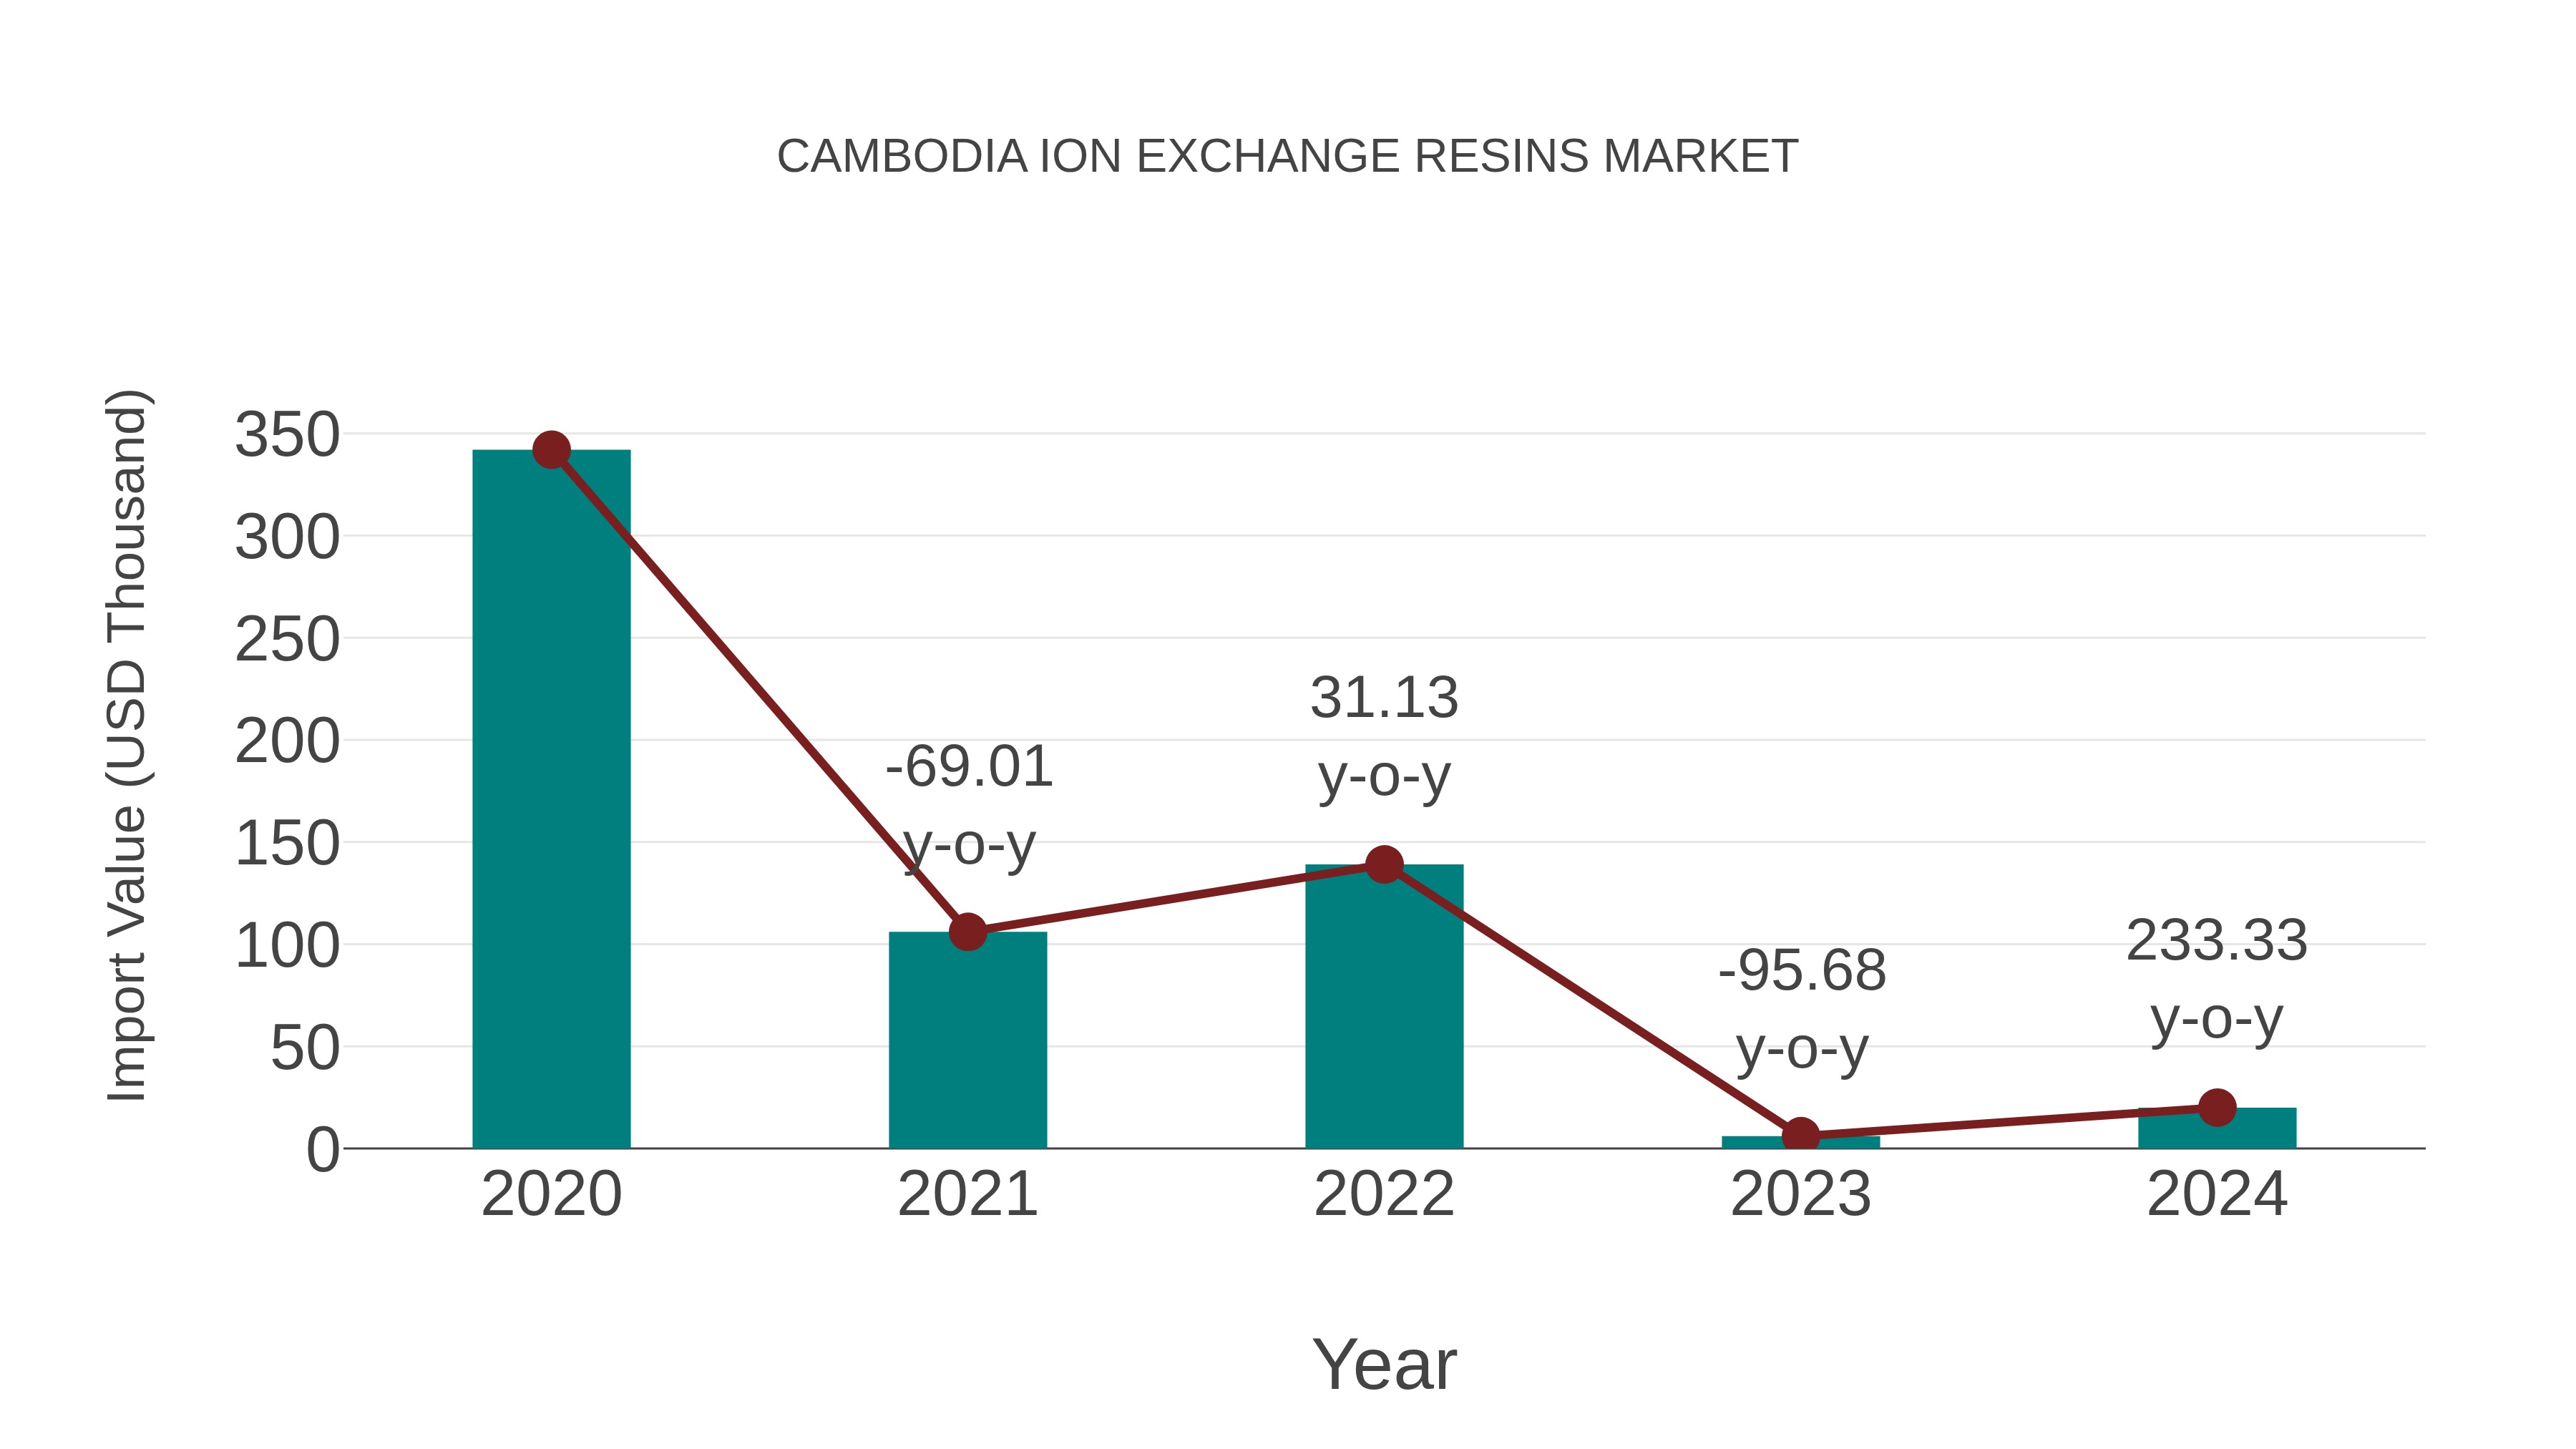
Cambodia Ion Exchange Resins Market: Import Trend Analysis
In the Cambodia ion exchange resins market, the import trend experienced significant fluctuations. From 2023 to 2024, there was a substantial growth rate of 233.33%, contrasting with a negative Compound Annual Growth Rate (CAGR) of -50.82% from 2020 to 2024. This sharp growth in imports in 2024 could be attributed to a sudden surge in demand or a shift in market dynamics, potentially influenced by changing trade policies or evolving industry requirements.
Ion exchange resins Market: Cambodia vs Top 5 Major Economies in 2027 (Asia)
By 2027, the Ion exchange resins market in Cambodia is anticipated to reach a growth rate of 11.99%, as part of an increasingly competitive Asia region, where China remains at the forefront, supported by India, Japan, Australia and South Korea, driving innovations and market adoption across sectors.

Cambodia Ion exchange resins Market Overview
Ion exchange resins are used for water treatment, purification, and separation processes in industries such as pharmaceuticals, food and beverage, and power generation. In Cambodia, the market for ion exchange resins is driven by the need for clean water, efficient wastewater treatment, and environmental sustainability.
Drivers of the market
The ion exchange resins market in Cambodia is driven by factors such as water treatment, chemical processing, and environmental regulations. Ion exchange resins remove impurities, ions, and contaminants from water, chemicals, and industrial fluids through ion exchange processes. Factors such as water quality standards, wastewater treatment, and purification requirements drive demand for ion exchange resin products, stimulating market growth.
Challenges of the market
Challenges in the ion exchange resins market include addressing concerns related to resin regeneration efficiency and waste management. Ensuring resin quality and addressing compatibility with different water treatment applications pose hurdles for manufacturers. Moreover, promoting sustainable resin production methods and addressing regulatory compliance could impact market growth.
Government Policy of the market
Government policies in the ion exchange resins market aim to promote water treatment, environmental protection, and resource conservation. Regulatory frameworks may govern resin manufacturing processes, product quality standards, and usage guidelines to ensure compliance with water quality regulations and environmental sustainability goals. Moreover, measures to support research and development in resin technology, promote industry standards and best practices, and provide incentives for investing in water treatment infrastructure may be implemented to enhance water purification, mitigate pollution, and protect natural ecosystems in Cambodia.
Key Highlights of the Report:
- Cambodia Ion exchange resins Market Outlook
- Market Size of Cambodia Ion exchange resins Market, 2025
- Forecast of Cambodia Ion exchange resins Market, 2032
- Historical Data and Forecast of Cambodia Ion exchange resins Revenues & Volume for the Period 2022-2032F
- Cambodia Ion exchange resins Market Trend Evolution
- Cambodia Ion exchange resins Market Drivers and Challenges
- Cambodia Ion exchange resins Price Trends
- Cambodia Ion exchange resins Porter's Five Forces
- Cambodia Ion exchange resins Industry Life Cycle
- Historical Data and Forecast of Cambodia Ion exchange resins Market Revenues & Volume By Type for the Period 2022-2032F
- Historical Data and Forecast of Cambodia Ion exchange resins Market Revenues & Volume By Cationic Resins for the Period 2022-2032F
- Historical Data and Forecast of Cambodia Ion exchange resins Market Revenues & Volume By Anionic Resins for the Period 2022-2032F
- Historical Data and Forecast of Cambodia Ion exchange resins Market Revenues & Volume By Others for the Period 2022-2032F
- Historical Data and Forecast of Cambodia Ion exchange resins Market Revenues & Volume By Application for the Period 2022-2032F
- Historical Data and Forecast of Cambodia Ion exchange resins Market Revenues & Volume By Water for the Period 2022-2032F
- Historical Data and Forecast of Cambodia Ion exchange resins Market Revenues & Volume By Non-water for the Period 2022-2032F
- Historical Data and Forecast of Cambodia Ion exchange resins Market Revenues & Volume By End-use Industry for the Period 2022-2032F
- Historical Data and Forecast of Cambodia Ion exchange resins Market Revenues & Volume By Power for the Period 2022-2032F
- Historical Data and Forecast of Cambodia Ion exchange resins Market Revenues & Volume By Chemical & Petrochemical for the Period 2022-2032F
- Historical Data and Forecast of Cambodia Ion exchange resins Market Revenues & Volume By Food & Beverage for the Period 2022-2032F
- Historical Data and Forecast of Cambodia Ion exchange resins Market Revenues & Volume By Pharmaceutical for the Period 2022-2032F
- Historical Data and Forecast of Cambodia Ion exchange resins Market Revenues & Volume By Electrical & Electronics for the Period 2022-2032F
- Historical Data and Forecast of Cambodia Ion exchange resins Market Revenues & Volume By Metal & Mining for the Period 2022-2032F
- Historical Data and Forecast of Cambodia Ion exchange resins Market Revenues & Volume By Others for the Period 2022-2032F
- Cambodia Ion exchange resins Import Export Trade Statistics
- Market Opportunity Assessment By Type
- Market Opportunity Assessment By Application
- Market Opportunity Assessment By End-use Industry
- Cambodia Ion exchange resins Top Companies Market Share
- Cambodia Ion exchange resins Competitive Benchmarking By Technical and Operational Parameters
- Cambodia Ion exchange resins Company Profiles
- Cambodia Ion exchange resins Key Strategic Recommendations
Cambodia Ion exchange resins Market (2026-2032): FAQs
6Wresearch actively monitors the Cambodia Ion exchange resins Market and publishes its comprehensive annual report, highlighting emerging trends, growth drivers, revenue analysis, and forecast outlook. Our insights help businesses to make data-backed strategic decisions with ongoing market dynamics. Our analysts track relevent industries related to the Cambodia Ion exchange resins Market, allowing our clients with actionable intelligence and reliable forecasts tailored to emerging regional needs.
Yes, we provide customisation as per your requirements. To learn more, feel free to contact us on sales@6wresearch.com
1 Executive Summary |
2 Introduction |
2.1 Key Highlights of the Report |
2.2 Report Description |
2.3 Market Scope & Segmentation |
2.4 Research Methodology |
2.5 Assumptions |
3 Cambodia Ion exchange resins Market Overview |
3.1 Cambodia Country Macro Economic Indicators |
3.2 Cambodia Ion exchange resins Market Revenues & Volume, 2022 & 2032F |
3.3 Cambodia Ion exchange resins Market - Industry Life Cycle |
3.4 Cambodia Ion exchange resins Market - Porter's Five Forces |
3.5 Cambodia Ion exchange resins Market Revenues & Volume Share, By Type, 2022 & 2032F |
3.6 Cambodia Ion exchange resins Market Revenues & Volume Share, By Form, 2022 & 2032F |
3.7 Cambodia Ion exchange resins Market Revenues & Volume Share, By End-use Industry, 2022 & 2032F |
4 Cambodia Ion exchange resins Market Dynamics |
4.1 Impact Analysis |
4.2 Market Drivers |
4.3 Market Restraints |
5 Cambodia Ion exchange resins Market Trends |
6 Cambodia Ion exchange resins Market, By Types |
6.1 Cambodia Ion exchange resins Market, By Type |
6.1.1 Overview and Analysis |
6.1.2 Cambodia Ion exchange resins Market Revenues & Volume, By Type, 2022-2032F |
6.1.3 Cambodia Ion exchange resins Market Revenues & Volume, By Cationic Resins, 2022-2032F |
6.1.4 Cambodia Ion exchange resins Market Revenues & Volume, By Anionic Resins, 2022-2032F |
6.1.5 Cambodia Ion exchange resins Market Revenues & Volume, By Others, 2022-2032F |
6.2 Cambodia Ion exchange resins Market, By Application |
6.2.1 Overview and Analysis |
6.2.2 Cambodia Ion exchange resins Market Revenues & Volume, By Water, 2022-2032F |
6.2.3 Cambodia Ion exchange resins Market Revenues & Volume, By Non-water, 2022-2032F |
6.3 Cambodia Ion exchange resins Market, By End-use Industry |
6.3.1 Overview and Analysis |
6.3.2 Cambodia Ion exchange resins Market Revenues & Volume, By Power, 2022-2032F |
6.3.3 Cambodia Ion exchange resins Market Revenues & Volume, By Chemical & Petrochemical, 2022-2032F |
6.3.4 Cambodia Ion exchange resins Market Revenues & Volume, By Food & Beverage, 2022-2032F |
6.3.5 Cambodia Ion exchange resins Market Revenues & Volume, By Pharmaceutical, 2022-2032F |
6.3.6 Cambodia Ion exchange resins Market Revenues & Volume, By Electrical & Electronics, 2022-2032F |
6.3.7 Cambodia Ion exchange resins Market Revenues & Volume, By Metal & Mining, 2022-2032F |
7 Cambodia Ion exchange resins Market Import-Export Trade Statistics |
7.1 Cambodia Ion exchange resins Market Export to Major Countries |
7.2 Cambodia Ion exchange resins Market Imports from Major Countries |
8 Cambodia Ion exchange resins Market Key Performance Indicators |
9 Cambodia Ion exchange resins Market - Opportunity Assessment |
9.1 Cambodia Ion exchange resins Market Opportunity Assessment, By Type, 2022 & 2032F |
9.2 Cambodia Ion exchange resins Market Opportunity Assessment, By Application, 2022 & 2032F |
9.3 Cambodia Ion exchange resins Market Opportunity Assessment, By End-use Industry, 2022 & 2032F |
10 Cambodia Ion exchange resins Market - Competitive Landscape |
10.1 Cambodia Ion exchange resins Market Revenue Share, By Companies, 2025 |
10.2 Cambodia Ion exchange resins Market Competitive Benchmarking, By Operating and Technical Parameters |
11 Company Profiles |
12 Recommendations |
13 Disclaimer |
Global Go To Market Strategy - 2030
Export potential enables firms to identify high-growth global markets with greater confidence by combining advanced trade intelligence with a structured quantitative methodology. The framework analyzes emerging demand trends and country-level import patterns while integrating macroeconomic and trade datasets such as GDP and population forecasts, bilateral import–export flows, tariff structures, elasticity differentials between developed and developing economies, geographic distance, and import demand projections. Using weighted trade values from 2020–2024 as the base period to project country-to-country export potential for 2030, these inputs are operationalized through calculated drivers such as gravity model parameters, tariff impact factors, and projected GDP per-capita growth. Through an analysis of hidden potentials, demand hotspots, and market conditions that are most favorable to success, this method enables firms to focus on target countries, maximize returns, and global expansion with data, backed by accuracy.
By factoring in the projected importer demand gap that is currently unmet and could be potential opportunity, it identifies the potential for the Exporter (Country) among 190 countries, against the general trade analysis, which identifies the biggest importer or exporter.
To discover high-growth global markets and optimize your business strategy:
Click Here
Pricing
- Single User License$ 1,995
- Department License$ 2,400
- Site License$ 3,120
- Global License$ 3,795

Leadership Perspectives from Industry Events
Search
Thought Leadership and Analyst Meet


Our Clients
6WResearch In News
- India Air Conditioner Market Set for Strong Rebound in 2026 After Weather-Led Correction and GST-Driven Recovery: 6Wresearch
- ADAS in India: How Automatic Emergency Braking, Blind Spot Detection & Driver Monitoring are Transforming Road Safety
- Doha a strategic location for EV manufacturing hub: IPA Qatar
- Demand for luxury TVs surging in the GCC, says Samsung
- Empowering Growth: The Thriving Journey of Bangladesh’s Cable Industry
- Demand for luxury TVs surging in the GCC, says Samsung
Latest Reports
- Nicaragua RPG Gaming Market (2026-2032)
- New Zealand RPG Gaming Market (2026-2032)
- Netherlands RPG Gaming Market (2026-2032)
- Nauru RPG Gaming Market (2026-2032)
- Namibia RPG Gaming Market (2026-2032)
- Mozambique RPG Gaming Market (2026-2032)
- Montenegro RPG Gaming Market (2026-2032)
- Mongolia RPG Gaming Market (2026-2032)
- Monaco RPG Gaming Market (2026-2032)
- Micronesia RPG Gaming Market (2026-2032)
Industry Events and Analyst Meet

EV India Expo 2026

HIMTEX 2026

India Refining Summit 2026

India EV Show 2026

EV tech India Expo 2026
Whitepaper
- Middle East & Africa Commercial Security Market Click here to view more.
- Middle East & Africa Fire Safety Systems & Equipment Market Click here to view more.
- GCC Drone Market Click here to view more.
- Middle East Lighting Fixture Market Click here to view more.
- GCC Physical & Perimeter Security Market Click here to view more.