Canada Nonmagnetic Wheelchair Market (2026-2032) | Investment Trends, Outlook, Competition, Value, Analysis, Share, Revenue, Consumer Insights, Strategic Insights, Forecast, Segments, Growth, Demand, Segmentation, Size, Trends, Challenges, Drivers, Restraints, Strategy, Industry, Pricing Analysis, Opportunities, Competitive, Supply, Companies
Market Forecast By Technology Type (Below 100 kg, 100 kg to 150 kg, Above 150 kg), By Application Area (Hospitals, Orthopedic Centers, Ambulatory Surgical Centers), By End User (Patients, Elderly, Disabled Individuals), By Product Type (Manual, Electric) And Competitive Landscape
| Product Code: ETC12697486 | Publication Date: Apr 2025 | Updated Date: Feb 2026 | Product Type: Market Research Report | |
| Publisher: 6Wresearch | Author: Sachin Kumar Rai | No. of Pages: 65 | No. of Figures: 34 | No. of Tables: 19 |
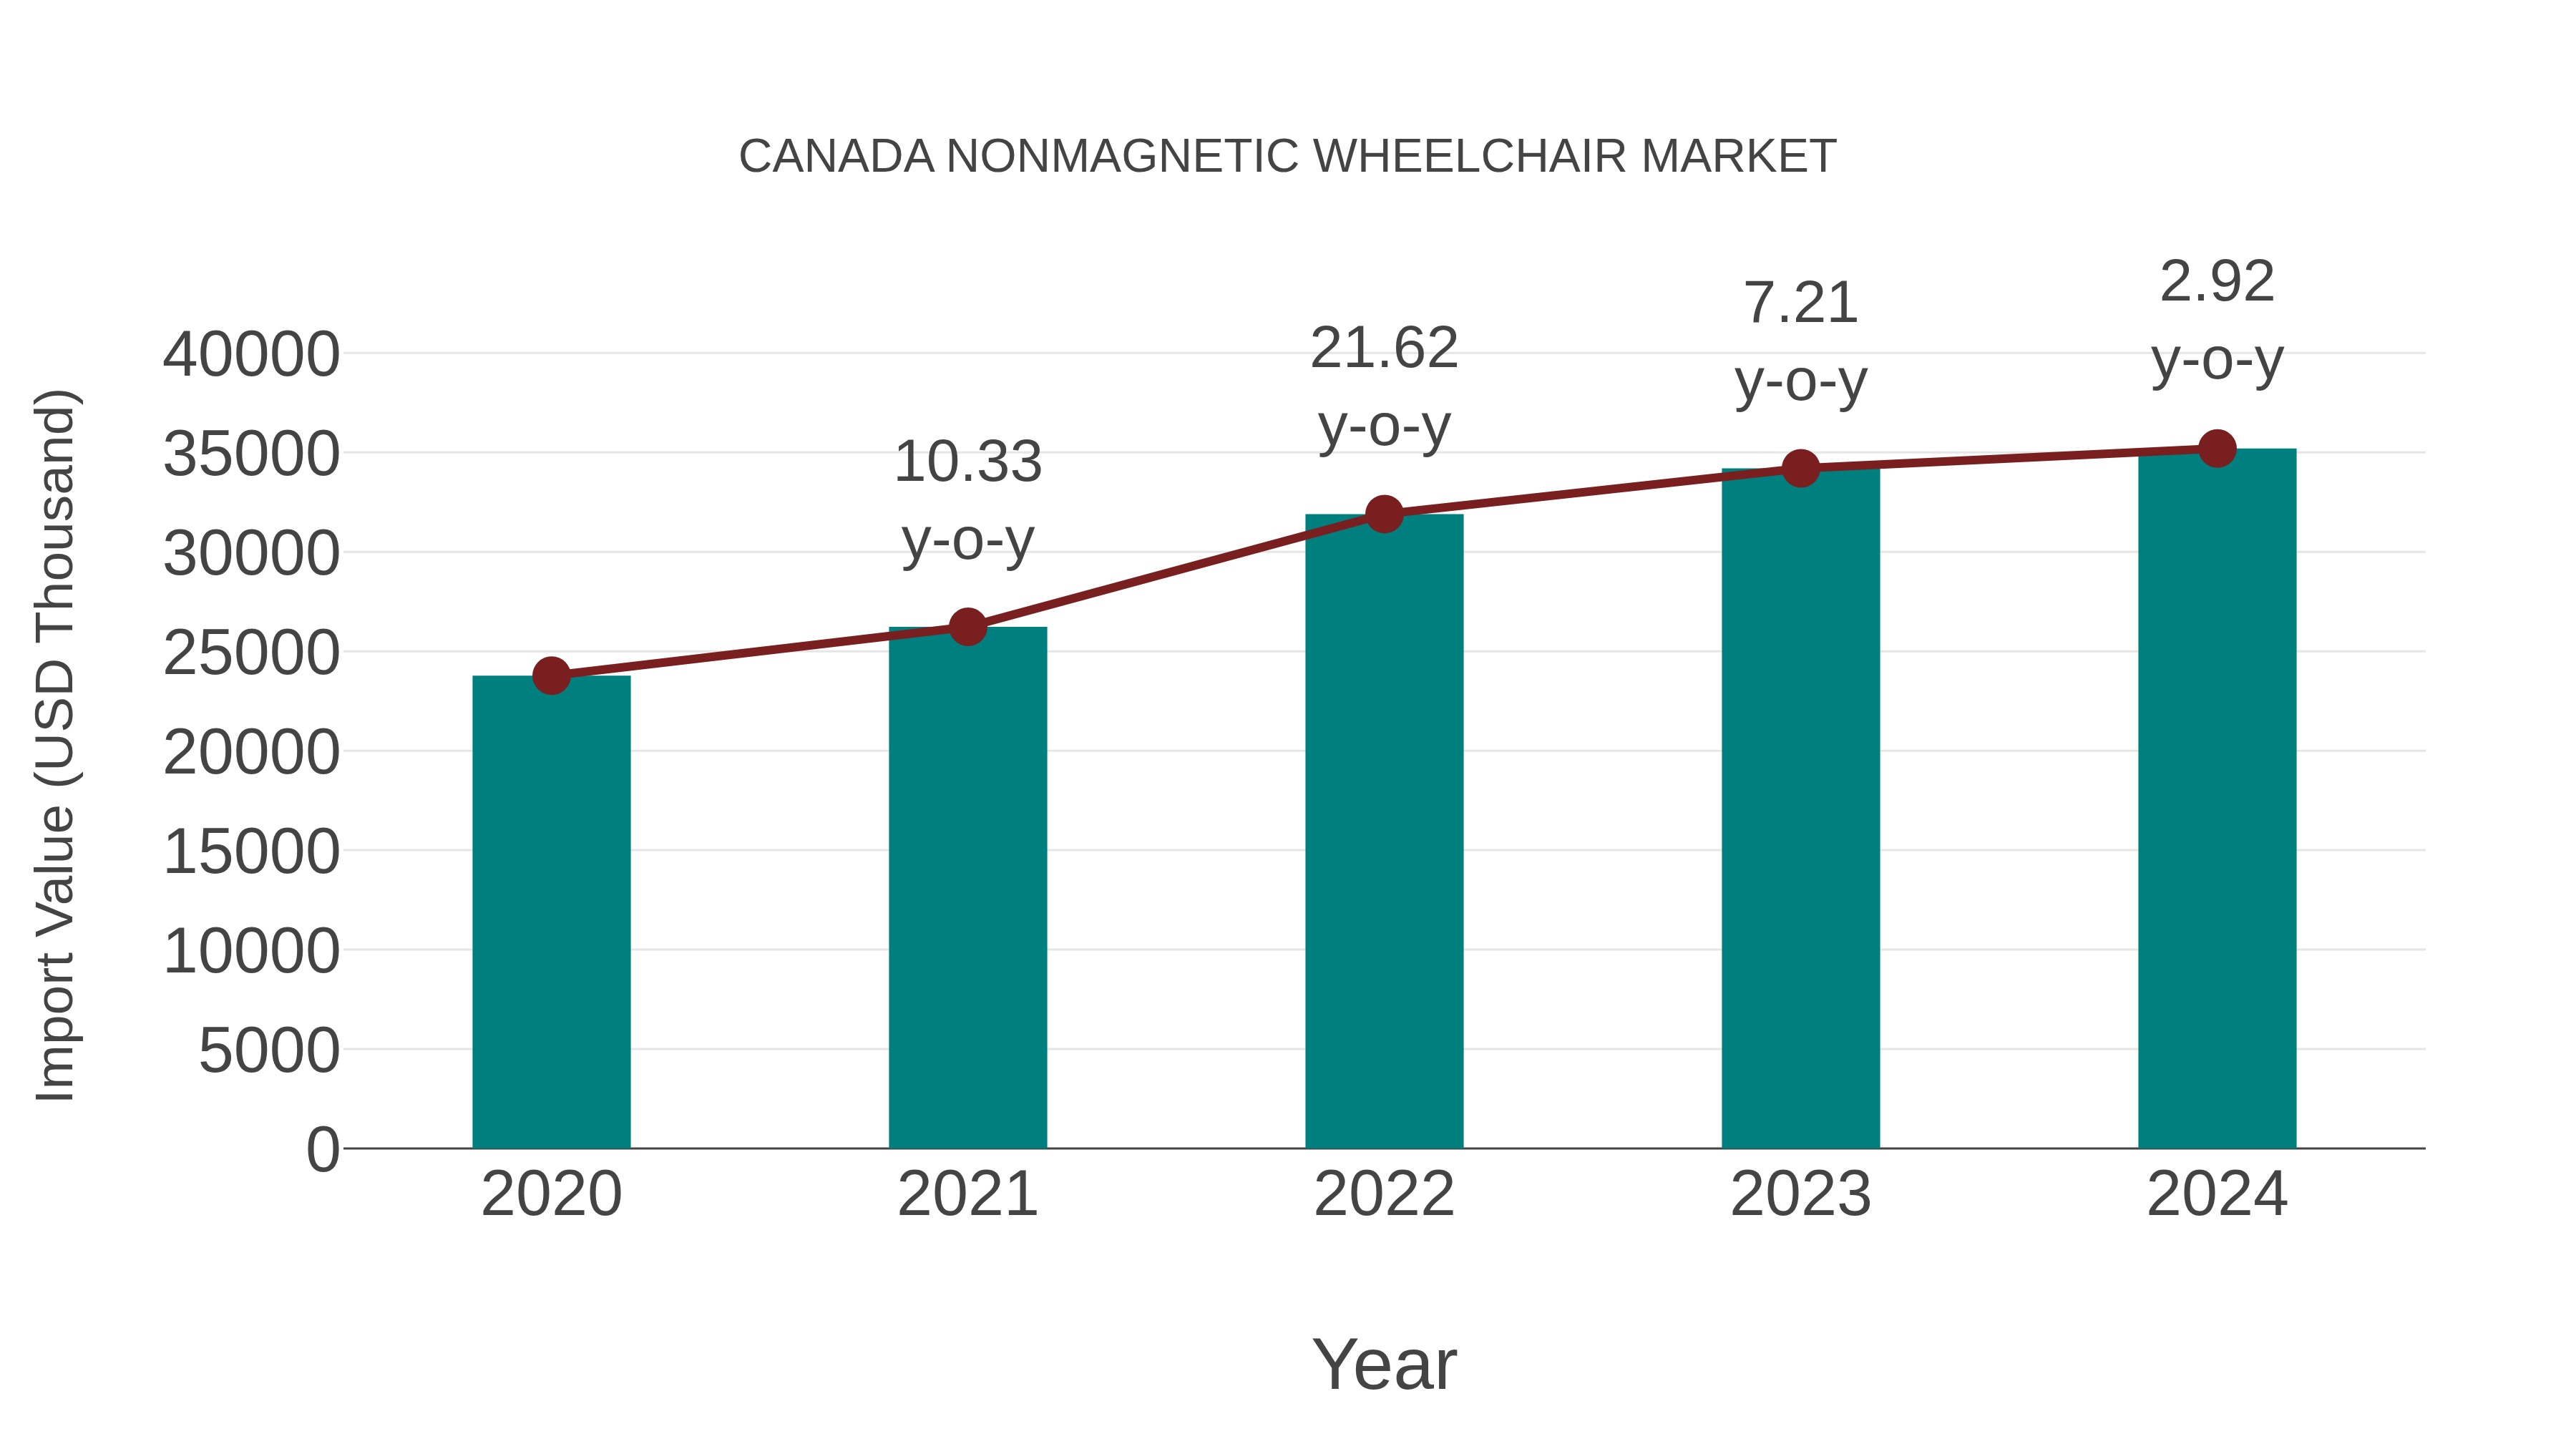
Canada Nonmagnetic Wheelchair Market: Import Trend Analysis
The Canada nonmagnetic wheelchair market witnessed a steady increase in imports during 2020-2024. The compound annual growth rate (CAGR) from 2020 to 2024 stood at 10.31%. In 2023-2024, the year-on-year growth rate was 2.92%, contributing to the overall rise in imports during the period.
Key Highlights of the Report:
- Canada Nonmagnetic Wheelchair Market Outlook
- Market Size of Canada Nonmagnetic Wheelchair Market, 2025
- Forecast of Canada Nonmagnetic Wheelchair Market, 2032
- Historical Data and Forecast of Canada Nonmagnetic Wheelchair Revenues & Volume for the Period 2022-2032F
- Canada Nonmagnetic Wheelchair Market Trend Evolution
- Canada Nonmagnetic Wheelchair Market Drivers and Challenges
- Canada Nonmagnetic Wheelchair Price Trends
- Canada Nonmagnetic Wheelchair Porter's Five Forces
- Canada Nonmagnetic Wheelchair Industry Life Cycle
- Historical Data and Forecast of Canada Nonmagnetic Wheelchair Market Revenues & Volume By Technology Type for the Period 2022-2032F
- Historical Data and Forecast of Canada Nonmagnetic Wheelchair Market Revenues & Volume By Below 100 kg for the Period 2022-2032F
- Historical Data and Forecast of Canada Nonmagnetic Wheelchair Market Revenues & Volume By 100 kg to 150 kg for the Period 2022-2032F
- Historical Data and Forecast of Canada Nonmagnetic Wheelchair Market Revenues & Volume By Above 150 kg for the Period 2022-2032F
- Historical Data and Forecast of Canada Nonmagnetic Wheelchair Market Revenues & Volume By Application Area for the Period 2022-2032F
- Historical Data and Forecast of Canada Nonmagnetic Wheelchair Market Revenues & Volume By Hospitals for the Period 2022-2032F
- Historical Data and Forecast of Canada Nonmagnetic Wheelchair Market Revenues & Volume By Orthopedic Centers for the Period 2022-2032F
- Historical Data and Forecast of Canada Nonmagnetic Wheelchair Market Revenues & Volume By Ambulatory Surgical Centers for the Period 2022-2032F
- Historical Data and Forecast of Canada Nonmagnetic Wheelchair Market Revenues & Volume By End User for the Period 2022-2032F
- Historical Data and Forecast of Canada Nonmagnetic Wheelchair Market Revenues & Volume By Patients for the Period 2022-2032F
- Historical Data and Forecast of Canada Nonmagnetic Wheelchair Market Revenues & Volume By Elderly for the Period 2022-2032F
- Historical Data and Forecast of Canada Nonmagnetic Wheelchair Market Revenues & Volume By Disabled Individuals for the Period 2022-2032F
- Historical Data and Forecast of Canada Nonmagnetic Wheelchair Market Revenues & Volume By Product Type for the Period 2022-2032F
- Historical Data and Forecast of Canada Nonmagnetic Wheelchair Market Revenues & Volume By Manual for the Period 2022-2032F
- Historical Data and Forecast of Canada Nonmagnetic Wheelchair Market Revenues & Volume By Electric for the Period 2022-2032F
- Canada Nonmagnetic Wheelchair Import Export Trade Statistics
- Market Opportunity Assessment By Technology Type
- Market Opportunity Assessment By Application Area
- Market Opportunity Assessment By End User
- Market Opportunity Assessment By Product Type
- Canada Nonmagnetic Wheelchair Top Companies Market Share
- Canada Nonmagnetic Wheelchair Competitive Benchmarking By Technical and Operational Parameters
- Canada Nonmagnetic Wheelchair Company Profiles
- Canada Nonmagnetic Wheelchair Key Strategic Recommendations
Frequently Asked Questions About the Market Study (FAQs):
6Wresearch actively monitors the Canada Nonmagnetic Wheelchair Market and publishes its comprehensive annual report, highlighting emerging trends, growth drivers, revenue analysis, and forecast outlook. Our insights help businesses to make data-backed strategic decisions with ongoing market dynamics. Our analysts track relevent industries related to the Canada Nonmagnetic Wheelchair Market, allowing our clients with actionable intelligence and reliable forecasts tailored to emerging regional needs.
Yes, we provide customisation as per your requirements. To learn more, feel free to contact us on sales@6wresearch.com
1 Executive Summary |
2 Introduction |
2.1 Key Highlights of the Report |
2.2 Report Description |
2.3 Market Scope & Segmentation |
2.4 Research Methodology |
2.5 Assumptions |
3 Canada Nonmagnetic Wheelchair Market Overview |
3.1 Canada Country Macro Economic Indicators |
3.2 Canada Nonmagnetic Wheelchair Market Revenues & Volume, 2022 & 2032F |
3.3 Canada Nonmagnetic Wheelchair Market - Industry Life Cycle |
3.4 Canada Nonmagnetic Wheelchair Market - Porter's Five Forces |
3.5 Canada Nonmagnetic Wheelchair Market Revenues & Volume Share, By Technology Type, 2022 & 2032F |
3.6 Canada Nonmagnetic Wheelchair Market Revenues & Volume Share, By Application Area, 2022 & 2032F |
3.7 Canada Nonmagnetic Wheelchair Market Revenues & Volume Share, By End User, 2022 & 2032F |
3.8 Canada Nonmagnetic Wheelchair Market Revenues & Volume Share, By Product Type, 2022 & 2032F |
4 Canada Nonmagnetic Wheelchair Market Dynamics |
4.1 Impact Analysis |
4.2 Market Drivers |
4.2.1 Increasing awareness about the benefits of nonmagnetic wheelchairs for individuals with specific medical conditions |
4.2.2 Growing elderly population in Canada leading to higher demand for mobility aids such as nonmagnetic wheelchairs |
4.2.3 Technological advancements in nonmagnetic wheelchair design and materials improving comfort and functionality |
4.3 Market Restraints |
4.3.1 High cost associated with nonmagnetic wheelchairs compared to traditional wheelchairs |
4.3.2 Limited reimbursement coverage for nonmagnetic wheelchairs under certain healthcare plans |
5 Canada Nonmagnetic Wheelchair Market Trends |
6 Canada Nonmagnetic Wheelchair Market, By Types |
6.1 Canada Nonmagnetic Wheelchair Market, By Technology Type |
6.1.1 Overview and Analysis |
6.1.2 Canada Nonmagnetic Wheelchair Market Revenues & Volume, By Technology Type, 2022 - 2032F |
6.1.3 Canada Nonmagnetic Wheelchair Market Revenues & Volume, By Below 100 kg, 2022 - 2032F |
6.1.4 Canada Nonmagnetic Wheelchair Market Revenues & Volume, By 100 kg to 150 kg, 2022 - 2032F |
6.1.5 Canada Nonmagnetic Wheelchair Market Revenues & Volume, By Above 150 kg, 2022 - 2032F |
6.2 Canada Nonmagnetic Wheelchair Market, By Application Area |
6.2.1 Overview and Analysis |
6.2.2 Canada Nonmagnetic Wheelchair Market Revenues & Volume, By Hospitals, 2022 - 2032F |
6.2.3 Canada Nonmagnetic Wheelchair Market Revenues & Volume, By Orthopedic Centers, 2022 - 2032F |
6.2.4 Canada Nonmagnetic Wheelchair Market Revenues & Volume, By Ambulatory Surgical Centers, 2022 - 2032F |
6.3 Canada Nonmagnetic Wheelchair Market, By End User |
6.3.1 Overview and Analysis |
6.3.2 Canada Nonmagnetic Wheelchair Market Revenues & Volume, By Patients, 2022 - 2032F |
6.3.3 Canada Nonmagnetic Wheelchair Market Revenues & Volume, By Elderly, 2022 - 2032F |
6.3.4 Canada Nonmagnetic Wheelchair Market Revenues & Volume, By Disabled Individuals, 2022 - 2032F |
6.4 Canada Nonmagnetic Wheelchair Market, By Product Type |
6.4.1 Overview and Analysis |
6.4.2 Canada Nonmagnetic Wheelchair Market Revenues & Volume, By Manual, 2022 - 2032F |
6.4.3 Canada Nonmagnetic Wheelchair Market Revenues & Volume, By Electric, 2022 - 2032F |
7 Canada Nonmagnetic Wheelchair Market Import-Export Trade Statistics |
7.1 Canada Nonmagnetic Wheelchair Market Export to Major Countries |
7.2 Canada Nonmagnetic Wheelchair Market Imports from Major Countries |
8 Canada Nonmagnetic Wheelchair Market Key Performance Indicators |
8.1 Percentage of healthcare facilities offering nonmagnetic wheelchairs as part of their services |
8.2 Number of research studies or clinical trials supporting the efficacy of nonmagnetic wheelchairs for various medical conditions |
8.3 Rate of adoption of nonmagnetic wheelchairs by healthcare professionals and caregivers |
8.4 Average waiting time for acquiring a nonmagnetic wheelchair in Canada |
8.5 Percentage of individuals with mobility issues using nonmagnetic wheelchairs as their primary mobility aid |
9 Canada Nonmagnetic Wheelchair Market - Opportunity Assessment |
9.1 Canada Nonmagnetic Wheelchair Market Opportunity Assessment, By Technology Type, 2022 & 2032F |
9.2 Canada Nonmagnetic Wheelchair Market Opportunity Assessment, By Application Area, 2022 & 2032F |
9.3 Canada Nonmagnetic Wheelchair Market Opportunity Assessment, By End User, 2022 & 2032F |
9.4 Canada Nonmagnetic Wheelchair Market Opportunity Assessment, By Product Type, 2022 & 2032F |
10 Canada Nonmagnetic Wheelchair Market - Competitive Landscape |
10.1 Canada Nonmagnetic Wheelchair Market Revenue Share, By Companies, 2025 |
10.2 Canada Nonmagnetic Wheelchair Market Competitive Benchmarking, By Operating and Technical Parameters |
11 Company Profiles |
12 Recommendations |
13 Disclaimer |
Export potential assessment - trade Analytics for 2030
Export potential enables firms to identify high-growth global markets with greater confidence by combining advanced trade intelligence with a structured quantitative methodology. The framework analyzes emerging demand trends and country-level import patterns while integrating macroeconomic and trade datasets such as GDP and population forecasts, bilateral import–export flows, tariff structures, elasticity differentials between developed and developing economies, geographic distance, and import demand projections. Using weighted trade values from 2020–2024 as the base period to project country-to-country export potential for 2030, these inputs are operationalized through calculated drivers such as gravity model parameters, tariff impact factors, and projected GDP per-capita growth. Through an analysis of hidden potentials, demand hotspots, and market conditions that are most favorable to success, this method enables firms to focus on target countries, maximize returns, and global expansion with data, backed by accuracy.
By factoring in the projected importer demand gap that is currently unmet and could be potential opportunity, it identifies the potential for the Exporter (Country) among 190 countries, against the general trade analysis, which identifies the biggest importer or exporter.
To discover high-growth global markets and optimize your business strategy:
Click Here
Pricing
- Single User License$ 1,995
- Department License$ 2,400
- Site License$ 3,120
- Global License$ 3,795

Search
Thought Leadership and Analyst Meet


Our Clients
Latest Reports
- India Ultrasonic Smart Water Meter Market (2026-2032) | Outlook, Competition, Drivers, Trends, Demand, Competitive, Strategic Insights, Companies, Challenges, Strategy, Consumer Insights, Analysis, Opportunities, Growth, Size, Share, Industry, Revenue, Segments, Value, Segmentation, Supply, Forecast, Restraints,
- India Electromagnetic Bulk Flow Meter Market (2026-2032) | Analysis, Challenges, Strategic Insights, Supply, Forecast, Growth, Share, Consumer Insights, Competitive, Value, Outlook, Size & Demand,
- India Battery Powered Bulk Flow Meter Market (2026-2032) | Outlook, Analysis, Competitive Landscape, Growth, Size, Trends, Value, Revenue, Companies, Segmentation, Share & Forecast
- Bosnia and Herzegovina Fuel-Efficient Winglets Market (2026-2032) | Growth, Competition, Strategy, Restraints, Trends, Challenges, segmentation, Value, Outlook, Investment Opportunities, Analysis, Revenue, Companies, Insights, Pricing, Size, Drivers, Demand, Share, Forecast
- Canada Cloud CFD Market (2026-2032) | Size & Revenue, Industry, Growth, Competitive Landscape, Forecast, Segmentation, Value, Outlook, Trends, Share, Analysis, Companies
- Taiwan Food Delivery Platform Market (2026-2032) | Companies, Outlook, Analysis, Trends, Value, Revenue, Segmentation, Share, Forecast, Competitive Landscape, Growth, Size & Forecast
- United Kingdom (UK) Long-term Care Insurance Market (2026-2032) | Growth, Share, Consumer Insights, Drivers, Opportunities, Competition, Pricing Analysis, Segments, Restraints, Companies, Competitive, Value, Outlook, Size, Demand, Analysis, Challenges, Strategic Insights, Investment Trends, Revenue, Trends, Supply, Forecast
- United Kingdom (UK) Long Term Care Market (2026-2032) | Companies, Outlook, Analysis, Trends, Value, Revenue, Segmentation, Share, Forecast, Competitive Landscape, Growth, Size & Forecast
- Iraq Insulation and Waterproofing Market (2026-2032) | Outlook, Drivers, Growth, Size, Share, Industry, Revenue, Trends, Demand, Competitive, Strategic Insights, Opportunities, Segments, Companies, Challenges, Strategy, Consumer Insights, Analysis, Investment Trends, Value, Segmentation, Forecast, Restraints
- India Switchgear Market Outlook (2026-2032) | Size, Share, Trends, Growth, Revenue, Forecast, Analysis, Value, Outlook
Industry Events and Analyst Meet

HIMTEX 2026

India Refining Summit 2026

India EV Show 2026

EV tech India Expo 2026

Auto Tech Asia 2026
Whitepaper
- Middle East & Africa Commercial Security Market Click here to view more.
- Middle East & Africa Fire Safety Systems & Equipment Market Click here to view more.
- GCC Drone Market Click here to view more.
- Middle East Lighting Fixture Market Click here to view more.
- GCC Physical & Perimeter Security Market Click here to view more.
6WResearch In News
- Doha a strategic location for EV manufacturing hub: IPA Qatar
- Demand for luxury TVs surging in the GCC, says Samsung
- Empowering Growth: The Thriving Journey of Bangladesh’s Cable Industry
- Demand for luxury TVs surging in the GCC, says Samsung
- Video call with a traditional healer? Once unthinkable, it’s now common in South Africa
- Intelligent Buildings To Smooth GCC’s Path To Net Zero