Cape Verde Connector Market (2025-2031) | Revenue, Segmentation, Companies, Growth, Size, Value, Industry, Outlook, Analysis, Share, Forecast & Trends
Market Forecast By Product (PCB Connectors, IO Connectors, Circular Connectors, Fiber Optic Connectors, RF Coaxial Connectors, Others), By End Use (Telecom, Transportation, Automotive, Industrial, Computer & Peripherals, Others) And Competitive Landscape
| Product Code: ETC5176110 | Publication Date: Nov 2023 | Updated Date: Nov 2025 | Product Type: Market Research Report | |
| Publisher: 6Wresearch | Author: Bhawna Singh | No. of Pages: 60 | No. of Figures: 30 | No. of Tables: 5 |
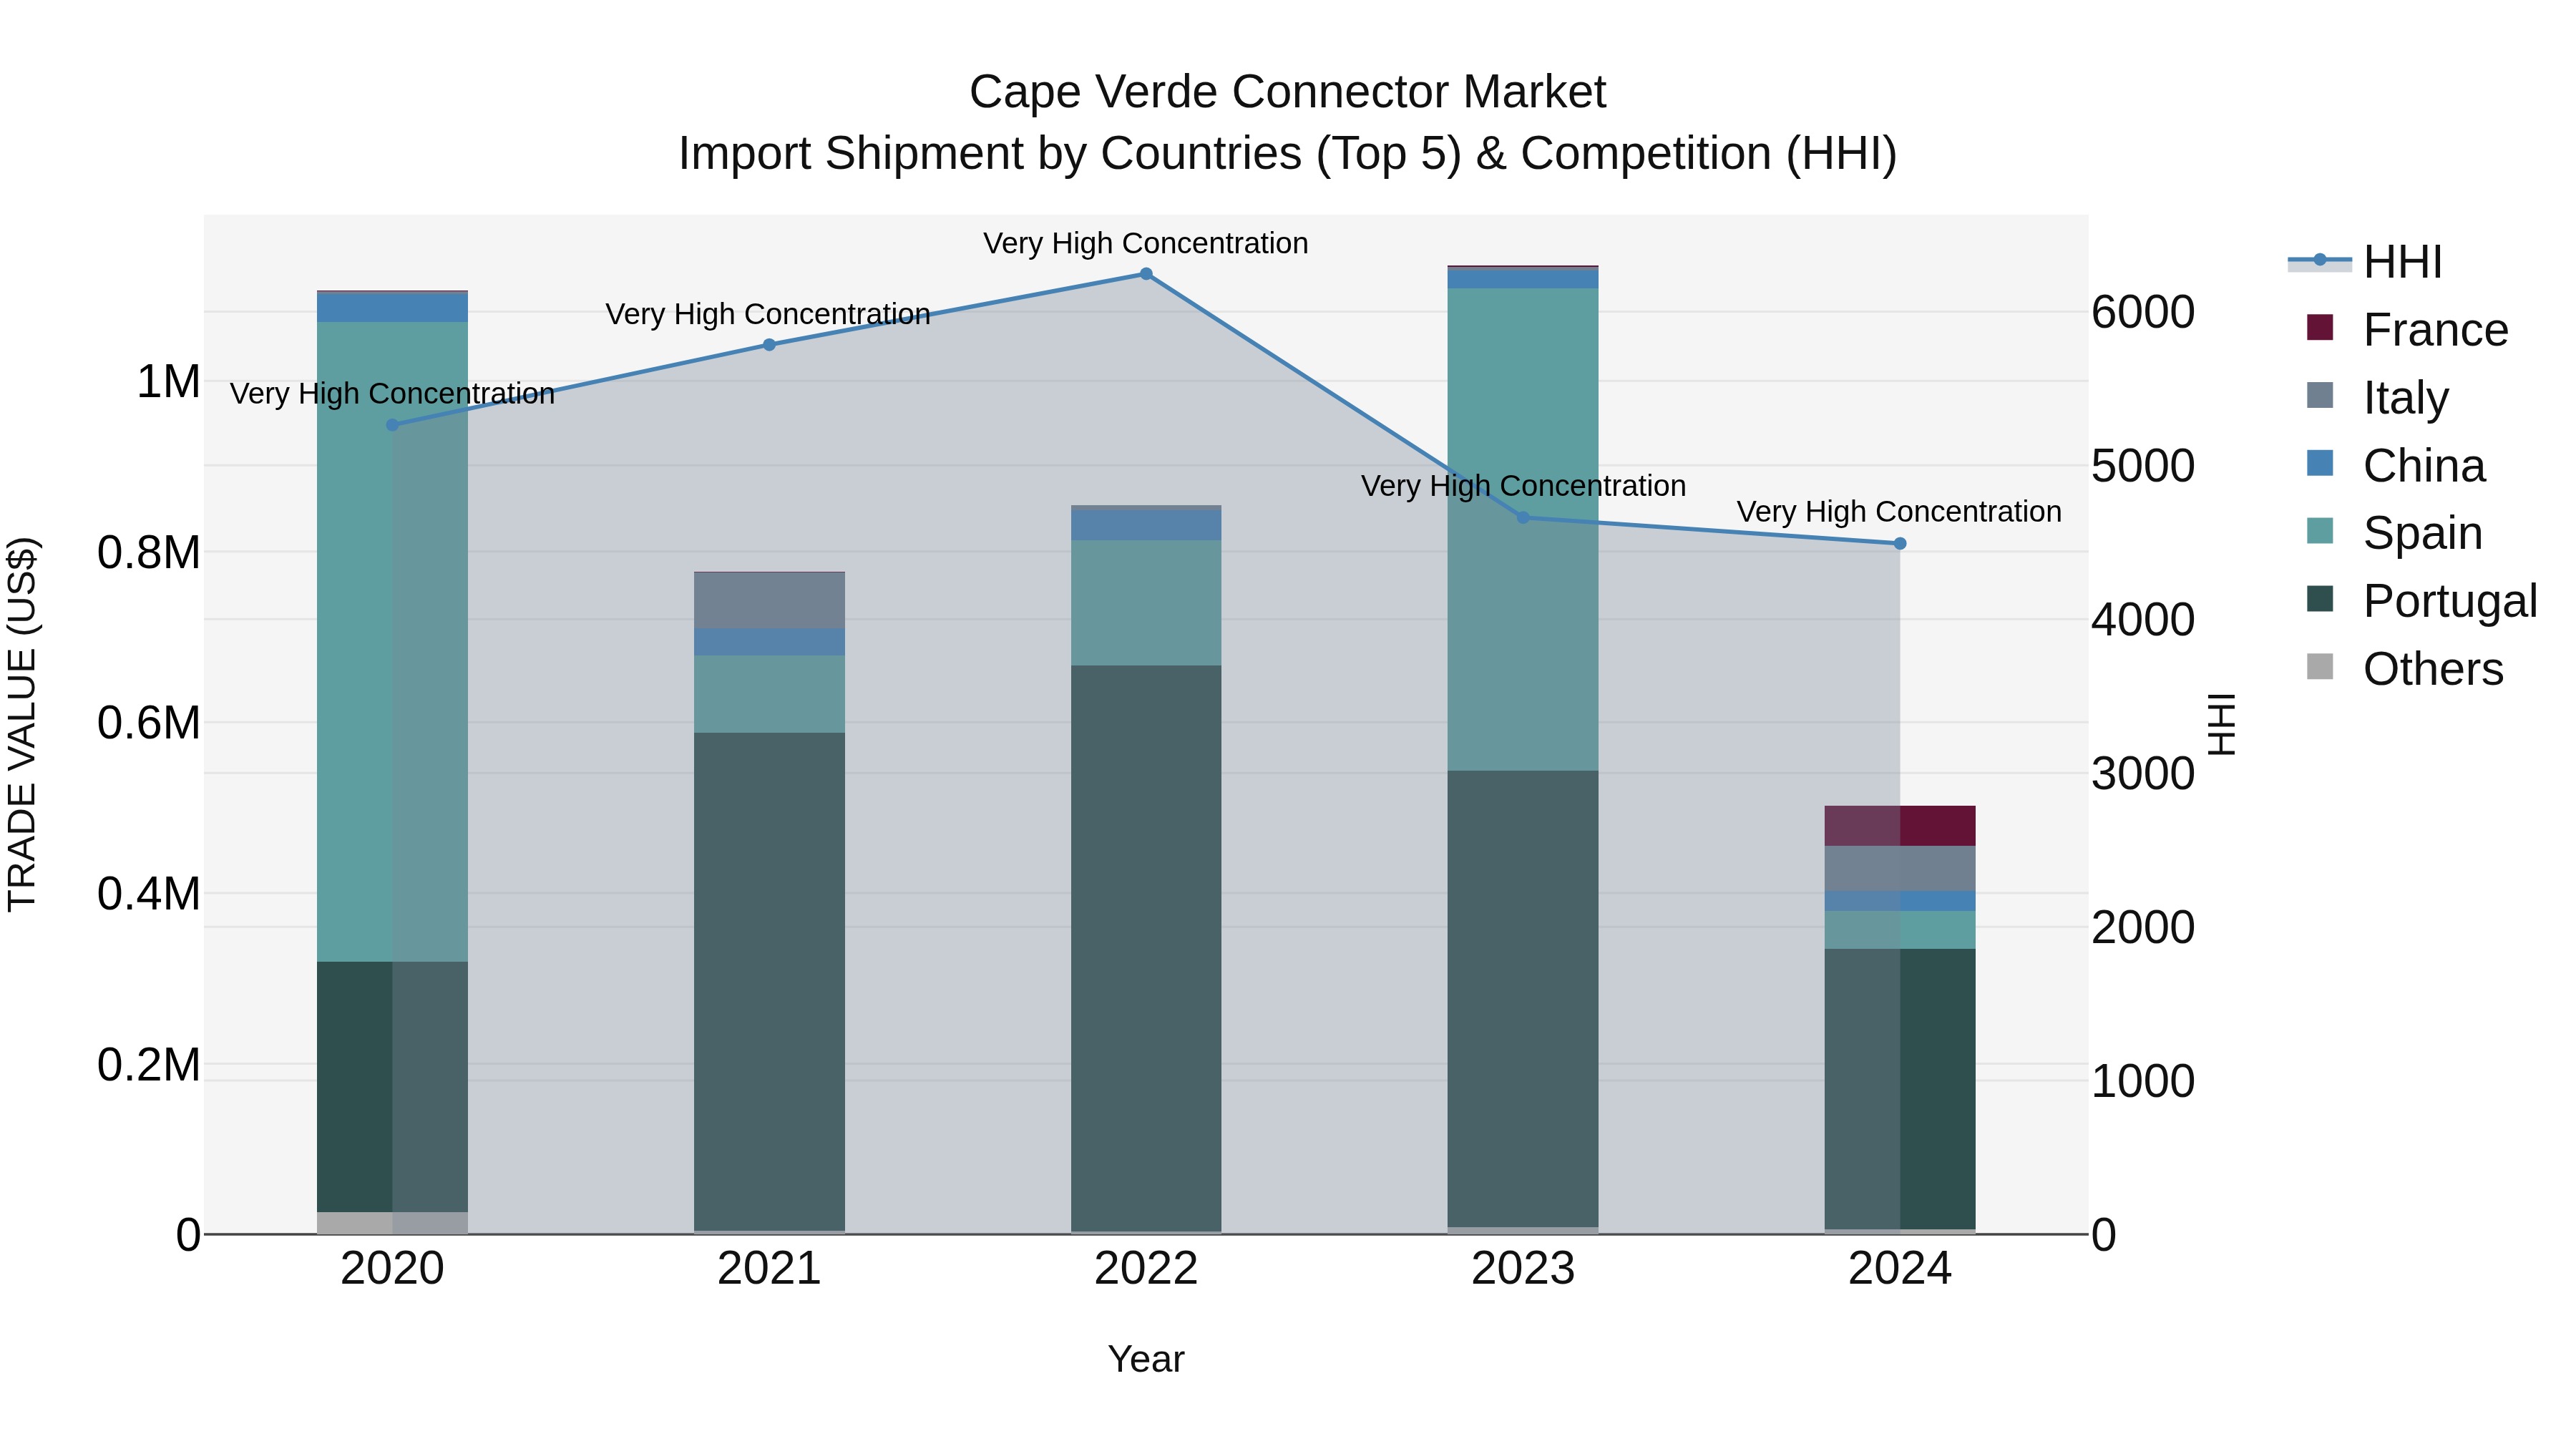
Cape Verde Connector Market: Top 5 Importing Countries and Market Competition (HHI) Analysis
In 2024, Cape Verde continued to heavily rely on imports from top exporting countries including Portugal, Italy, France, Spain, and China. The market remained highly concentrated, with the Herfindahl-Hirschman Index (HHI) indicating a very high level of concentration. The compound annual growth rate (CAGR) for 2020-2024 was notably negative at -17.9%, with a significant decline in growth rate from 2023 to 2024 at -55.74%. These figures suggest a challenging market environment for connector import shipments to Cape Verde, highlighting the need for strategic adaptation and market diversification strategies.
Connector Market: Cabo Verde vs Top 5 Major Economies in 2027 (Africa)
In the Africa region, the Connector market in Cabo Verde is projected to expand at a stable growth rate of 2.24% by 2027. The largest economy is Egypt, followed by South Africa, Ethiopia, Algeria and Nigeria.

Cape Verde Connector Market Overview
The Cape Verde Connector Market encompasses various types of connectors used in electronic devices, machinery, and infrastructure projects. The market is driven by the growing demand for electronic devices and the expansion of infrastructure projects. Key factors include the increasing adoption of technology in various sectors and the need for reliable connections in electronics and communication systems.
Drivers of the market
The Cape Verde connector market benefits from the expanding electronic and automotive industries in the region. The demand for connectors is driven by the need for reliable and efficient connections in various applications, including telecommunications, consumer electronics, and transportation. With ongoing infrastructural developments and the growth of the technology sector, the need for high-quality connectors that support advanced systems is increasing.
Challenges of the market
The Cape Verde Connector Market struggles with challenges such as high import costs and limited local manufacturing capabilities. The small size of the market and relatively low volume of demand can make it less attractive to global suppliers, resulting in fewer options and higher prices for consumers. Supply chain issues and the need for specialized connectors for various applications further complicate market dynamics. Additionally, there is a need for skilled workforce training and infrastructure development to support the growth of this market.
Government Policy of the market
Policies affecting the Connector Market in Cape Verde are likely influenced by broader trade and industrial regulations. The governments focus on improving technological infrastructure and facilitating trade may support the growth of the connector market. This includes policies aimed at enhancing the import and export of electronic components and fostering local manufacturing capabilities.
Key Highlights of the Report:
- Cape Verde Connector Market Outlook
- Market Size of Cape Verde Connector Market, 2024
- Forecast of Cape Verde Connector Market, 2031
- Historical Data and Forecast of Cape Verde Connector Revenues & Volume for the Period 2021-2031
- Cape Verde Connector Market Trend Evolution
- Cape Verde Connector Market Drivers and Challenges
- Cape Verde Connector Price Trends
- Cape Verde Connector Porter`s Five Forces
- Cape Verde Connector Industry Life Cycle
- Historical Data and Forecast of Cape Verde Connector Market Revenues & Volume By Product for the Period 2021-2031
- Historical Data and Forecast of Cape Verde Connector Market Revenues & Volume By PCB Connectors for the Period 2021-2031
- Historical Data and Forecast of Cape Verde Connector Market Revenues & Volume By IO Connectors for the Period 2021-2031
- Historical Data and Forecast of Cape Verde Connector Market Revenues & Volume By Circular Connectors for the Period 2021-2031
- Historical Data and Forecast of Cape Verde Connector Market Revenues & Volume By Fiber Optic Connectors for the Period 2021-2031
- Historical Data and Forecast of Cape Verde Connector Market Revenues & Volume By RF Coaxial Connectors for the Period 2021-2031
- Historical Data and Forecast of Cape Verde Connector Market Revenues & Volume By Others for the Period 2021-2031
- Historical Data and Forecast of Cape Verde Connector Market Revenues & Volume By End Use for the Period 2021-2031
- Historical Data and Forecast of Cape Verde Connector Market Revenues & Volume By Telecom for the Period 2021-2031
- Historical Data and Forecast of Cape Verde Connector Market Revenues & Volume By Transportation for the Period 2021-2031
- Historical Data and Forecast of Cape Verde Connector Market Revenues & Volume By Automotive for the Period 2021-2031
- Historical Data and Forecast of Cape Verde Connector Market Revenues & Volume By Industrial for the Period 2021-2031
- Historical Data and Forecast of Cape Verde Connector Market Revenues & Volume By Computer & Peripherals for the Period 2021-2031
- Historical Data and Forecast of Cape Verde Connector Market Revenues & Volume By Others for the Period 2021-2031
- Cape Verde Connector Import Export Trade Statistics
- Market Opportunity Assessment By Product
- Market Opportunity Assessment By End Use
- Cape Verde Connector Top Companies Market Share
- Cape Verde Connector Competitive Benchmarking By Technical and Operational Parameters
- Cape Verde Connector Company Profiles
- Cape Verde Connector Key Strategic Recommendations
Frequently Asked Questions About the Market Study (FAQs):
6Wresearch actively monitors the Cape Verde Connector Market and publishes its comprehensive annual report, highlighting emerging trends, growth drivers, revenue analysis, and forecast outlook. Our insights help businesses to make data-backed strategic decisions with ongoing market dynamics. Our analysts track relevent industries related to the Cape Verde Connector Market, allowing our clients with actionable intelligence and reliable forecasts tailored to emerging regional needs.
Yes, we provide customisation as per your requirements. To learn more, feel free to contact us on sales@6wresearch.com
1 Executive Summary |
2 Introduction |
2.1 Key Highlights of the Report |
2.2 Report Description |
2.3 Market Scope & Segmentation |
2.4 Research Methodology |
2.5 Assumptions |
3 Cape Verde Connector Market Overview |
3.1 Cape Verde Country Macro Economic Indicators |
3.2 Cape Verde Connector Market Revenues & Volume, 2021 & 2031F |
3.3 Cape Verde Connector Market - Industry Life Cycle |
3.4 Cape Verde Connector Market - Porter's Five Forces |
3.5 Cape Verde Connector Market Revenues & Volume Share, By Product, 2021 & 2031F |
3.6 Cape Verde Connector Market Revenues & Volume Share, By End Use, 2021 & 2031F |
4 Cape Verde Connector Market Dynamics |
4.1 Impact Analysis |
4.2 Market Drivers |
4.2.1 Growing demand for high-speed internet services in Cape Verde |
4.2.2 Increasing adoption of advanced technologies such as IoT and cloud computing in the region |
4.2.3 Government initiatives to improve infrastructure and connectivity in Cape Verde |
4.3 Market Restraints |
4.3.1 Limited technical expertise and skilled workforce in the connector market |
4.3.2 Volatility in raw material prices affecting production costs |
4.3.3 Competition from alternative connectivity solutions like wireless technologies |
5 Cape Verde Connector Market Trends |
6 Cape Verde Connector Market Segmentations |
6.1 Cape Verde Connector Market, By Product |
6.1.1 Overview and Analysis |
6.1.2 Cape Verde Connector Market Revenues & Volume, By PCB Connectors, 2021-2031F |
6.1.3 Cape Verde Connector Market Revenues & Volume, By IO Connectors, 2021-2031F |
6.1.4 Cape Verde Connector Market Revenues & Volume, By Circular Connectors, 2021-2031F |
6.1.5 Cape Verde Connector Market Revenues & Volume, By Fiber Optic Connectors, 2021-2031F |
6.1.6 Cape Verde Connector Market Revenues & Volume, By RF Coaxial Connectors, 2021-2031F |
6.1.7 Cape Verde Connector Market Revenues & Volume, By Others, 2021-2031F |
6.2 Cape Verde Connector Market, By End Use |
6.2.1 Overview and Analysis |
6.2.2 Cape Verde Connector Market Revenues & Volume, By Telecom, 2021-2031F |
6.2.3 Cape Verde Connector Market Revenues & Volume, By Transportation, 2021-2031F |
6.2.4 Cape Verde Connector Market Revenues & Volume, By Automotive, 2021-2031F |
6.2.5 Cape Verde Connector Market Revenues & Volume, By Industrial, 2021-2031F |
6.2.6 Cape Verde Connector Market Revenues & Volume, By Computer & Peripherals, 2021-2031F |
6.2.7 Cape Verde Connector Market Revenues & Volume, By Others, 2021-2031F |
7 Cape Verde Connector Market Import-Export Trade Statistics |
7.1 Cape Verde Connector Market Export to Major Countries |
7.2 Cape Verde Connector Market Imports from Major Countries |
8 Cape Verde Connector Market Key Performance Indicators |
8.1 Average revenue per user (ARPU) for connector services in Cape Verde |
8.2 Percentage of households or businesses with access to high-speed internet in the region |
8.3 Number of new infrastructure projects or developments in Cape Verde that require connector solutions |
8.4 Rate of adoption of advanced technologies in Cape Verde that rely on connectors |
8.5 Customer satisfaction and retention rates for connector services in the market |
9 Cape Verde Connector Market - Opportunity Assessment |
9.1 Cape Verde Connector Market Opportunity Assessment, By Product, 2021 & 2031F |
9.2 Cape Verde Connector Market Opportunity Assessment, By End Use, 2021 & 2031F |
10 Cape Verde Connector Market - Competitive Landscape |
10.1 Cape Verde Connector Market Revenue Share, By Companies, 2024 |
10.2 Cape Verde Connector Market Competitive Benchmarking, By Operating and Technical Parameters |
11 Company Profiles |
12 Recommendations | 13 Disclaimer |
Global Go To Market Strategy - 2030
Export potential enables firms to identify high-growth global markets with greater confidence by combining advanced trade intelligence with a structured quantitative methodology. The framework analyzes emerging demand trends and country-level import patterns while integrating macroeconomic and trade datasets such as GDP and population forecasts, bilateral import–export flows, tariff structures, elasticity differentials between developed and developing economies, geographic distance, and import demand projections. Using weighted trade values from 2020–2024 as the base period to project country-to-country export potential for 2030, these inputs are operationalized through calculated drivers such as gravity model parameters, tariff impact factors, and projected GDP per-capita growth. Through an analysis of hidden potentials, demand hotspots, and market conditions that are most favorable to success, this method enables firms to focus on target countries, maximize returns, and global expansion with data, backed by accuracy.
By factoring in the projected importer demand gap that is currently unmet and could be potential opportunity, it identifies the potential for the Exporter (Country) among 190 countries, against the general trade analysis, which identifies the biggest importer or exporter.
To discover high-growth global markets and optimize your business strategy:
Click Here
Pricing
- Single User License$ 1,995
- Department License$ 2,400
- Site License$ 3,120
- Global License$ 3,795

Leadership Perspectives from Industry Events
Search
Thought Leadership and Analyst Meet


Our Clients
6WResearch In News
- India Export Attractiveness Tracker 2026
- India Air Conditioner Market Set for Strong Rebound in 2026 After Weather-Led Correction and GST-Driven Recovery: 6Wresearch
- ADAS in India: How Automatic Emergency Braking, Blind Spot Detection & Driver Monitoring are Transforming Road Safety
- Doha a strategic location for EV manufacturing hub: IPA Qatar
- Demand for luxury TVs surging in the GCC, says Samsung
- Empowering Growth: The Thriving Journey of Bangladesh’s Cable Industry
Latest Reports
- Nicaragua RPG Gaming Market (2026-2032)
- New Zealand RPG Gaming Market (2026-2032)
- Netherlands RPG Gaming Market (2026-2032)
- Nauru RPG Gaming Market (2026-2032)
- Namibia RPG Gaming Market (2026-2032)
- Mozambique RPG Gaming Market (2026-2032)
- Montenegro RPG Gaming Market (2026-2032)
- Mongolia RPG Gaming Market (2026-2032)
- Monaco RPG Gaming Market (2026-2032)
- Micronesia RPG Gaming Market (2026-2032)
Industry Events and Analyst Meet

EV India Expo 2026

HIMTEX 2026

India Refining Summit 2026

India EV Show 2026

EV tech India Expo 2026
Whitepaper
- Middle East & Africa Commercial Security Market Click here to view more.
- Middle East & Africa Fire Safety Systems & Equipment Market Click here to view more.
- GCC Drone Market Click here to view more.
- Middle East Lighting Fixture Market Click here to view more.
- GCC Physical & Perimeter Security Market Click here to view more.