Cape Verde Transparent Display Market (2025-2031) | Share, Analysis, Companies, Value, Growth, Forecast, Trends, Outlook, Segmentation, Industry, Revenue & Size
Market Forecast By Product (HUD, HMD, Digital Signage, Smart Appliance), By Vertical (Consumer, Retail & Hospitality, Sports and Entertainment, Aerospace and Defense, Healthcare, Automotive & Transportation, Industrial, Others), By Product (HMD, HUD, Digital Signage, Smart Appliance), By Technology (LCD, OLED, Others (e-paper display, and DLP)), By Resolution (Ultra HD, Full HD, HD, Others (VGA, WVGA, XGA, WXGA, and SXGA among others)), By Display Size (Small and Medium, Large) And Competitive Landscape
| Product Code: ETC5594509 | Publication Date: Nov 2023 | Updated Date: Nov 2025 | Product Type: Market Research Report | |
| Publisher: 6Wresearch | Author: Vasudha | No. of Pages: 60 | No. of Figures: 30 | No. of Tables: 5 |
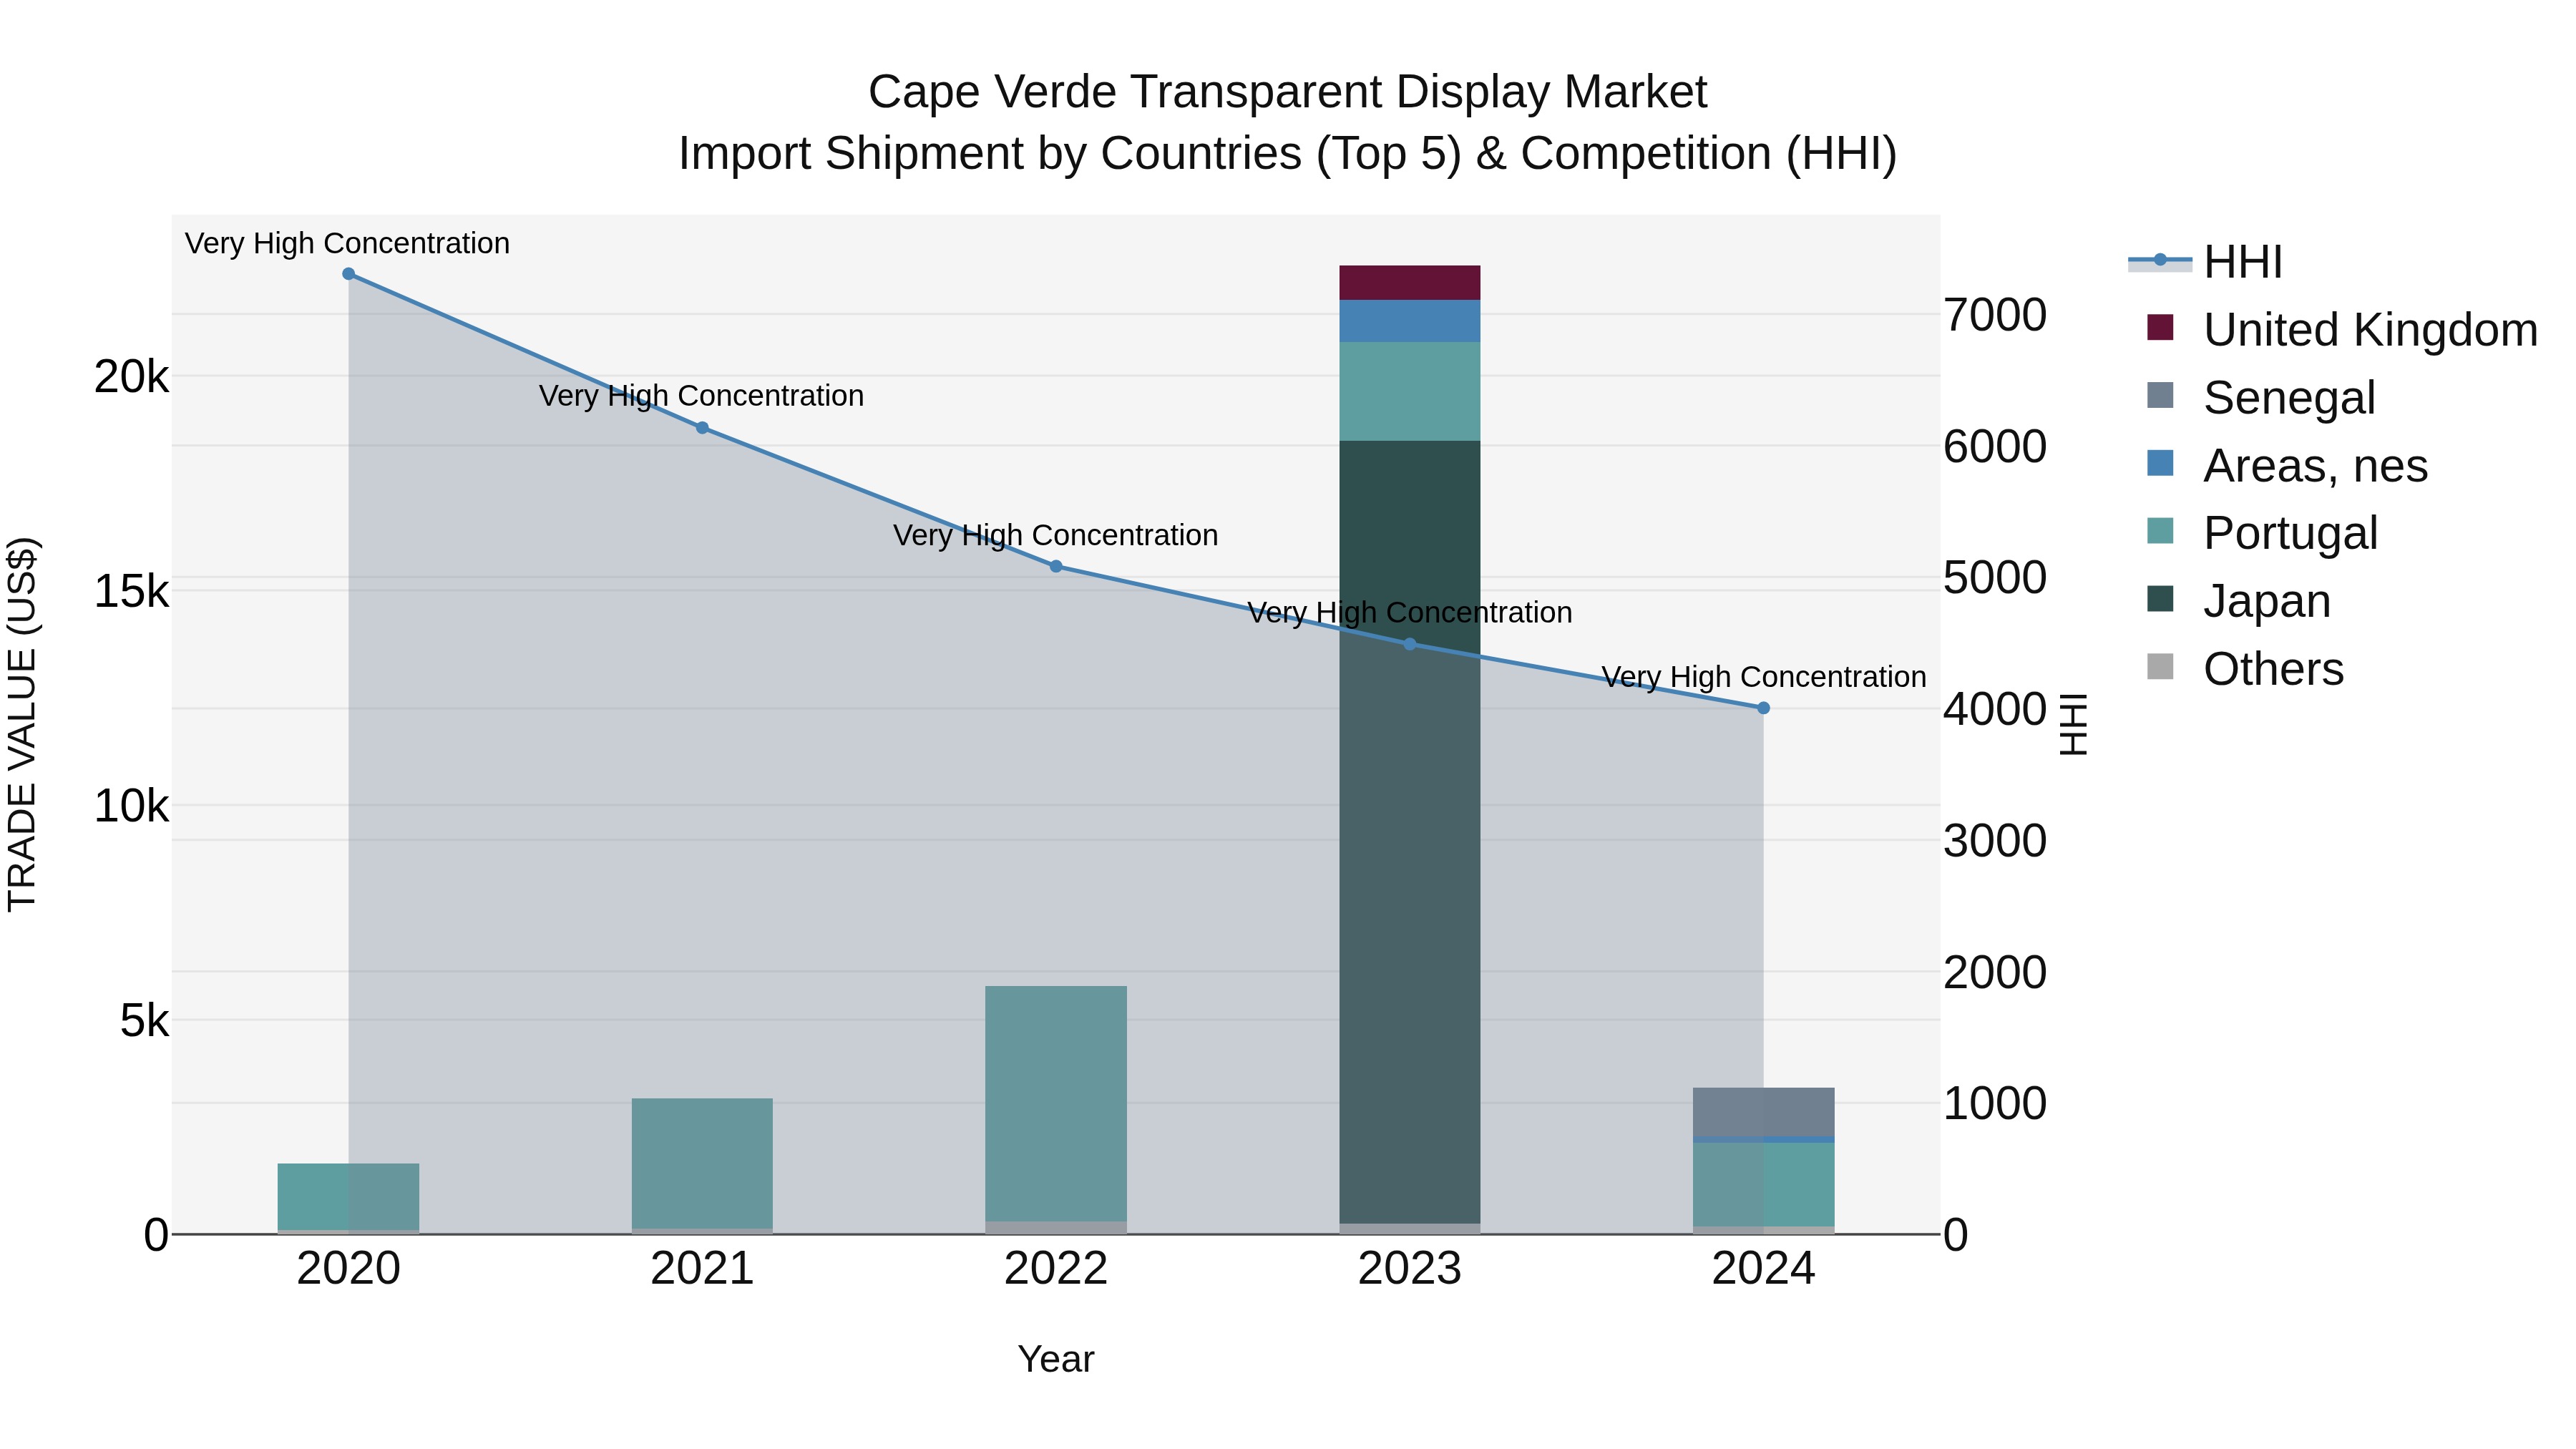
Cape Verde Transparent Display Market: Top 5 Importing Countries and Market Competition (HHI) Analysis
In 2024, Cape Verde continues to see a high concentration of transparent display imports, with top exporting countries being Portugal, Senegal, China, Areas, nes, and Germany. Despite a significant decline in growth rate from 2023 to 2024, the compound annual growth rate (CAGR) from 2020 to 2024 remains impressive at 20.02%. This indicates a strong market for transparent display imports in Cape Verde, with key players contributing to the industry`s growth and sustainability.
Cape Verde Transparent Display Market Overview
Cape Verdes transparent display market involves technologies that enable the creation of displays with transparent screens, used in applications such as advertising, augmented reality, and smart windows. As innovative display technologies gain popularity and the demand for interactive and aesthetically pleasing solutions increases, the market for transparent displays is expected to expand.
Drivers of the market
The transparent display market in Cape Verde is influenced by the growing demand for innovative display technologies in retail, advertising, and automotive applications. The need for displays that offer high transparency and interactivity supports the market, particularly in sectors focusing on enhancing customer engagement and experience.
Challenges of the market
Cape Verde`s transparent display market is constrained by limited demand from consumer electronics, retail, and advertising sectors. High import costs and the lack of local production capabilities further restrict market growth. Additionally, there is insufficient awareness about the benefits of transparent displays in creating innovative and interactive visual experiences, which hinders market adoption and reduces the competitiveness of local providers.
Government Policy of the market
Government policies in Cape Verde related to the transparent display market focus on supporting the growth of the electronics and technology sectors. The government promotes the adoption of transparent display technologies through tax incentives and subsidies for companies that develop and deploy these technologies. Regulations ensure the quality and performance of transparent displays. Despite supportive policies, the market faces challenges such as high technology costs and the need for continuous innovation, requiring government support for investment in technology and infrastructure.
Key Highlights of the Report:
- Cape Verde Transparent Display Market Outlook
- Market Size of Cape Verde Transparent Display Market, 2024
- Forecast of Cape Verde Transparent Display Market, 2031
- Historical Data and Forecast of Cape Verde Transparent Display Revenues & Volume for the Period 2021-2031
- Cape Verde Transparent Display Market Trend Evolution
- Cape Verde Transparent Display Market Drivers and Challenges
- Cape Verde Transparent Display Price Trends
- Cape Verde Transparent Display Porter`s Five Forces
- Cape Verde Transparent Display Industry Life Cycle
- Historical Data and Forecast of Cape Verde Transparent Display Market Revenues & Volume By Product for the Period 2021-2031
- Historical Data and Forecast of Cape Verde Transparent Display Market Revenues & Volume By HUD for the Period 2021-2031
- Historical Data and Forecast of Cape Verde Transparent Display Market Revenues & Volume By HMD for the Period 2021-2031
- Historical Data and Forecast of Cape Verde Transparent Display Market Revenues & Volume By Digital Signage for the Period 2021-2031
- Historical Data and Forecast of Cape Verde Transparent Display Market Revenues & Volume By Smart Appliance for the Period 2021-2031
- Historical Data and Forecast of Cape Verde Transparent Display Market Revenues & Volume By Vertical for the Period 2021-2031
- Historical Data and Forecast of Cape Verde Transparent Display Market Revenues & Volume By Consumer for the Period 2021-2031
- Historical Data and Forecast of Cape Verde Transparent Display Market Revenues & Volume By Retail & Hospitality for the Period 2021-2031
- Historical Data and Forecast of Cape Verde Transparent Display Market Revenues & Volume By Sports and Entertainment for the Period 2021-2031
- Historical Data and Forecast of Cape Verde Transparent Display Market Revenues & Volume By Aerospace and Defense for the Period 2021-2031
- Historical Data and Forecast of Cape Verde Transparent Display Market Revenues & Volume By Healthcare for the Period 2021-2031
- Historical Data and Forecast of Cape Verde Transparent Display Market Revenues & Volume By Automotive & Transportation for the Period 2021-2031
- Historical Data and Forecast of Cape Verde Transparent Display Market Revenues & Volume By Industrial for the Period 2021-2031
- Historical Data and Forecast of Cape Verde Transparent Display Market Revenues & Volume By Others for the Period 2021-2031
- Historical Data and Forecast of Cape Verde Transparent Display Market Revenues & Volume By Product for the Period 2021-2031
- Historical Data and Forecast of Cape Verde Transparent Display Market Revenues & Volume By HMD for the Period 2021-2031
- Historical Data and Forecast of Cape Verde Transparent Display Market Revenues & Volume By HUD for the Period 2021-2031
- Historical Data and Forecast of Cape Verde Transparent Display Market Revenues & Volume By Digital Signage for the Period 2021-2031
- Historical Data and Forecast of Cape Verde Transparent Display Market Revenues & Volume By Smart Appliance for the Period 2021-2031
- Historical Data and Forecast of Cape Verde Transparent Display Market Revenues & Volume By Technology for the Period 2021-2031
- Historical Data and Forecast of Cape Verde Transparent Display Market Revenues & Volume By LCD for the Period 2021-2031
- Historical Data and Forecast of Cape Verde Transparent Display Market Revenues & Volume By OLED for the Period 2021-2031
- Historical Data and Forecast of Cape Verde Transparent Display Market Revenues & Volume By Others (e-paper display, and DLP) for the Period 2021-2031
- Historical Data and Forecast of Cape Verde Transparent Display Market Revenues & Volume By Resolution for the Period 2021-2031
- Historical Data and Forecast of Cape Verde Transparent Display Market Revenues & Volume By Ultra HD for the Period 2021-2031
- Historical Data and Forecast of Cape Verde Transparent Display Market Revenues & Volume By Full HD for the Period 2021-2031
- Historical Data and Forecast of Cape Verde Transparent Display Market Revenues & Volume By HD for the Period 2021-2031
- Historical Data and Forecast of Cape Verde Transparent Display Market Revenues & Volume By Others (VGA, WVGA, XGA, WXGA, and SXGA among others) for the Period 2021-2031
- Historical Data and Forecast of Cape Verde Transparent Display Market Revenues & Volume By Display Size for the Period 2021-2031
- Historical Data and Forecast of Cape Verde Transparent Display Market Revenues & Volume By Small and Medium for the Period 2021-2031
- Historical Data and Forecast of Cape Verde Transparent Display Market Revenues & Volume By Large for the Period 2021-2031
- Cape Verde Transparent Display Import Export Trade Statistics
- Market Opportunity Assessment By Product
- Market Opportunity Assessment By Vertical
- Market Opportunity Assessment By Product
- Market Opportunity Assessment By Technology
- Market Opportunity Assessment By Resolution
- Market Opportunity Assessment By Display Size
- Cape Verde Transparent Display Top Companies Market Share
- Cape Verde Transparent Display Competitive Benchmarking By Technical and Operational Parameters
- Cape Verde Transparent Display Company Profiles
- Cape Verde Transparent Display Key Strategic Recommendations
Frequently Asked Questions About the Market Study (FAQs):
6Wresearch actively monitors the Cape Verde Transparent Display Market and publishes its comprehensive annual report, highlighting emerging trends, growth drivers, revenue analysis, and forecast outlook. Our insights help businesses to make data-backed strategic decisions with ongoing market dynamics. Our analysts track relevent industries related to the Cape Verde Transparent Display Market, allowing our clients with actionable intelligence and reliable forecasts tailored to emerging regional needs.
Yes, we provide customisation as per your requirements. To learn more, feel free to contact us on sales@6wresearch.com
1 Executive Summary |
2 Introduction |
2.1 Key Highlights of the Report |
2.2 Report Description |
2.3 Market Scope & Segmentation |
2.4 Research Methodology |
2.5 Assumptions |
3 Cape Verde Transparent Display Market Overview |
3.1 Cape Verde Country Macro Economic Indicators |
3.2 Cape Verde Transparent Display Market Revenues & Volume, 2021 & 2031F |
3.3 Cape Verde Transparent Display Market - Industry Life Cycle |
3.4 Cape Verde Transparent Display Market - Porter's Five Forces |
3.5 Cape Verde Transparent Display Market Revenues & Volume Share, By Product , 2021 & 2031F |
3.6 Cape Verde Transparent Display Market Revenues & Volume Share, By Vertical , 2021 & 2031F |
3.7 Cape Verde Transparent Display Market Revenues & Volume Share, By Product, 2021 & 2031F |
3.8 Cape Verde Transparent Display Market Revenues & Volume Share, By Technology, 2021 & 2031F |
3.9 Cape Verde Transparent Display Market Revenues & Volume Share, By Resolution, 2021 & 2031F |
3.10 Cape Verde Transparent Display Market Revenues & Volume Share, By Display Size, 2021 & 2031F |
4 Cape Verde Transparent Display Market Dynamics |
4.1 Impact Analysis |
4.2 Market Drivers |
4.2.1 Increasing demand for advanced display technologies in various industries such as retail, hospitality, and automotive. |
4.2.2 Technological advancements leading to improved transparency and performance of transparent displays. |
4.2.3 Rising adoption of transparent displays for advertising and promotional activities to enhance customer engagement. |
4.3 Market Restraints |
4.3.1 High initial investment costs associated with deploying transparent display technology. |
4.3.2 Limited awareness and understanding of transparent display technology among potential users. |
4.3.3 Lack of standardized regulations and guidelines for the use of transparent displays in Cape Verde. |
5 Cape Verde Transparent Display Market Trends |
6 Cape Verde Transparent Display Market Segmentations |
6.1 Cape Verde Transparent Display Market, By Product |
6.1.1 Overview and Analysis |
6.1.2 Cape Verde Transparent Display Market Revenues & Volume, By HUD, 2021-2031F |
6.1.3 Cape Verde Transparent Display Market Revenues & Volume, By HMD, 2021-2031F |
6.1.4 Cape Verde Transparent Display Market Revenues & Volume, By Digital Signage, 2021-2031F |
6.1.5 Cape Verde Transparent Display Market Revenues & Volume, By Smart Appliance, 2021-2031F |
6.2 Cape Verde Transparent Display Market, By Vertical |
6.2.1 Overview and Analysis |
6.2.2 Cape Verde Transparent Display Market Revenues & Volume, By Consumer, 2021-2031F |
6.2.3 Cape Verde Transparent Display Market Revenues & Volume, By Retail & Hospitality, 2021-2031F |
6.2.4 Cape Verde Transparent Display Market Revenues & Volume, By Sports and Entertainment, 2021-2031F |
6.2.5 Cape Verde Transparent Display Market Revenues & Volume, By Aerospace and Defense, 2021-2031F |
6.2.6 Cape Verde Transparent Display Market Revenues & Volume, By Healthcare, 2021-2031F |
6.2.7 Cape Verde Transparent Display Market Revenues & Volume, By Automotive & Transportation, 2021-2031F |
6.2.8 Cape Verde Transparent Display Market Revenues & Volume, By Others, 2021-2031F |
6.2.9 Cape Verde Transparent Display Market Revenues & Volume, By Others, 2021-2031F |
6.3 Cape Verde Transparent Display Market, By Product |
6.3.1 Overview and Analysis |
6.3.2 Cape Verde Transparent Display Market Revenues & Volume, By HMD, 2021-2031F |
6.3.3 Cape Verde Transparent Display Market Revenues & Volume, By HUD, 2021-2031F |
6.3.4 Cape Verde Transparent Display Market Revenues & Volume, By Digital Signage, 2021-2031F |
6.3.5 Cape Verde Transparent Display Market Revenues & Volume, By Smart Appliance, 2021-2031F |
6.4 Cape Verde Transparent Display Market, By Technology |
6.4.1 Overview and Analysis |
6.4.2 Cape Verde Transparent Display Market Revenues & Volume, By LCD, 2021-2031F |
6.4.3 Cape Verde Transparent Display Market Revenues & Volume, By OLED, 2021-2031F |
6.4.4 Cape Verde Transparent Display Market Revenues & Volume, By Others (e-paper display, and DLP), 2021-2031F |
6.5 Cape Verde Transparent Display Market, By Resolution |
6.5.1 Overview and Analysis |
6.5.2 Cape Verde Transparent Display Market Revenues & Volume, By Ultra HD, 2021-2031F |
6.5.3 Cape Verde Transparent Display Market Revenues & Volume, By Full HD, 2021-2031F |
6.5.4 Cape Verde Transparent Display Market Revenues & Volume, By HD, 2021-2031F |
6.5.5 Cape Verde Transparent Display Market Revenues & Volume, By Others (VGA, WVGA, XGA, WXGA, and SXGA among others), 2021-2031F |
6.6 Cape Verde Transparent Display Market, By Display Size |
6.6.1 Overview and Analysis |
6.6.2 Cape Verde Transparent Display Market Revenues & Volume, By Small and Medium, 2021-2031F |
6.6.3 Cape Verde Transparent Display Market Revenues & Volume, By Large, 2021-2031F |
7 Cape Verde Transparent Display Market Import-Export Trade Statistics |
7.1 Cape Verde Transparent Display Market Export to Major Countries |
7.2 Cape Verde Transparent Display Market Imports from Major Countries |
8 Cape Verde Transparent Display Market Key Performance Indicators |
8.1 Average time spent interacting with transparent displays. |
8.2 Number of new applications utilizing transparent display technology. |
8.3 Percentage increase in the adoption of transparent displays across different industries in Cape Verde. |
9 Cape Verde Transparent Display Market - Opportunity Assessment |
9.1 Cape Verde Transparent Display Market Opportunity Assessment, By Product , 2021 & 2031F |
9.2 Cape Verde Transparent Display Market Opportunity Assessment, By Vertical , 2021 & 2031F |
9.3 Cape Verde Transparent Display Market Opportunity Assessment, By Product, 2021 & 2031F |
9.4 Cape Verde Transparent Display Market Opportunity Assessment, By Technology, 2021 & 2031F |
9.5 Cape Verde Transparent Display Market Opportunity Assessment, By Resolution, 2021 & 2031F |
9.6 Cape Verde Transparent Display Market Opportunity Assessment, By Display Size, 2021 & 2031F |
10 Cape Verde Transparent Display Market - Competitive Landscape |
10.1 Cape Verde Transparent Display Market Revenue Share, By Companies, 2024 |
10.2 Cape Verde Transparent Display Market Competitive Benchmarking, By Operating and Technical Parameters |
11 Company Profiles |
12 Recommendations | 13 Disclaimer |
Export potential assessment - trade Analytics for 2030
Export potential enables firms to identify high-growth global markets with greater confidence by combining advanced trade intelligence with a structured quantitative methodology. The framework analyzes emerging demand trends and country-level import patterns while integrating macroeconomic and trade datasets such as GDP and population forecasts, bilateral import–export flows, tariff structures, elasticity differentials between developed and developing economies, geographic distance, and import demand projections. Using weighted trade values from 2020–2024 as the base period to project country-to-country export potential for 2030, these inputs are operationalized through calculated drivers such as gravity model parameters, tariff impact factors, and projected GDP per-capita growth. Through an analysis of hidden potentials, demand hotspots, and market conditions that are most favorable to success, this method enables firms to focus on target countries, maximize returns, and global expansion with data, backed by accuracy.
By factoring in the projected importer demand gap that is currently unmet and could be potential opportunity, it identifies the potential for the Exporter (Country) among 190 countries, against the general trade analysis, which identifies the biggest importer or exporter.
To discover high-growth global markets and optimize your business strategy:
Click Here
Pricing
- Single User License$ 1,995
- Department License$ 2,400
- Site License$ 3,120
- Global License$ 3,795

Search
Thought Leadership and Analyst Meet


Our Clients
Latest Reports
- Taiwan Food Delivery Platform Market (2026-2032) | Companies, Outlook, Analysis, Trends, Value, Revenue, Segmentation, Share, Forecast, Competitive Landscape, Growth, Size & Forecast
- United Kingdom (UK) Long-term Care Insurance Market (2026-2032) | Growth, Share, Consumer Insights, Drivers, Opportunities, Competition, Pricing Analysis, Segments, Restraints, Companies, Competitive, Value, Outlook, Size, Demand, Analysis, Challenges, Strategic Insights, Investment Trends, Revenue, Trends, Supply, Forecast
- United Kingdom (UK) Long Term Care Market (2026-2032) | Companies, Outlook, Analysis, Trends, Value, Revenue, Segmentation, Share, Forecast, Competitive Landscape, Growth, Size & Forecast
- Iraq Insulation and Waterproofing Market (2026-2032) | Outlook, Drivers, Growth, Size, Share, Industry, Revenue, Trends, Demand, Competitive, Strategic Insights, Opportunities, Segments, Companies, Challenges, Strategy, Consumer Insights, Analysis, Investment Trends, Value, Segmentation, Forecast, Restraints
- India Switchgear Market Outlook (2026-2032) | Size, Share, Trends, Growth, Revenue, Forecast, Analysis, Value, Outlook
- Pakistan Contraceptive Implants Market (2025-2031) | Demand, Growth, Size, Share, Industry, Pricing Analysis, Competitive, Strategic Insights, Strategy, Consumer Insights, Analysis, Investment Trends, Opportunities, Revenue, Segments, Value, Segmentation, Supply, Forecast, Restraints, Outlook, Competition, Drivers, Trends, Companies, Challenges
- Sri Lanka Packaging Market (2026-2032) | Outlook, Competition, Drivers, Trends, Demand, Pricing Analysis, Competitive, Strategic Insights, Companies, Challenges, Strategy, Consumer Insights, Analysis, Investment Trends, Opportunities, Growth, Size, Share, Industry, Revenue, Segments, Value, Segmentation, Supply, Forecast, Restraints
- India Kids Watches Market (2026-2032) | Strategy, Consumer Insights, Analysis, Investment Trends, Opportunities, Growth, Size, Share, Industry, Revenue, Segments, Value, Segmentation, Supply, Forecast, Restraints, Outlook, Competition, Drivers, Trends, Demand, Pricing Analysis, Competitive, Strategic Insights, Companies, Challenges
- Saudi Arabia Core Assurance Service Market (2025-2031) | Strategy, Consumer Insights, Analysis, Investment Trends, Opportunities, Growth, Size, Share, Industry, Revenue, Segments, Value, Segmentation, Supply, Forecast, Restraints, Outlook, Competition, Drivers, Trends, Demand, Pricing Analysis, Competitive, Strategic Insights, Companies, Challenges
- Romania Uninterruptible Power Supply (UPS) Market (2026-2032) | Industry, Analysis, Revenue, Size, Forecast, Outlook, Value, Trends, Share, Growth & Companies
Industry Events and Analyst Meet

India EV Show 2026

EV tech India Expo 2026

Auto Tech Asia 2026

Battery Tech India 2026

Smart Production Solutions Guangzhou 2026
Whitepaper
- Middle East & Africa Commercial Security Market Click here to view more.
- Middle East & Africa Fire Safety Systems & Equipment Market Click here to view more.
- GCC Drone Market Click here to view more.
- Middle East Lighting Fixture Market Click here to view more.
- GCC Physical & Perimeter Security Market Click here to view more.
6WResearch In News
- Doha a strategic location for EV manufacturing hub: IPA Qatar
- Demand for luxury TVs surging in the GCC, says Samsung
- Empowering Growth: The Thriving Journey of Bangladesh’s Cable Industry
- Demand for luxury TVs surging in the GCC, says Samsung
- Video call with a traditional healer? Once unthinkable, it’s now common in South Africa
- Intelligent Buildings To Smooth GCC’s Path To Net Zero