Chile Kegs Market Outlook | Share, Industry, Revenue, Analysis, COVID-19 IMPACT, Trends, Forecast, Value, Companies, Size & Growth
Market Forecast By Material (Plastic, Tin, Stainless Steel), By Capacity (Up to 20 Liter, 20 Liter to 40 Liter, 40 Liter to 60 Liter, Above 60 Liter), By End Use (Alcoholic Beverages, Non-Alcoholic Beverages, Cooking Oil, Chemicals, Others), By Distribution Channel (Supermarket/Hypermarket, Commercial Liquor Store, Others) And Competitive Landscape
| Product Code: ETC253508 | Publication Date: Aug 2022 | Updated Date: Oct 2025 | Product Type: Market Research Report | |
| Publisher: 6Wresearch | Author: Ravi Bhandari | No. of Pages: 75 | No. of Figures: 35 | No. of Tables: 20 |
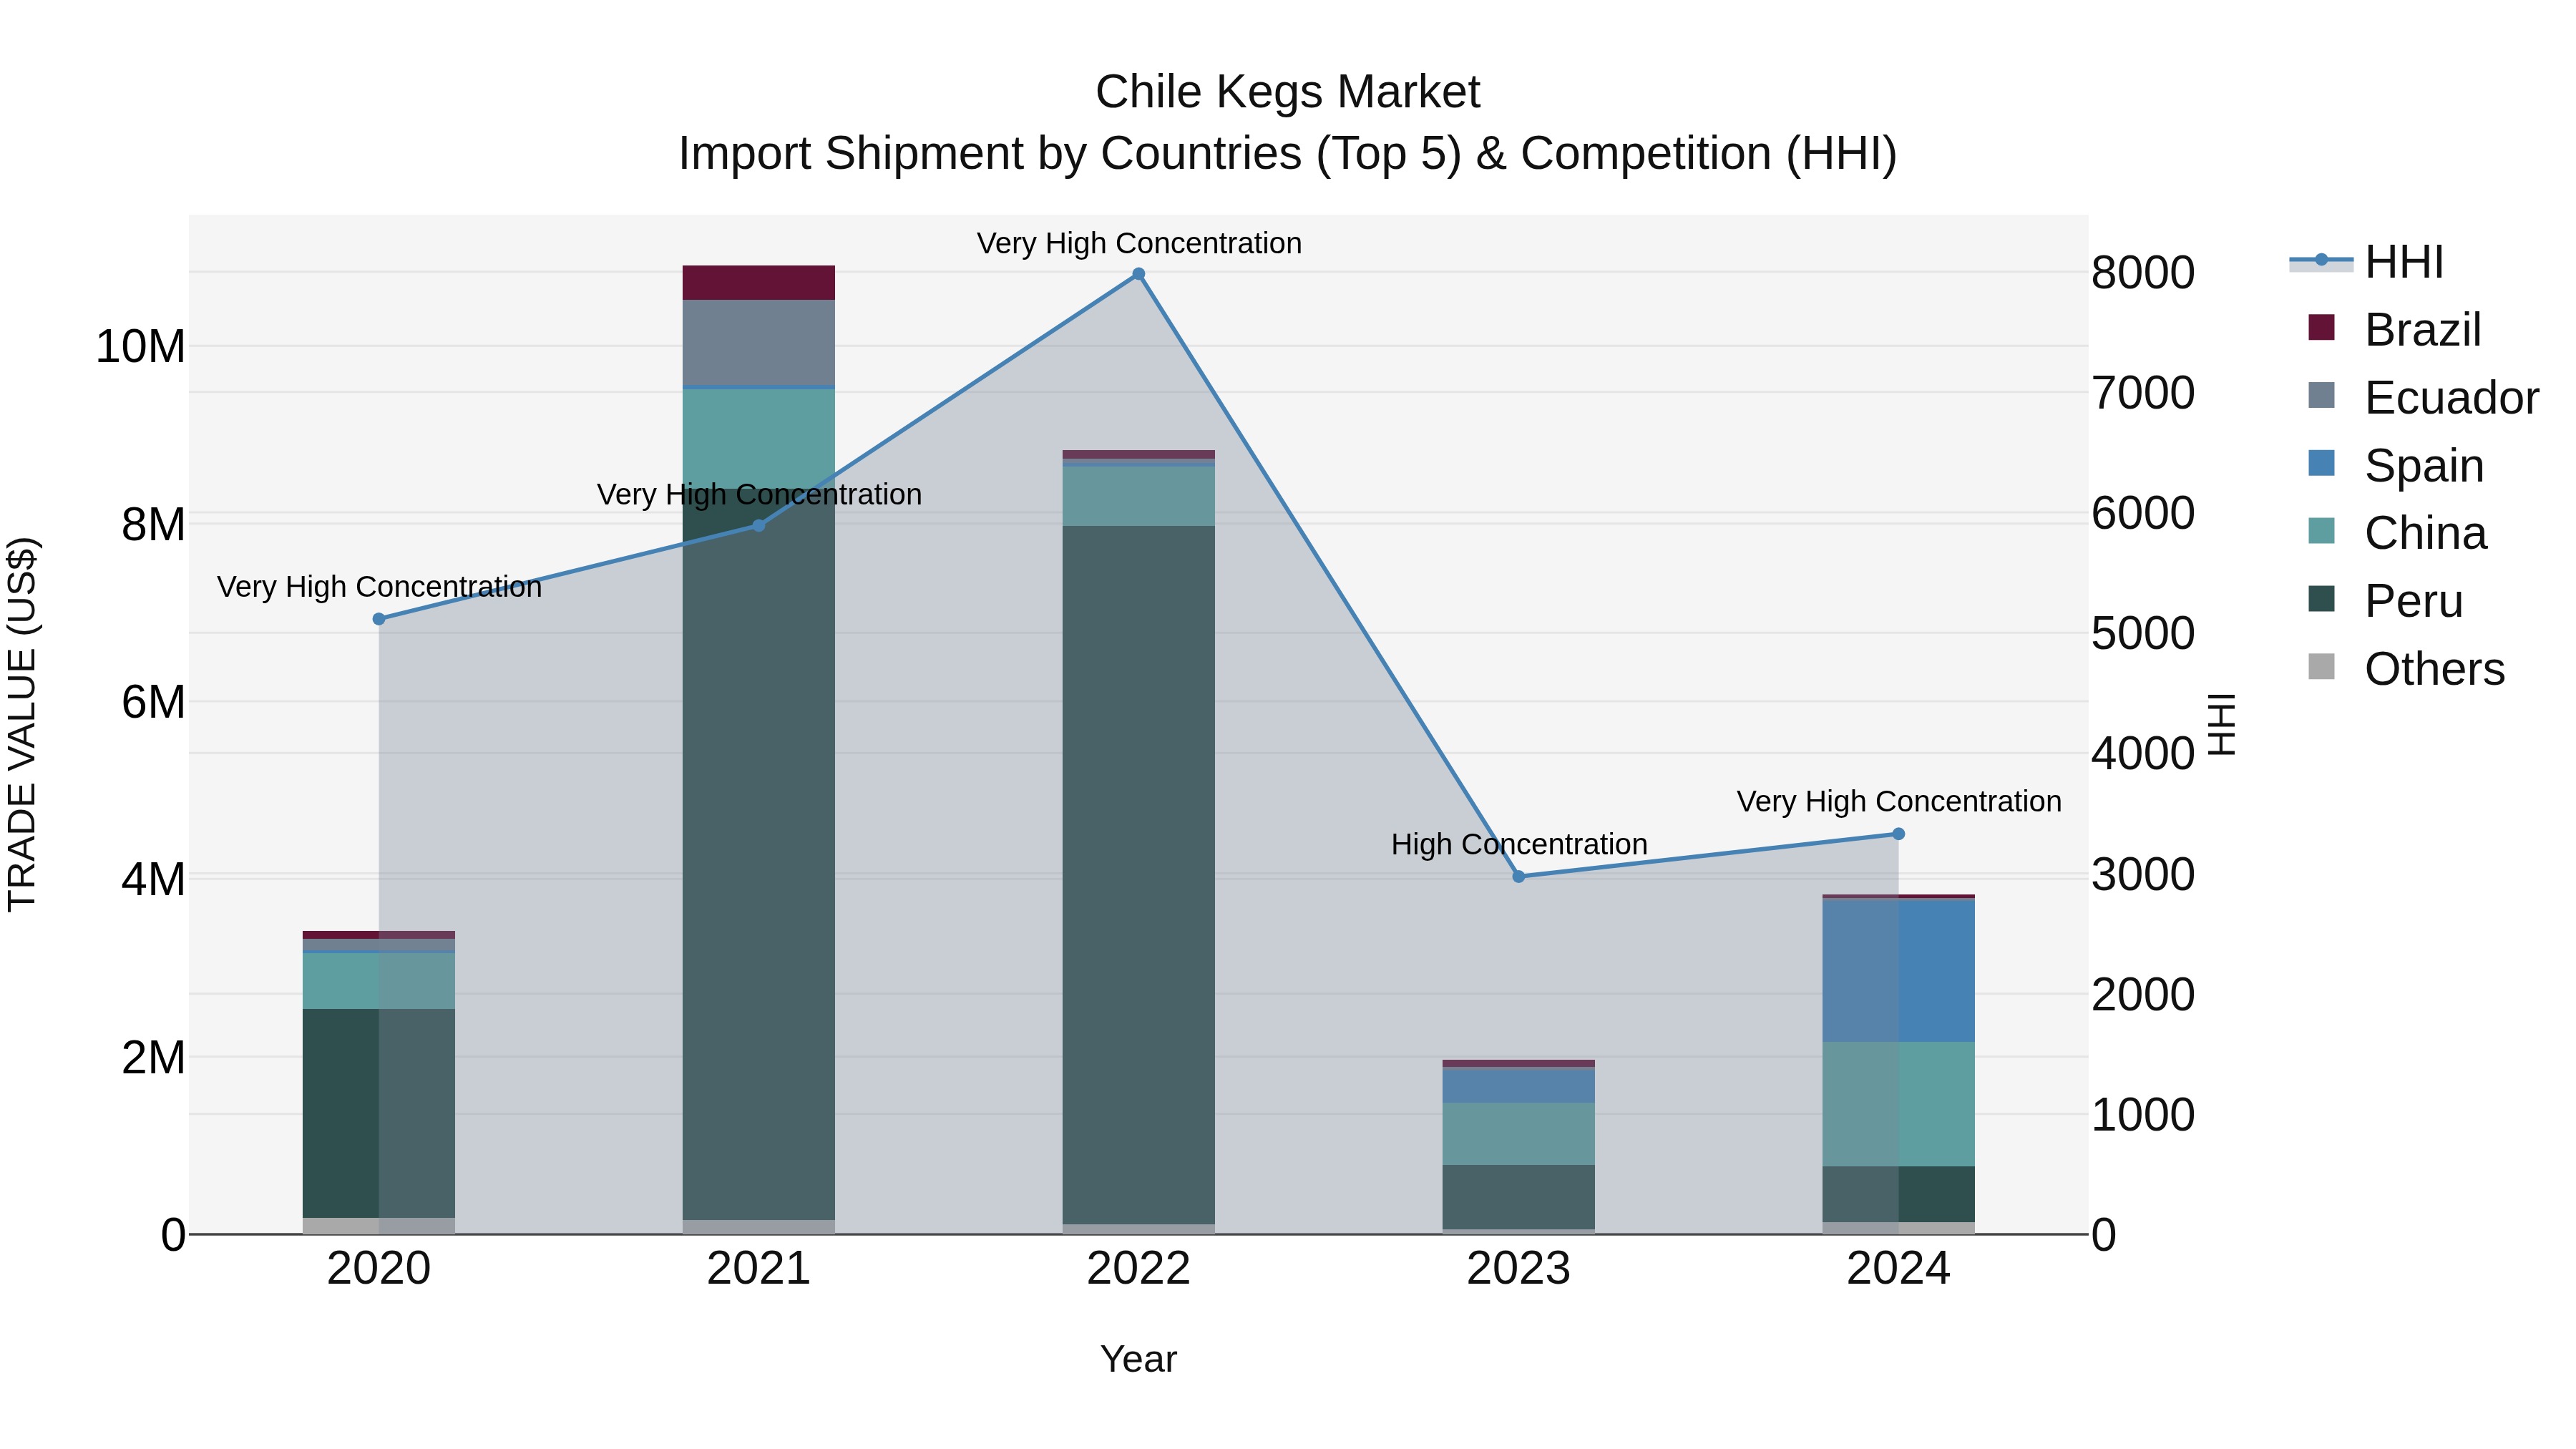
Chile Kegs Market Top 5 Importing Countries and Market Competition (HHI) Analysis
Chile`s import shipments of kegs in 2024 continue to be dominated by key exporters such as Spain, China, Peru, Turkey, and Brazil. The market concentration, as measured by the Herfindahl-Hirschman Index (HHI), has significantly increased from 2023 to 2024, indicating a very high level of concentration among these top exporting countries. The compound annual growth rate (CAGR) from 2020 to 2024 stood at 2.92%, with a notable growth rate of 94.75% from 2023 to 2024, highlighting the dynamic and rapidly evolving nature of the market for kegs in Chile.
Chile Kegs Market Overview
focuses on the production, distribution, and utilization of kegs, cylindrical containers typically made of stainless steel or aluminum, used for storing and dispensing beverages such as beer, cider, and wine. Kegs are preferred over bottles and cans for serving draft beverages in bars, restaurants, and events due to their cost-effectiveness, environmental sustainability, and ability to maintain beverage quality. With the growing demand for craft beer and specialty beverages, the market for kegs is experiencing growth in Chile, driven by the expansion of the beverage industry and the increasing popularity of draft beer consumption.
Drivers of the market
The kegs market in Chile is experiencing significant growth attributed to the increasing consumption of craft beer, cider, and other alcoholic beverages in bars, restaurants, and entertainment venues. Kegs, or beer barrels, provide a cost-effective and environmentally friendly packaging solution for storing and dispensing draft beer, maintaining freshness and quality while reducing packaging waste compared to bottles and cans. Factors such as the growth of microbreweries, changing consumer preferences, and the rise of beer culture are driving market growth in Chile.
Challenges of the market
In the Chile kegs market, companies face challenges related to market demand and supply chain logistics. While kegs offer sustainable alternatives to single-use packaging for beverages such as beer and cider, there are limitations in terms of keg availability and distribution networks. Moreover, ensuring keg cleanliness and maintenance poses challenges for beverage producers and keg rental companies in terms of quality control and regulatory compliance. Additionally, managing keg returns and refills adds complexity to reverse logistics operations. Successfully addressing these challenges requires collaboration between beverage producers, keg suppliers, and distribution partners to develop efficient keg rental programs and promote circular economy practices that reduce packaging waste and carbon emissions.
Government Policy of the market
Government policies in the kegs market focus on product safety, quality control, and environmental sustainability in beverage packaging. Measures may include standards for keg materials and construction, hygiene regulations, and recycling incentives.
Key Highlights of the Report:
- Chile Kegs Market Outlook
- Market Size of Chile Kegs Market, 2024
- Forecast of Chile Kegs Market, 2031
- Historical Data and Forecast of Chile Kegs Revenues & Volume for the Period 2018 - 2031
- Chile Kegs Market Trend Evolution
- Chile Kegs Market Drivers and Challenges
- Chile Kegs Price Trends
- Chile Kegs Porter's Five Forces
- Chile Kegs Industry Life Cycle
- Historical Data and Forecast of Chile Kegs Market Revenues & Volume By Material for the Period 2018 - 2031
- Historical Data and Forecast of Chile Kegs Market Revenues & Volume By Plastic for the Period 2018 - 2031
- Historical Data and Forecast of Chile Kegs Market Revenues & Volume By Tin for the Period 2018 - 2031
- Historical Data and Forecast of Chile Kegs Market Revenues & Volume By Stainless Steel for the Period 2018 - 2031
- Historical Data and Forecast of Chile Kegs Market Revenues & Volume By Capacity for the Period 2018 - 2031
- Historical Data and Forecast of Chile Kegs Market Revenues & Volume By Up to 20 Liter for the Period 2018 - 2031
- Historical Data and Forecast of Chile Kegs Market Revenues & Volume By 20 Liter to 40 Liter for the Period 2018 - 2031
- Historical Data and Forecast of Chile Kegs Market Revenues & Volume By 40 Liter to 60 Liter for the Period 2018 - 2031
- Historical Data and Forecast of Chile Kegs Market Revenues & Volume By Above 60 Liter for the Period 2018 - 2031
- Historical Data and Forecast of Chile Kegs Market Revenues & Volume By End Use for the Period 2018 - 2031
- Historical Data and Forecast of Chile Kegs Market Revenues & Volume By Alcoholic Beverages for the Period 2018 - 2031
- Historical Data and Forecast of Chile Kegs Market Revenues & Volume By Non-Alcoholic Beverages for the Period 2018 - 2031
- Historical Data and Forecast of Chile Kegs Market Revenues & Volume By Cooking Oil for the Period 2018 - 2031
- Historical Data and Forecast of Chile Kegs Market Revenues & Volume By Chemicals for the Period 2018 - 2031
- Historical Data and Forecast of Chile Kegs Market Revenues & Volume By Others for the Period 2018 - 2031
- Historical Data and Forecast of Chile Kegs Market Revenues & Volume By Distribution Channel for the Period 2018 - 2031
- Historical Data and Forecast of Chile Kegs Market Revenues & Volume By Supermarket/Hypermarket for the Period 2018 - 2031
- Historical Data and Forecast of Chile Kegs Market Revenues & Volume By Commercial Liquor Store for the Period 2018 - 2031
- Historical Data and Forecast of Chile Kegs Market Revenues & Volume By Others for the Period 2018 - 2031
- Chile Kegs Import Export Trade Statistics
- Market Opportunity Assessment By Material
- Market Opportunity Assessment By Capacity
- Market Opportunity Assessment By End Use
- Market Opportunity Assessment By Distribution Channel
- Chile Kegs Top Companies Market Share
- Chile Kegs Competitive Benchmarking By Technical and Operational Parameters
- Chile Kegs Company Profiles
- Chile Kegs Key Strategic Recommendations
Frequently Asked Questions About the Market Study (FAQs):
6Wresearch actively monitors the Chile Kegs Market and publishes its comprehensive annual report, highlighting emerging trends, growth drivers, revenue analysis, and forecast outlook. Our insights help businesses to make data-backed strategic decisions with ongoing market dynamics. Our analysts track relevent industries related to the Chile Kegs Market, allowing our clients with actionable intelligence and reliable forecasts tailored to emerging regional needs.
Yes, we provide customisation as per your requirements. To learn more, feel free to contact us on sales@6wresearch.com
1 Executive Summary |
2 Introduction |
2.1 Key Highlights of the Report |
2.2 Report Description |
2.3 Market Scope & Segmentation |
2.4 Research Methodology |
2.5 Assumptions |
3 Chile Kegs Market Overview |
3.1 Chile Country Macro Economic Indicators |
3.2 Chile Kegs Market Revenues & Volume, 2021 & 2031F |
3.3 Chile Kegs Market - Industry Life Cycle |
3.4 Chile Kegs Market - Porter's Five Forces |
3.5 Chile Kegs Market Revenues & Volume Share, By Material, 2021 & 2031F |
3.6 Chile Kegs Market Revenues & Volume Share, By Capacity, 2021 & 2031F |
3.7 Chile Kegs Market Revenues & Volume Share, By End Use, 2021 & 2031F |
3.8 Chile Kegs Market Revenues & Volume Share, By Distribution Channel, 2021 & 2031F |
4 Chile Kegs Market Dynamics |
4.1 Impact Analysis |
4.2 Market Drivers |
4.2.1 Growing trend of craft beer consumption leading to increased demand for unique and flavorful beverages. |
4.2.2 Rising popularity of social gatherings and events promoting the use of kegs for convenient and efficient beverage service. |
4.2.3 Increasing adoption of kegs by restaurants, bars, and catering services for cost-effective and sustainable beverage dispensing solutions. |
4.3 Market Restraints |
4.3.1 High initial investment and maintenance costs associated with kegging systems may deter small businesses and startups from entering the market. |
4.3.2 Regulatory challenges and compliance requirements related to kegging, such as quality control standards and safety regulations, can pose barriers to market growth. |
5 Chile Kegs Market Trends |
6 Chile Kegs Market, By Types |
6.1 Chile Kegs Market, By Material |
6.1.1 Overview and Analysis |
6.1.2 Chile Kegs Market Revenues & Volume, By Material, 2021-2031F |
6.1.3 Chile Kegs Market Revenues & Volume, By Plastic, 2021-2031F |
6.1.4 Chile Kegs Market Revenues & Volume, By Tin, 2021-2031F |
6.1.5 Chile Kegs Market Revenues & Volume, By Stainless Steel, 2021-2031F |
6.2 Chile Kegs Market, By Capacity |
6.2.1 Overview and Analysis |
6.2.2 Chile Kegs Market Revenues & Volume, By Up to 20 Liter, 2021-2031F |
6.2.3 Chile Kegs Market Revenues & Volume, By 20 Liter to 40 Liter, 2021-2031F |
6.2.4 Chile Kegs Market Revenues & Volume, By 40 Liter to 60 Liter, 2021-2031F |
6.2.5 Chile Kegs Market Revenues & Volume, By Above 60 Liter, 2021-2031F |
6.3 Chile Kegs Market, By End Use |
6.3.1 Overview and Analysis |
6.3.2 Chile Kegs Market Revenues & Volume, By Alcoholic Beverages, 2021-2031F |
6.3.3 Chile Kegs Market Revenues & Volume, By Non-Alcoholic Beverages, 2021-2031F |
6.3.4 Chile Kegs Market Revenues & Volume, By Cooking Oil, 2021-2031F |
6.3.5 Chile Kegs Market Revenues & Volume, By Chemicals, 2021-2031F |
6.3.6 Chile Kegs Market Revenues & Volume, By Others, 2021-2031F |
6.4 Chile Kegs Market, By Distribution Channel |
6.4.1 Overview and Analysis |
6.4.2 Chile Kegs Market Revenues & Volume, By Supermarket/Hypermarket, 2021-2031F |
6.4.3 Chile Kegs Market Revenues & Volume, By Commercial Liquor Store, 2021-2031F |
6.4.4 Chile Kegs Market Revenues & Volume, By Others, 2021-2031F |
7 Chile Kegs Market Import-Export Trade Statistics |
7.1 Chile Kegs Market Export to Major Countries |
7.2 Chile Kegs Market Imports from Major Countries |
8 Chile Kegs Market Key Performance Indicators |
8.1 Average fill rate per keg: Tracking the average fill rate per keg can indicate the efficiency of production and distribution processes, as well as demand trends in the market. |
8.2 Customer satisfaction score: Monitoring customer satisfaction levels through surveys and feedback can provide insights into the quality of products and services offered in the chile kegs market. |
8.3 Sustainability metrics: Measuring and improving sustainability metrics, such as carbon footprint reduction and waste management practices, can showcase a company's commitment to environmental responsibility and appeal to eco-conscious consumers. |
9 Chile Kegs Market - Opportunity Assessment |
9.1 Chile Kegs Market Opportunity Assessment, By Material, 2021 & 2031F |
9.2 Chile Kegs Market Opportunity Assessment, By Capacity, 2021 & 2031F |
9.3 Chile Kegs Market Opportunity Assessment, By End Use, 2021 & 2031F |
9.4 Chile Kegs Market Opportunity Assessment, By Distribution Channel, 2021 & 2031F |
10 Chile Kegs Market - Competitive Landscape |
10.1 Chile Kegs Market Revenue Share, By Companies, 2024 |
10.2 Chile Kegs Market Competitive Benchmarking, By Operating and Technical Parameters |
11 Company Profiles |
12 Recommendations |
13 Disclaimer |
Global Go To Market Strategy - 2030
Export potential enables firms to identify high-growth global markets with greater confidence by combining advanced trade intelligence with a structured quantitative methodology. The framework analyzes emerging demand trends and country-level import patterns while integrating macroeconomic and trade datasets such as GDP and population forecasts, bilateral import–export flows, tariff structures, elasticity differentials between developed and developing economies, geographic distance, and import demand projections. Using weighted trade values from 2020–2024 as the base period to project country-to-country export potential for 2030, these inputs are operationalized through calculated drivers such as gravity model parameters, tariff impact factors, and projected GDP per-capita growth. Through an analysis of hidden potentials, demand hotspots, and market conditions that are most favorable to success, this method enables firms to focus on target countries, maximize returns, and global expansion with data, backed by accuracy.
By factoring in the projected importer demand gap that is currently unmet and could be potential opportunity, it identifies the potential for the Exporter (Country) among 190 countries, against the general trade analysis, which identifies the biggest importer or exporter.
To discover high-growth global markets and optimize your business strategy:
Click Here
Pricing
- Single User License$ 1,995
- Department License$ 2,400
- Site License$ 3,120
- Global License$ 3,795

Leadership Perspectives from Industry Events
Search
Thought Leadership and Analyst Meet


Our Clients
6WResearch In News
- India Air Conditioner Market Set for Strong Rebound in 2026 After Weather-Led Correction and GST-Driven Recovery: 6Wresearch
- ADAS in India: How Automatic Emergency Braking, Blind Spot Detection & Driver Monitoring are Transforming Road Safety
- Doha a strategic location for EV manufacturing hub: IPA Qatar
- Demand for luxury TVs surging in the GCC, says Samsung
- Empowering Growth: The Thriving Journey of Bangladesh’s Cable Industry
- Demand for luxury TVs surging in the GCC, says Samsung
Latest Reports
- Nicaragua RPG Gaming Market (2026-2032)
- New Zealand RPG Gaming Market (2026-2032)
- Netherlands RPG Gaming Market (2026-2032)
- Nauru RPG Gaming Market (2026-2032)
- Namibia RPG Gaming Market (2026-2032)
- Mozambique RPG Gaming Market (2026-2032)
- Montenegro RPG Gaming Market (2026-2032)
- Mongolia RPG Gaming Market (2026-2032)
- Monaco RPG Gaming Market (2026-2032)
- Micronesia RPG Gaming Market (2026-2032)
Industry Events and Analyst Meet

HIMTEX 2026

India Refining Summit 2026

India EV Show 2026

EV tech India Expo 2026

Auto Tech Asia 2026
Whitepaper
- Middle East & Africa Commercial Security Market Click here to view more.
- Middle East & Africa Fire Safety Systems & Equipment Market Click here to view more.
- GCC Drone Market Click here to view more.
- Middle East Lighting Fixture Market Click here to view more.
- GCC Physical & Perimeter Security Market Click here to view more.