Chile Offshore AUV And ROV Market (2026-2032) | Industry, Size & Revenue, Competitive Landscape, Segmentation, Trends, Forecast, Analysis, Value, Companies, Share, Growth, Outlook
Market Forecast By Product (Autonomous Underwater Vehicle (AUV), Remotely Operated Vehicle), By Propulsion (Electric System, Mechanical System, Hybrid System), By Application (Drilling and Well Completion Support, Construction Support, Inspection, Repair and Maintenance Service, Subsea Engineering Services, Remote Subsea Intervention Tooling Design and Build, Others) And Competitive Landscape
| Product Code: ETC6727363 | Publication Date: Sep 2024 | Updated Date: Apr 2026 | Product Type: Market Research Report | |
| Publisher: 6Wresearch | Author: Dhaval Chaurasia | No. of Pages: 75 | No. of Figures: 35 | No. of Tables: 20 |
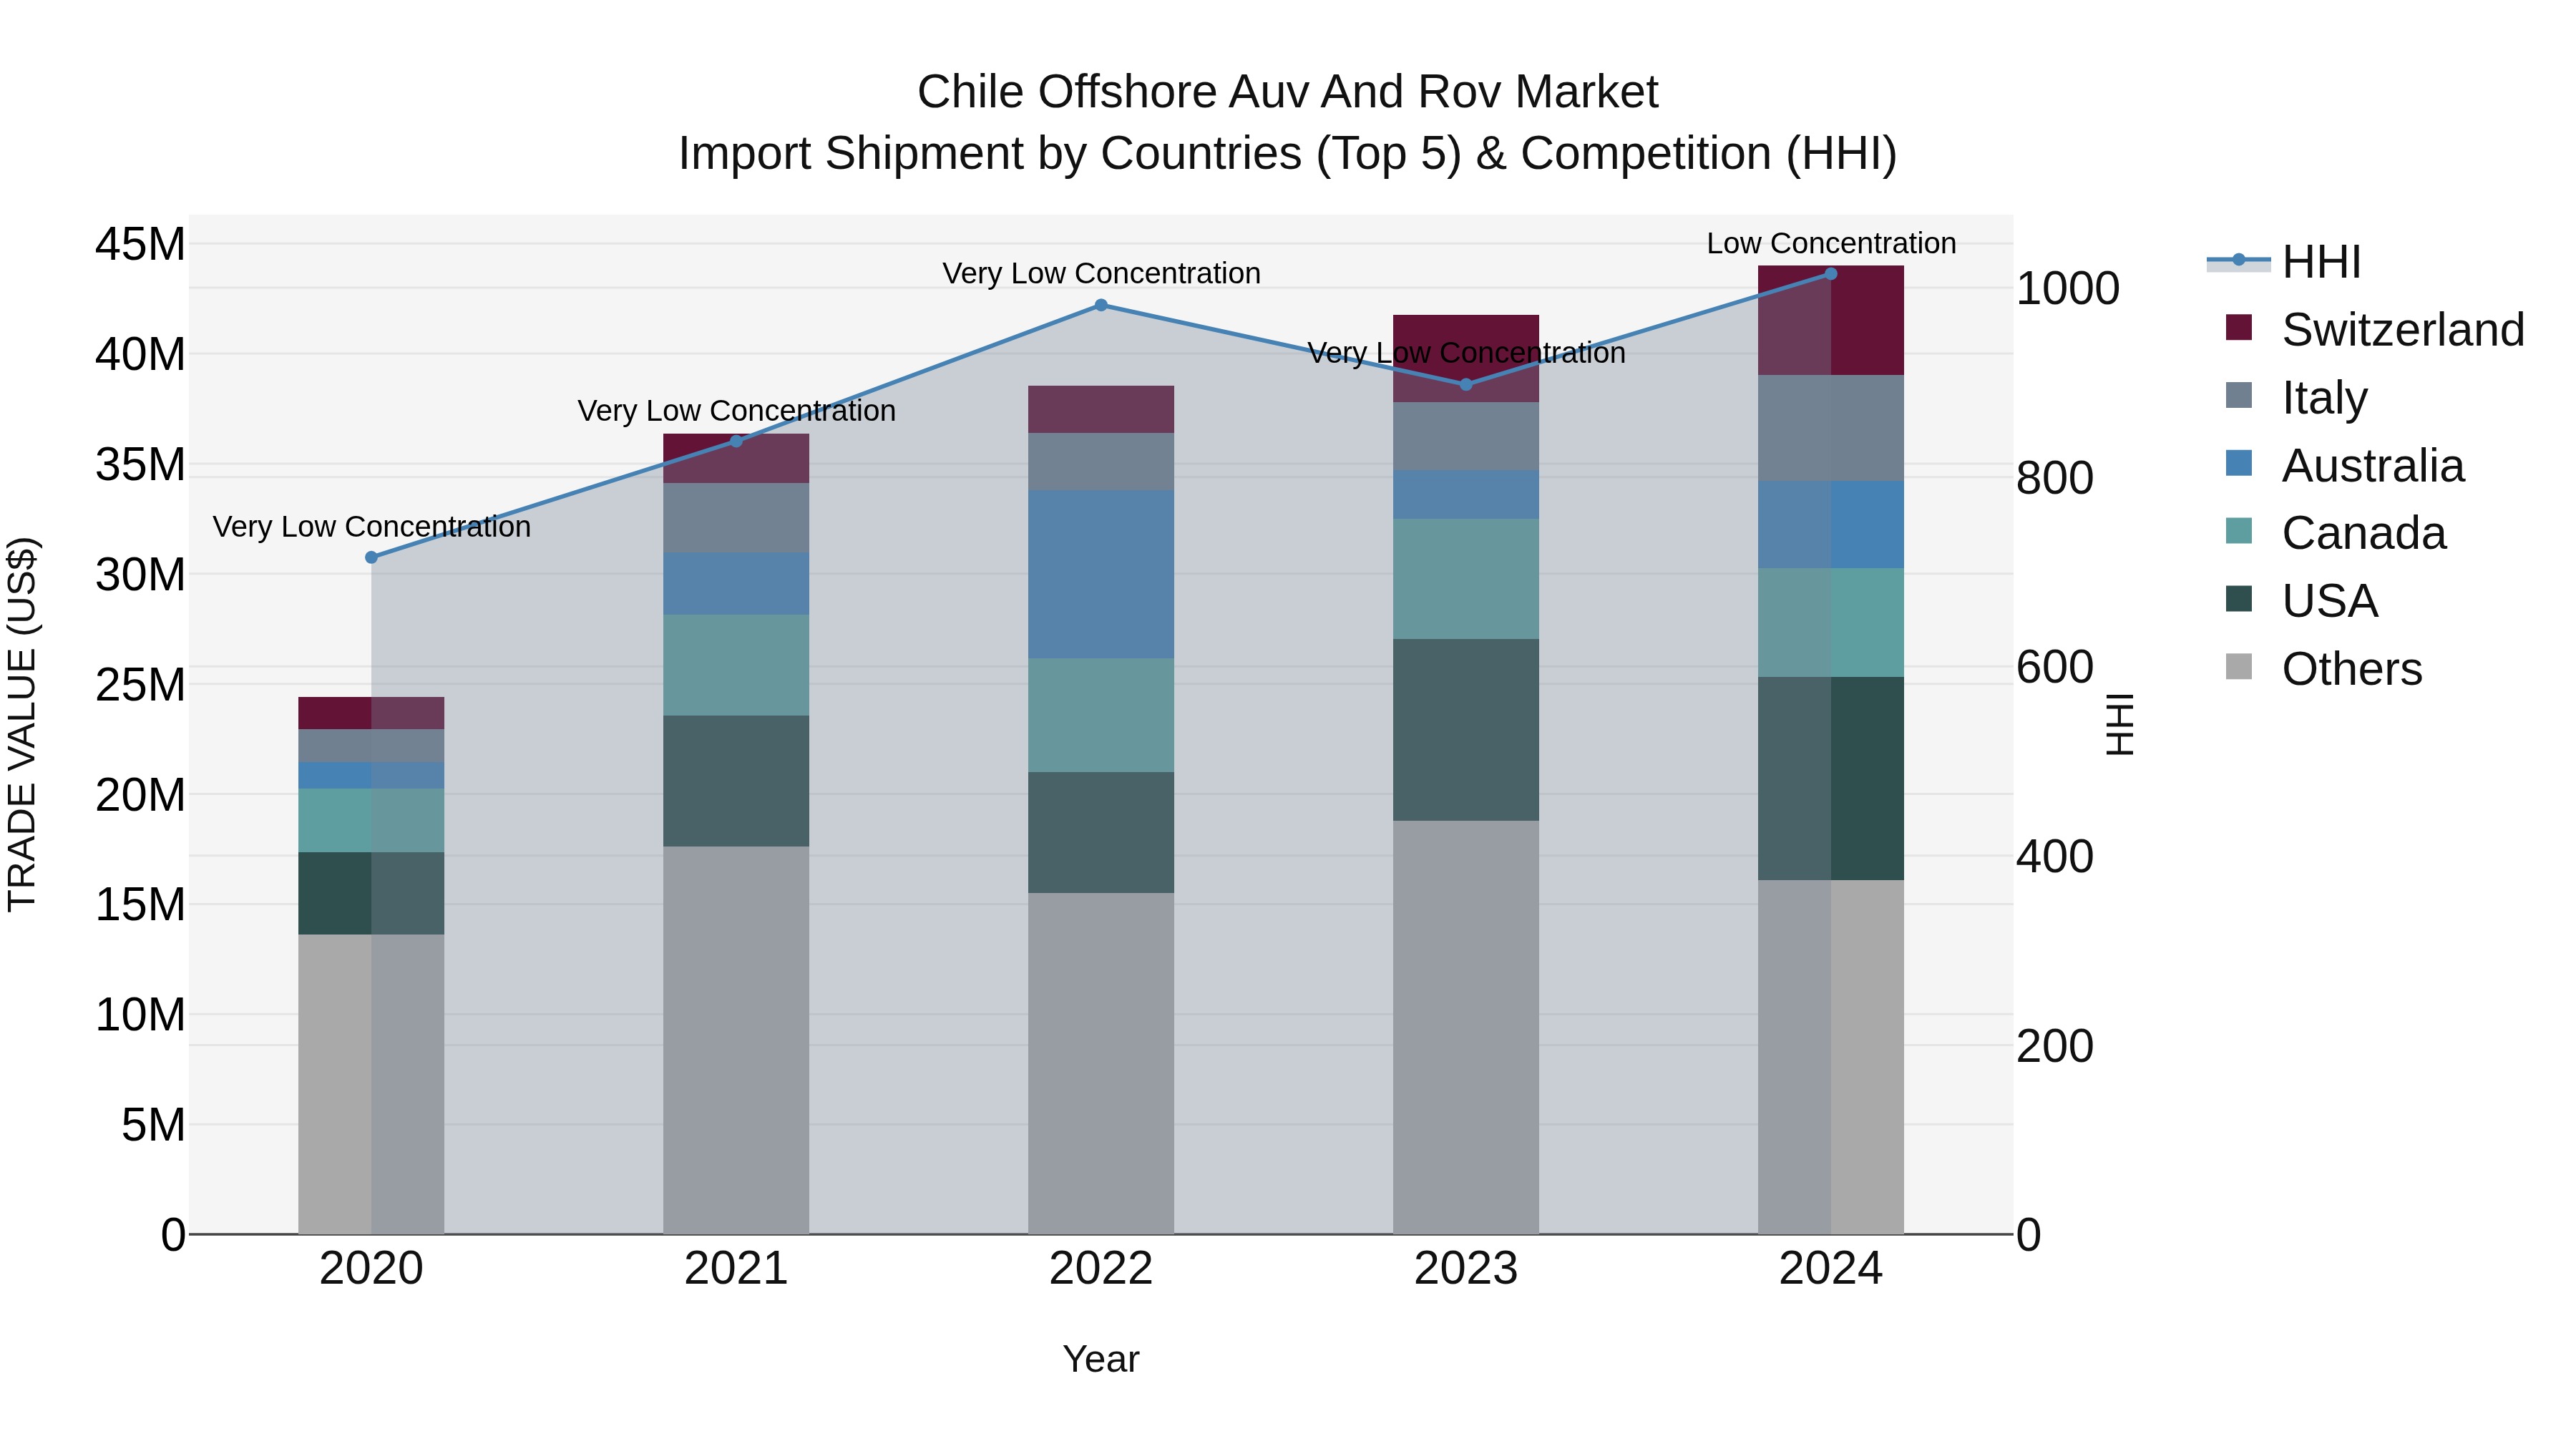
Chile Offshore Auv and Rov Market Top 5 Importing Countries and Market Competition (HHI) Analysis
Chile`s offshore AUV and ROV import shipments in 2024 saw a notable increase in concentration, transitioning from very low to low concentration, indicating a more balanced distribution among exporting countries. The top countries exporting to Chile in 2024 were the USA, Switzerland, Canada, Italy, and Australia, showcasing a diverse source of these products. With a commendable Compound Annual Growth Rate (CAGR) of 15.85% from 2020 to 2024 and a solid growth rate of 5.33% from 2023 to 2024, the market for offshore AUV and ROV imports in Chile appears promising and dynamic.
Key Highlights of the Report:
- Chile Offshore AUV And ROV Market Outlook
- Market Size of Chile Offshore AUV And ROV Market, 2025
- Forecast of Chile Offshore AUV And ROV Market, 2032
- Historical Data and Forecast of Chile Offshore AUV And ROV Revenues & Volume for the Period 2022 - 2032
- Chile Offshore AUV And ROV Market Trend Evolution
- Chile Offshore AUV And ROV Market Drivers and Challenges
- Chile Offshore AUV And ROV Price Trends
- Chile Offshore AUV And ROV Porter's Five Forces
- Chile Offshore AUV And ROV Industry Life Cycle
- Historical Data and Forecast of Chile Offshore AUV And ROV Market Revenues & Volume By Product for the Period 2022 - 2032
- Historical Data and Forecast of Chile Offshore AUV And ROV Market Revenues & Volume By Autonomous Underwater Vehicle (AUV) for the Period 2022 - 2032
- Historical Data and Forecast of Chile Offshore AUV And ROV Market Revenues & Volume By Remotely Operated Vehicle for the Period 2022 - 2032
- Historical Data and Forecast of Chile Offshore AUV And ROV Market Revenues & Volume By Propulsion for the Period 2022 - 2032
- Historical Data and Forecast of Chile Offshore AUV And ROV Market Revenues & Volume By Electric System for the Period 2022 - 2032
- Historical Data and Forecast of Chile Offshore AUV And ROV Market Revenues & Volume By Mechanical System for the Period 2022 - 2032
- Historical Data and Forecast of Chile Offshore AUV And ROV Market Revenues & Volume By Hybrid System for the Period 2022 - 2032
- Historical Data and Forecast of Chile Offshore AUV And ROV Market Revenues & Volume By Application for the Period 2022 - 2032
- Historical Data and Forecast of Chile Offshore AUV And ROV Market Revenues & Volume By Drilling and Well Completion Support for the Period 2022 - 2032
- Historical Data and Forecast of Chile Offshore AUV And ROV Market Revenues & Volume By Construction Support for the Period 2022 - 2032
- Historical Data and Forecast of Chile Offshore AUV And ROV Market Revenues & Volume By Inspection, Repair and Maintenance Service for the Period 2022 - 2032
- Historical Data and Forecast of Chile Offshore AUV And ROV Market Revenues & Volume By Subsea Engineering Services for the Period 2022 - 2032
- Historical Data and Forecast of Chile Offshore AUV And ROV Market Revenues & Volume By Remote Subsea Intervention Tooling Design and Build for the Period 2022 - 2032
- Historical Data and Forecast of Chile Offshore AUV And ROV Market Revenues & Volume By Others for the Period 2022 - 2032
- Chile Offshore AUV And ROV Import Export Trade Statistics
- Market Opportunity Assessment By Product
- Market Opportunity Assessment By Propulsion
- Market Opportunity Assessment By Application
- Chile Offshore AUV And ROV Top Companies Market Share
- Chile Offshore AUV And ROV Competitive Benchmarking By Technical and Operational Parameters
- Chile Offshore AUV And ROV Company Profiles
- Chile Offshore AUV And ROV Key Strategic Recommendations
Frequently Asked Questions About the Market Study (FAQs):
6Wresearch actively monitors the Chile Offshore AUV And ROV Market and publishes its comprehensive annual report, highlighting emerging trends, growth drivers, revenue analysis, and forecast outlook. Our insights help businesses to make data-backed strategic decisions with ongoing market dynamics. Our analysts track relevent industries related to the Chile Offshore AUV And ROV Market, allowing our clients with actionable intelligence and reliable forecasts tailored to emerging regional needs.
Yes, we provide customisation as per your requirements. To learn more, feel free to contact us on sales@6wresearch.com
1 Executive Summary |
2 Introduction |
2.1 Key Highlights of the Report |
2.2 Report Description |
2.3 Market Scope & Segmentation |
2.4 Research Methodology |
2.5 Assumptions |
3 Chile Offshore AUV And ROV Market Overview |
3.1 Chile Country Macro Economic Indicators |
3.2 Chile Offshore AUV And ROV Market Revenues & Volume, 2022 & 2032F |
3.3 Chile Offshore AUV And ROV Market - Industry Life Cycle |
3.4 Chile Offshore AUV And ROV Market - Porter's Five Forces |
3.5 Chile Offshore AUV And ROV Market Revenues & Volume Share, By Product, 2022 & 2032F |
3.6 Chile Offshore AUV And ROV Market Revenues & Volume Share, By Propulsion, 2022 & 2032F |
3.7 Chile Offshore AUV And ROV Market Revenues & Volume Share, By Application, 2022 & 2032F |
4 Chile Offshore AUV And ROV Market Dynamics |
4.1 Impact Analysis |
4.2 Market Drivers |
4.2.1 Increasing demand for underwater exploration and inspection activities in offshore industries |
4.2.2 Growing focus on cost-effective and efficient operations in the oil and gas sector |
4.2.3 Technological advancements in autonomous underwater vehicles (AUVs) and remotely operated vehicles (ROVs) |
4.3 Market Restraints |
4.3.1 High initial investment costs associated with AUVs and ROVs |
4.3.2 Challenges related to deep-sea exploration and harsh underwater environments |
4.3.3 Regulatory constraints and compliance requirements in the offshore industry |
5 Chile Offshore AUV And ROV Market Trends |
6 Chile Offshore AUV And ROV Market, By Types |
6.1 Chile Offshore AUV And ROV Market, By Product |
6.1.1 Overview and Analysis |
6.1.2 Chile Offshore AUV And ROV Market Revenues & Volume, By Product, 2022 - 2032F |
6.1.3 Chile Offshore AUV And ROV Market Revenues & Volume, By Autonomous Underwater Vehicle (AUV), 2022 - 2032F |
6.1.4 Chile Offshore AUV And ROV Market Revenues & Volume, By Remotely Operated Vehicle, 2022 - 2032F |
6.2 Chile Offshore AUV And ROV Market, By Propulsion |
6.2.1 Overview and Analysis |
6.2.2 Chile Offshore AUV And ROV Market Revenues & Volume, By Electric System, 2022 - 2032F |
6.2.3 Chile Offshore AUV And ROV Market Revenues & Volume, By Mechanical System, 2022 - 2032F |
6.2.4 Chile Offshore AUV And ROV Market Revenues & Volume, By Hybrid System, 2022 - 2032F |
6.3 Chile Offshore AUV And ROV Market, By Application |
6.3.1 Overview and Analysis |
6.3.2 Chile Offshore AUV And ROV Market Revenues & Volume, By Drilling and Well Completion Support, 2022 - 2032F |
6.3.3 Chile Offshore AUV And ROV Market Revenues & Volume, By Construction Support, 2022 - 2032F |
6.3.4 Chile Offshore AUV And ROV Market Revenues & Volume, By Inspection, Repair and Maintenance Service, 2022 - 2032F |
6.3.5 Chile Offshore AUV And ROV Market Revenues & Volume, By Subsea Engineering Services, 2022 - 2032F |
6.3.6 Chile Offshore AUV And ROV Market Revenues & Volume, By Remote Subsea Intervention Tooling Design and Build, 2022 - 2032F |
6.3.7 Chile Offshore AUV And ROV Market Revenues & Volume, By Others, 2022 - 2032F |
7 Chile Offshore AUV And ROV Market Import-Export Trade Statistics |
7.1 Chile Offshore AUV And ROV Market Export to Major Countries |
7.2 Chile Offshore AUV And ROV Market Imports from Major Countries |
8 Chile Offshore AUV And ROV Market Key Performance Indicators |
8.1 Utilization rate of AUVs and ROVs in offshore operations |
8.2 Average response time for deploying AUVs and ROVs for underwater tasks |
8.3 Rate of adoption of advanced sensor technologies in AUVs and ROVs |
8.4 Number of successful missions completed by AUVs and ROVs |
8.5 Efficiency gains achieved through the use of AUVs and ROVs in offshore projects |
9 Chile Offshore AUV And ROV Market - Opportunity Assessment |
9.1 Chile Offshore AUV And ROV Market Opportunity Assessment, By Product, 2022 & 2032F |
9.2 Chile Offshore AUV And ROV Market Opportunity Assessment, By Propulsion, 2022 & 2032F |
9.3 Chile Offshore AUV And ROV Market Opportunity Assessment, By Application, 2022 & 2032F |
10 Chile Offshore AUV And ROV Market - Competitive Landscape |
10.1 Chile Offshore AUV And ROV Market Revenue Share, By Companies, 2025 |
10.2 Chile Offshore AUV And ROV Market Competitive Benchmarking, By Operating and Technical Parameters |
11 Company Profiles |
12 Recommendations |
13 Disclaimer |
Global Go To Market Strategy - 2030
Export potential enables firms to identify high-growth global markets with greater confidence by combining advanced trade intelligence with a structured quantitative methodology. The framework analyzes emerging demand trends and country-level import patterns while integrating macroeconomic and trade datasets such as GDP and population forecasts, bilateral import–export flows, tariff structures, elasticity differentials between developed and developing economies, geographic distance, and import demand projections. Using weighted trade values from 2020–2024 as the base period to project country-to-country export potential for 2030, these inputs are operationalized through calculated drivers such as gravity model parameters, tariff impact factors, and projected GDP per-capita growth. Through an analysis of hidden potentials, demand hotspots, and market conditions that are most favorable to success, this method enables firms to focus on target countries, maximize returns, and global expansion with data, backed by accuracy.
By factoring in the projected importer demand gap that is currently unmet and could be potential opportunity, it identifies the potential for the Exporter (Country) among 190 countries, against the general trade analysis, which identifies the biggest importer or exporter.
To discover high-growth global markets and optimize your business strategy:
Click Here
Pricing
- Single User License$ 1,995
- Department License$ 2,400
- Site License$ 3,120
- Global License$ 3,795

Leadership Perspectives from Industry Events
Search
Thought Leadership and Analyst Meet


Our Clients
6WResearch In News
- Doha a strategic location for EV manufacturing hub: IPA Qatar
- Demand for luxury TVs surging in the GCC, says Samsung
- Empowering Growth: The Thriving Journey of Bangladesh’s Cable Industry
- Demand for luxury TVs surging in the GCC, says Samsung
- Video call with a traditional healer? Once unthinkable, it’s now common in South Africa
- Intelligent Buildings To Smooth GCC’s Path To Net Zero
Latest Reports
- New Zealand Aseptic Manufacturing Market (2026-2032)
- Netherlands Aseptic Manufacturing Market (2026-2032)
- Nauru Aseptic Manufacturing Market (2026-2032)
- Namibia Aseptic Manufacturing Market (2026-2032)
- Mozambique Aseptic Manufacturing Market (2026-2032)
- Montenegro Aseptic Manufacturing Market (2026-2032)
- Mongolia Aseptic Manufacturing Market (2026-2032)
- Monaco Aseptic Manufacturing Market (2026-2032)
- Micronesia Aseptic Manufacturing Market (2026-2032)
- Mauritius Aseptic Manufacturing Market (2026-2032)
Industry Events and Analyst Meet

HIMTEX 2026

India Refining Summit 2026

India EV Show 2026

EV tech India Expo 2026

Auto Tech Asia 2026
Whitepaper
- Middle East & Africa Commercial Security Market Click here to view more.
- Middle East & Africa Fire Safety Systems & Equipment Market Click here to view more.
- GCC Drone Market Click here to view more.
- Middle East Lighting Fixture Market Click here to view more.
- GCC Physical & Perimeter Security Market Click here to view more.