Chile Pressure Monitoring Market (2026-2032) | Industry, Value, Share, Analysis, Outlook, Size, Growth, Trends, Revenue, Forecast & Companies
Market Forecast By Product Type (BP Monitors/Cardiac Pressure Monitors, Pulmonary Pressure Monitors, Intraocular Pressure Monitors), By Procedure (Noninvasive, Invasive), By Application (Respiratory Disorders, Glaucoma, Cardiac Disorders, Neurological Disorders, Dialysis, Others), By End-Use (Hospitals, Home Care Settings, Ambulatory Surgical Centers and Clinics, Diagnostic Laboratories, Others) And Competitive Landscape
| Product Code: ETC040789 | Publication Date: Jan 2021 | Updated Date: Jun 2026 | Product Type: Report | |
| Publisher: 6Wresearch | Author: Ravi Bhandari | No. of Pages: 70 | No. of Figures: 35 | No. of Tables: 5 |
Chile Pressure Monitoring Market Summary
The chile pressure monitoring market was estimated at USD 222 Million in 2025 and is projected to reach USD 302 Million by 2032, growing at a CAGR of 5.5% from 2026 to 2032.
Chile Pressure Monitoring Market Year-wise Growth Rate and Key Drivers
This graph highlights how the Chile Pressure Monitoring Market has steadily grown over the past five years, supported by major growth factors.
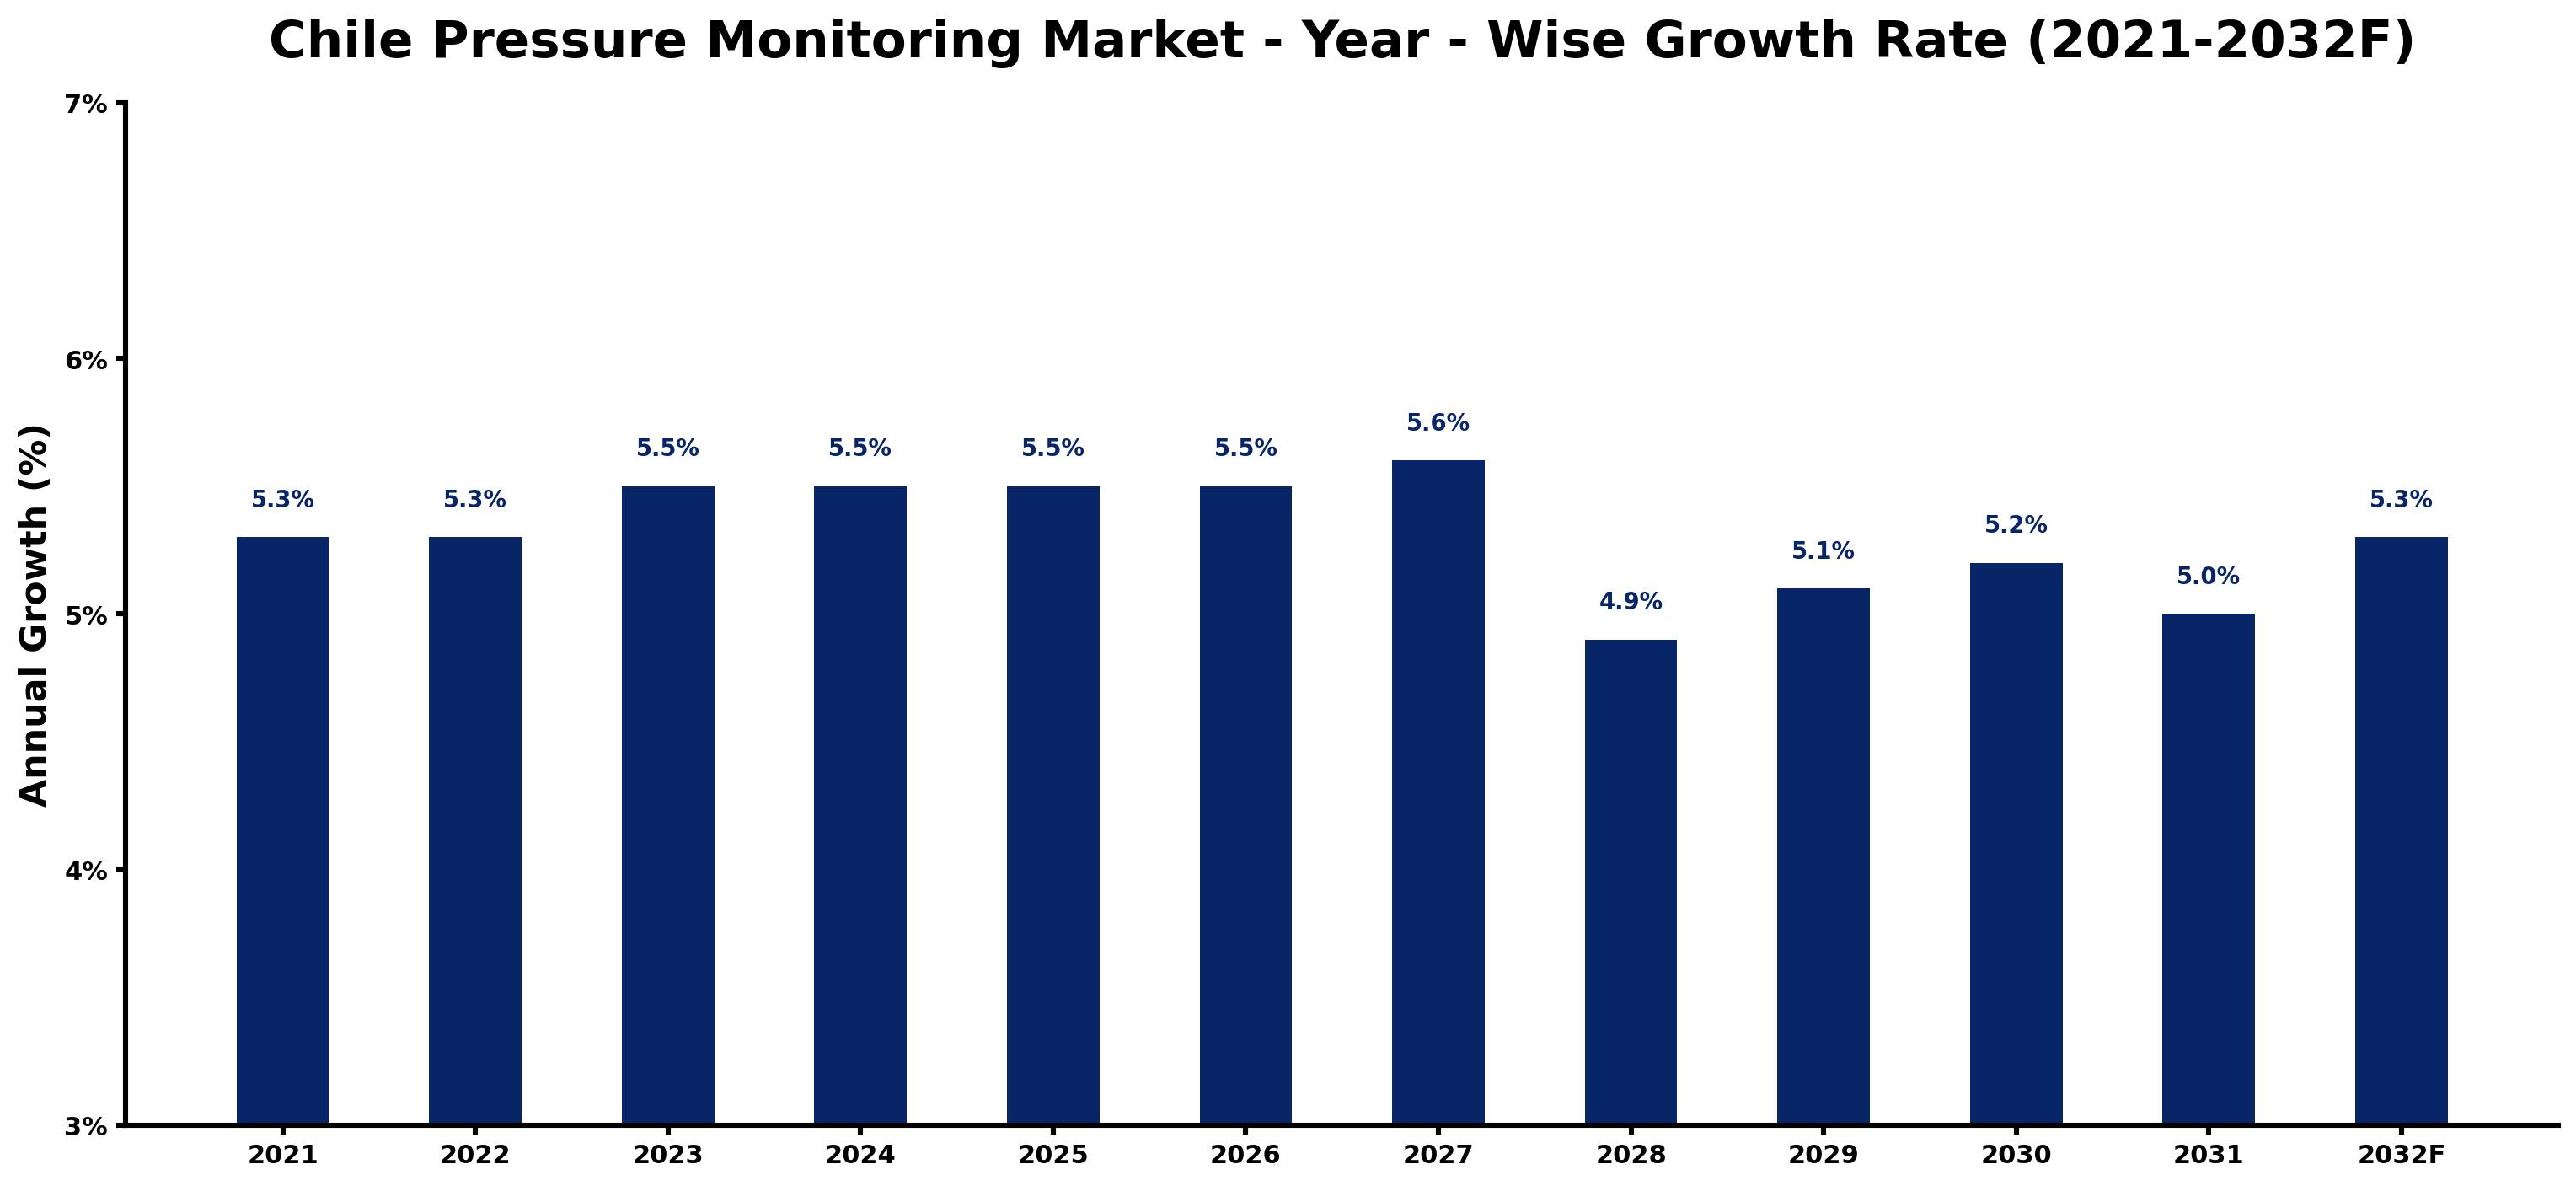
The table below presents the year wise growth rates along with the key drivers influencing the market
| Year | Growth Rate | Major Drivers |
| 2021 | 5.3% | Telehealth services expanded, increasing the need for remote pressure monitoring solutions. |
| 2022 | 5.3% | Healthcare investment surged, bolstering pressure monitoring technology adoption across hospitals. |
| 2023 | 5.5% | Local manufacturers began producing advanced monitoring devices, enhancing market competition and accessibility. |
| 2024 | 5.5% | Chilean healthcare reform emphasized preventive measures, driving demand for consistent monitoring solutions. |
| 2025 | 5.5% | Emergence of digital health platforms created new avenues for pressure monitoring integration. |
| 2026 | 5.5% | Increased awareness of hypertension risks prompted consumers to seek home monitoring devices. |
| 2027 | 5.6% | Technological collaborations between healthcare providers and tech firms fostered innovative monitoring solutions. |
| 2028 | 4.9% | Widespread training programs for healthcare professionals improved product knowledge and utilization. |
| 2029 | 5.1% | Aging population required more frequent monitoring, prompting device enhancements and market expansion. |
| 2030 | 5.2% | Investment in smart healthcare infrastructure facilitated seamless integration of monitoring technologies. |
| 2031 | 5.0% | Competitive pricing strategies from local firms made pressure monitoring devices more accessible. |
| 2032 | 5.3% | Consumer preference shifted towards integrated health solutions, boosting demand for multifunctional devices. |
Note - Market size estimations and growth projections presented in this report are based on 6Wresearch's advanced forecasting approach, validated with industry datasets as of June 2026.
Chile Pressure Monitoring Market Synopsis
The Chile Pressure Monitoring Market is projected to reach 5.5% and witness significant growth during the forecast period (2026-2032). This market encompasses a variety of devices and systems essential for accurately measuring and controlling pressure across multiple sectors, including industrial processes, medical applications, and environmental monitoring. The increasing focus on safety and quality control, alongside the heightened demand for regulatory compliance, is propelling the adoption of pressure monitoring technologies throughout Chile.
Chile Pressure Monitoring Market Growth Drivers
Several key factors are driving the growth of the Chile Pressure Monitoring Market. These drivers include:
- Industrial Automation: The ongoing trend toward automation in industries such as manufacturing and oil & gas is prompting increased reliance on pressure monitoring systems to enhance operational efficiency.
- Process Optimization: The drive for optimized processes in various sectors necessitates precise pressure measurement to maintain product quality and ensure efficient resource use.
- Safety Regulations: Stringent safety regulations in multiple industries, including healthcare and utilities, emphasize the importance of effective pressure monitoring systems as a means to mitigate risks.
- Technological Advancements: Innovations in sensing technologies, along with the integration of IoT solutions, are facilitating the deployment of advanced pressure monitoring systems.
- Demand for Quality Control: The focus on maintaining high standards in product and service delivery is leading to a surge in the need for reliable pressure monitoring solutions.
Chile Pressure Monitoring Market Challenges and Restraints
Despite the promising outlook for the Chile Pressure Monitoring Market, several challenges hinder its growth. These challenges include:
- Limited Healthcare Infrastructure: The infrastructure in place for healthcare services is often not fully equipped to adopt advanced pressure monitoring technologies, which can restrict market growth.
- Budget Constraints: Financial limitations faced by organizations, particularly in the public sector, can inhibit investment in new pressure monitoring solutions.
- Regulatory Hurdles: The complex processes surrounding medical device approvals can delay the introduction of new pressure monitoring technologies into the healthcare sector.
- Technological Barriers: The existing technologies may not always support interoperability, making it challenging to integrate new systems with legacy infrastructure.
- Workforce Shortages: A lack of skilled professionals in the field can impede the adoption and implementation of advanced pressure monitoring systems across various sectors.
Chile Pressure Monitoring Market Opportunities and Trends
The Chile Pressure Monitoring Market presents several opportunities and trends that stakeholders are keen to leverage.
- Emerging Technologies: The incorporation of machine learning and big data analytics into pressure monitoring systems could enhance predictive maintenance and overall operational efficiency.
- Healthcare Innovations: Advancements in medical devices are creating opportunities for more sophisticated pressure monitoring solutions, especially in critical care settings.
- Sustainability Initiatives: Increased regulatory focus on environmental protection is driving demand for pressure monitoring in waste management and pollution control.
- Growth in Renewable Energy: The shift toward renewable energy sources necessitates accurate pressure monitoring systems to ensure operational reliability and efficiency.
- Expanding Industrial Base: As industries in Chile continue to grow, there is an increased need for robust pressure monitoring solutions to support operational demands.
Chile Pressure Monitoring Market Government Investment and Initiatives
Government policies significantly influence the Chile Pressure Monitoring Market, leading to various investment initiatives aimed at enhancing healthcare and industrial capabilities.
- Healthcare Policy Reforms: The Chilean government has been implementing reforms to improve healthcare quality, which includes investment in advanced medical monitoring technologies.
- Public Spending on Infrastructure: Increased public spending in healthcare infrastructure aims to bolster the adoption of modern monitoring technologies across hospitals and clinics.
- Regulatory Frameworks: Stricter regulations surrounding medical device approvals are being developed to ensure patient safety and encourage manufacturers to innovate.
- Support for Industrial Development: As part of economic growth strategies, the government promotes various initiatives that bolster industrial automation and efficiency, integrating pressure monitoring technologies.
- Incentives for Technology Adoption: Programs aimed at encouraging the adoption of advanced technologies across both industrial and healthcare sectors are proving beneficial for market expansion.
Chile Pressure Monitoring Market Latest Developments (May 2025 - June 2026)
In the period between May 2025 and June 2026, notable developments have occurred within the Chile Pressure Monitoring Market. These developments reflect the ongoing technological advancements and regulatory changes shaping the industry.
- The introduction of next-generation pressure sensors has been a significant focus, enhancing accuracy and reliability in industrial applications.
- Regulatory changes concerning medical device approvals have led to streamlined processes, encouraging faster adoption of new technologies in healthcare settings.
- Partnerships between technology firms and healthcare providers have increased, aimed at integrating advanced pressure monitoring solutions into clinical practices.
- Investment in training programs for healthcare professionals has been emphasized to address workforce shortages and improve operational capabilities.
- Environmental monitoring initiatives have seen increased funding, promoting the adoption of pressure monitoring systems in waste management and resource conservation projects.
Chile Pressure Monitoring Market - Key Attractiveness of the Report
- 10 Years of Market Numbers
- Historical Data Starting from 2022 to 2025
- Base Year: 2025
- Forecast Data until 2032
- Key Performance Indicators Impacting the Market
- Major Upcoming Developments and Projects
Key Highlights of the Report:
- Chile Pressure Monitoring Market Outlook
- Market Size of Chile Pressure Monitoring Market, 2025
- Forecast of Chile Pressure Monitoring Market, 2032
- Historical Data and Forecast of Chile Pressure Monitoring Revenues & Volume for the Period 2022-2032F
- Chile Pressure Monitoring Market Trend Evolution
- Chile Pressure Monitoring Market Drivers and Challenges
- Chile Pressure Monitoring Price Trends
- Chile Pressure Monitoring Porter's Five Forces
- Chile Pressure Monitoring Industry Life Cycle
- Historical Data and Forecast of Chile Pressure Monitoring Market Revenues & Volume By Product Type for the Period 2022-2032F
- Historical Data and Forecast of Chile Pressure Monitoring Market Revenues & Volume By BP Monitors/Cardiac Pressure Monitors for the Period 2022-2032F
- Historical Data and Forecast of Chile Pressure Monitoring Market Revenues & Volume By Pulmonary Pressure Monitors for the Period 2022-2032F
- Historical Data and Forecast of Chile Pressure Monitoring Market Revenues & Volume By Intraocular Pressure Monitors for the Period 2022-2032F
- Historical Data and Forecast of Chile Pressure Monitoring Market Revenues & Volume By Procedure for the Period 2022-2032F
- Historical Data and Forecast of Chile Pressure Monitoring Market Revenues & Volume By Noninvasive for the Period 2022-2032F
- Historical Data and Forecast of Chile Pressure Monitoring Market Revenues & Volume By Invasive for the Period 2022-2032F
- Historical Data and Forecast of Chile Pressure Monitoring Market Revenues & Volume By Application for the Period 2022-2032F
- Historical Data and Forecast of Chile Pressure Monitoring Market Revenues & Volume By Respiratory Disorders for the Period 2022-2032F
- Historical Data and Forecast of Chile Pressure Monitoring Market Revenues & Volume By Glaucoma for the Period 2022-2032F
- Historical Data and Forecast of Chile Pressure Monitoring Market Revenues & Volume By Cardiac Disorders for the Period 2022-2032F
- Historical Data and Forecast of Chile Pressure Monitoring Market Revenues & Volume By Neurological Disorders for the Period 2022-2032F
- Historical Data and Forecast of Chile Pressure Monitoring Market Revenues & Volume By Dialysis for the Period 2022-2032F
- Historical Data and Forecast of Chile Pressure Monitoring Market Revenues & Volume By Others for the Period 2022-2032F
- Historical Data and Forecast of Chile Pressure Monitoring Market Revenues & Volume By End-Use for the Period 2022-2032F
- Historical Data and Forecast of Chile Pressure Monitoring Market Revenues & Volume By Hospitals for the Period 2022-2032F
- Historical Data and Forecast of Chile Pressure Monitoring Market Revenues & Volume By Home Care Settings for the Period 2022-2032F
- Historical Data and Forecast of Chile Pressure Monitoring Market Revenues & Volume By Ambulatory Surgical Centers and Clinics for the Period 2022-2032F
- Historical Data and Forecast of Chile Pressure Monitoring Market Revenues & Volume By Diagnostic Laboratories for the Period 2022-2032F
- Historical Data and Forecast of Chile Pressure Monitoring Market Revenues & Volume By Others for the Period 2022-2032F
- Chile Pressure Monitoring Import Export Trade Statistics
- Market Opportunity Assessment By Product Type
- Market Opportunity Assessment By Procedure
- Market Opportunity Assessment By Application
- Market Opportunity Assessment By End-Use
- Chile Pressure Monitoring Top Companies Market Share
- Chile Pressure Monitoring Competitive Benchmarking By Technical and Operational Parameters
- Chile Pressure Monitoring Company Profiles
- Chile Pressure Monitoring Key Strategic Recommendations
Frequently Asked Questions About the Market Study (FAQs):
The primary drivers include industrial automation, safety regulations, and the need for process optimization across various sectors.
Challenges include limited healthcare infrastructure, budget constraints, and regulatory hurdles for medical device approvals.
Government initiatives are promoting investment in healthcare infrastructure and establishing regulatory frameworks that facilitate the adoption of advanced pressure monitoring technologies.
The market is expected to experience significant growth, driven by technological advancements and increasing demand for quality control in various industries.
6Wresearch actively monitors the Chile Pressure Monitoring Market and publishes its comprehensive annual report, highlighting emerging trends, growth drivers, revenue analysis, and forecast outlook. Our insights help businesses to make data-backed strategic decisions with ongoing market dynamics. Our analysts track relevent industries related to the Chile Pressure Monitoring Market, allowing our clients with actionable intelligence and reliable forecasts tailored to emerging regional needs.
Yes, we provide customisation as per your requirements. To learn more, feel free to contact us on sales@6wresearch.com
1 Executive Summary |
2 Introduction |
2.1 Key Highlights of the Report |
2.2 Report Description |
2.3 Market Scope & Segmentation |
2.4 Research Methodology |
2.5 Assumptions |
3 Chile Pressure Monitoring Market Overview |
3.1 Chile Country Macro Economic Indicators |
3.2 Chile Pressure Monitoring Market Revenues & Volume, 2022 & 2032F |
3.3 Chile Pressure Monitoring Market - Industry Life Cycle |
3.4 Chile Pressure Monitoring Market - Porter's Five Forces |
3.5 Chile Pressure Monitoring Market Revenues & Volume Share, By Product Type, 2022 & 2032F |
3.6 Chile Pressure Monitoring Market Revenues & Volume Share, By Procedure, 2022 & 2032F |
3.7 Chile Pressure Monitoring Market Revenues & Volume Share, By Application, 2022 & 2032F |
3.8 Chile Pressure Monitoring Market Revenues & Volume Share, By End-Use, 2022 & 2032F |
4 Chile Pressure Monitoring Market Dynamics |
4.1 Impact Analysis |
4.2 Market Drivers |
4.3 Market Restraints |
5 Chile Pressure Monitoring Market Trends |
6 Chile Pressure Monitoring Market, By Types |
6.1 Chile Pressure Monitoring Market, By Product Type |
6.1.1 Overview and Analysis |
6.1.2 Chile Pressure Monitoring Market Revenues & Volume, By Product Type, 2022-2032F |
6.1.3 Chile Pressure Monitoring Market Revenues & Volume, By BP Monitors/Cardiac Pressure Monitors, 2022-2032F |
6.1.4 Chile Pressure Monitoring Market Revenues & Volume, By Pulmonary Pressure Monitors, 2022-2032F |
6.1.5 Chile Pressure Monitoring Market Revenues & Volume, By Intraocular Pressure Monitors, 2022-2032F |
6.2 Chile Pressure Monitoring Market, By Procedure |
6.2.1 Overview and Analysis |
6.2.2 Chile Pressure Monitoring Market Revenues & Volume, By Noninvasive, 2022-2032F |
6.2.3 Chile Pressure Monitoring Market Revenues & Volume, By Invasive, 2022-2032F |
6.3 Chile Pressure Monitoring Market, By Application |
6.3.1 Overview and Analysis |
6.3.2 Chile Pressure Monitoring Market Revenues & Volume, By Respiratory Disorders, 2022-2032F |
6.3.3 Chile Pressure Monitoring Market Revenues & Volume, By Glaucoma, 2022-2032F |
6.3.4 Chile Pressure Monitoring Market Revenues & Volume, By Cardiac Disorders, 2022-2032F |
6.3.5 Chile Pressure Monitoring Market Revenues & Volume, By Neurological Disorders, 2022-2032F |
6.3.6 Chile Pressure Monitoring Market Revenues & Volume, By Dialysis, 2022-2032F |
6.3.7 Chile Pressure Monitoring Market Revenues & Volume, By Others, 2022-2032F |
6.4 Chile Pressure Monitoring Market, By End-Use |
6.4.1 Overview and Analysis |
6.4.2 Chile Pressure Monitoring Market Revenues & Volume, By Hospitals, 2022-2032F |
6.4.3 Chile Pressure Monitoring Market Revenues & Volume, By Home Care Settings, 2022-2032F |
6.4.4 Chile Pressure Monitoring Market Revenues & Volume, By Ambulatory Surgical Centers and Clinics, 2022-2032F |
6.4.5 Chile Pressure Monitoring Market Revenues & Volume, By Diagnostic Laboratories, 2022-2032F |
6.4.6 Chile Pressure Monitoring Market Revenues & Volume, By Others, 2022-2032F |
7 Chile Pressure Monitoring Market Import-Export Trade Statistics |
7.1 Chile Pressure Monitoring Market Export to Major Countries |
7.2 Chile Pressure Monitoring Market Imports from Major Countries |
8 Chile Pressure Monitoring Market Key Performance Indicators |
9 Chile Pressure Monitoring Market - Opportunity Assessment |
9.1 Chile Pressure Monitoring Market Opportunity Assessment, By Product Type, 2022 & 2032F |
9.2 Chile Pressure Monitoring Market Opportunity Assessment, By Procedure, 2022 & 2032F |
9.3 Chile Pressure Monitoring Market Opportunity Assessment, By Application, 2022 & 2032F |
9.4 Chile Pressure Monitoring Market Opportunity Assessment, By End-Use, 2022 & 2032F |
10 Chile Pressure Monitoring Market - Competitive Landscape |
10.1 Chile Pressure Monitoring Market Revenue Share, By Companies, 2025 |
10.2 Chile Pressure Monitoring Market Competitive Benchmarking, By Operating and Technical Parameters |
11 Company Profiles |
12 Recommendations |
13 Disclaimer |
Global Go To Market Strategy - 2030
Export potential enables firms to identify high-growth global markets with greater confidence by combining advanced trade intelligence with a structured quantitative methodology. The framework analyzes emerging demand trends and country-level import patterns while integrating macroeconomic and trade datasets such as GDP and population forecasts, bilateral import–export flows, tariff structures, elasticity differentials between developed and developing economies, geographic distance, and import demand projections. Using weighted trade values from 2020–2024 as the base period to project country-to-country export potential for 2030, these inputs are operationalized through calculated drivers such as gravity model parameters, tariff impact factors, and projected GDP per-capita growth. Through an analysis of hidden potentials, demand hotspots, and market conditions that are most favorable to success, this method enables firms to focus on target countries, maximize returns, and global expansion with data, backed by accuracy.
By factoring in the projected importer demand gap that is currently unmet and could be potential opportunity, it identifies the potential for the Exporter (Country) among 190 countries, against the general trade analysis, which identifies the biggest importer or exporter.
To discover high-growth global markets and optimize your business strategy:
Click Here
Pricing
- Single User License$ 1,995
- Department License$ 2,400
- Site License$ 3,120
- Global License$ 3,795

Leadership Perspectives from Industry Events
Search
Thought Leadership and Analyst Meet


Our Clients
6WResearch In News
- India Air Conditioner Market Set for Strong Rebound in 2026 After Weather-Led Correction and GST-Driven Recovery: 6Wresearch
- ADAS in India: How Automatic Emergency Braking, Blind Spot Detection & Driver Monitoring are Transforming Road Safety
- Doha a strategic location for EV manufacturing hub: IPA Qatar
- Demand for luxury TVs surging in the GCC, says Samsung
- Empowering Growth: The Thriving Journey of Bangladesh’s Cable Industry
- Demand for luxury TVs surging in the GCC, says Samsung
Latest Reports
- Nicaragua RPG Gaming Market (2026-2032)
- New Zealand RPG Gaming Market (2026-2032)
- Netherlands RPG Gaming Market (2026-2032)
- Nauru RPG Gaming Market (2026-2032)
- Namibia RPG Gaming Market (2026-2032)
- Mozambique RPG Gaming Market (2026-2032)
- Montenegro RPG Gaming Market (2026-2032)
- Mongolia RPG Gaming Market (2026-2032)
- Monaco RPG Gaming Market (2026-2032)
- Micronesia RPG Gaming Market (2026-2032)
Industry Events and Analyst Meet

EV India Expo 2026

HIMTEX 2026

India Refining Summit 2026

India EV Show 2026

EV tech India Expo 2026
Whitepaper
- Middle East & Africa Commercial Security Market Click here to view more.
- Middle East & Africa Fire Safety Systems & Equipment Market Click here to view more.
- GCC Drone Market Click here to view more.
- Middle East Lighting Fixture Market Click here to view more.
- GCC Physical & Perimeter Security Market Click here to view more.