Chile Underground Utility Mapping Market Size & Growth Rate (2026-2032)
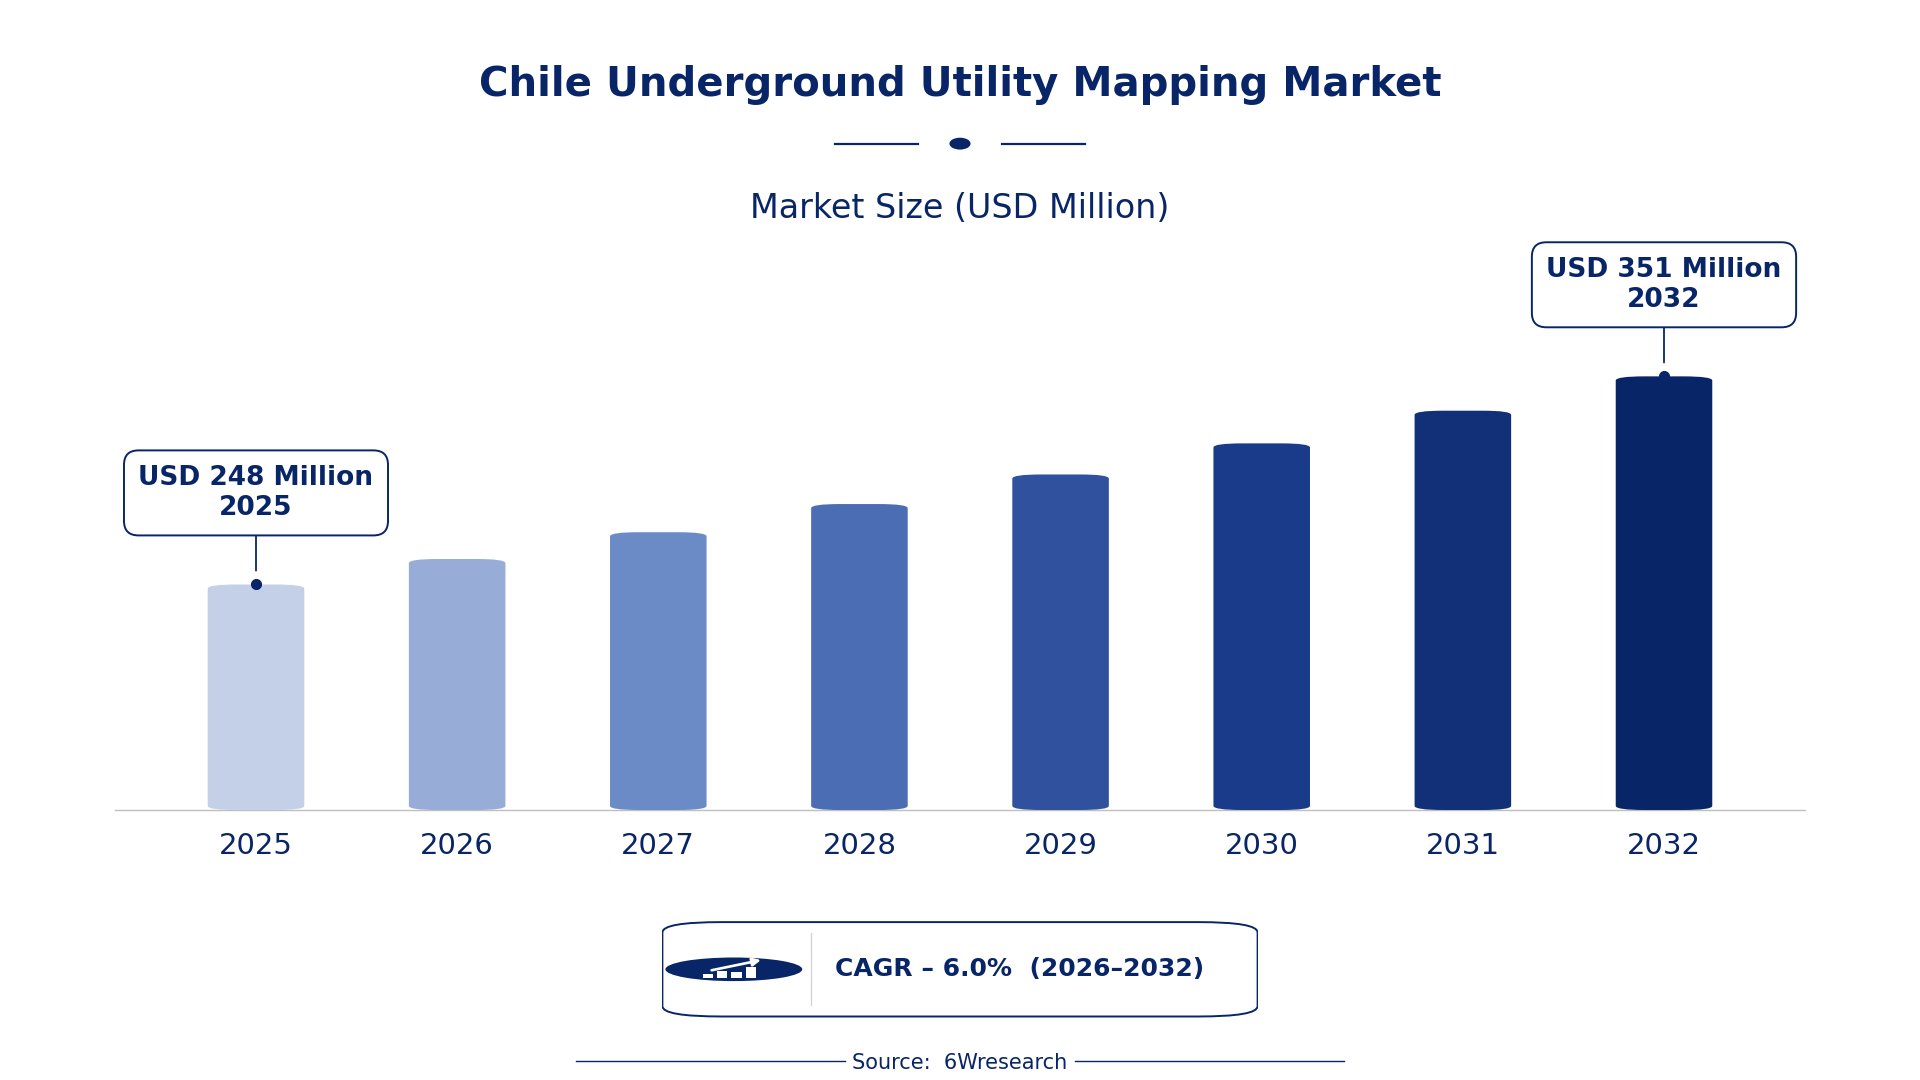
The Chile Underground Utility Mapping Market was estimated at USD 248 Million in 2025 and is projected to reach USD 351 Million by 2032, growing at a CAGR of 6.0% from 2026 to 2032.
Chile Underground Utility Mapping Market Synopsis
A heightened focus on infrastructure management is currently shaping the Chile Underground Utility Mapping Market. As urban development accelerates, the demand for accurate mapping of underground utilities has become critical for various stakeholders, including government agencies and construction firms.
Technologies such as ground-penetrating radar (GPR) and geographic information systems (GIS) are essential tools in this sector. They enhance the precision of utility identification, enabling better planning and minimizing the risk of costly service disruptions during excavation activities.
Chile Underground Utility Mapping Market Year-wise Growth Rate and Key Drivers
This graph illustrates the annual growth rates of the Chile Underground Utility Mapping Market from 2021 to 2032, highlighting a steady upward trajectory and projected expansion over the forecast period.
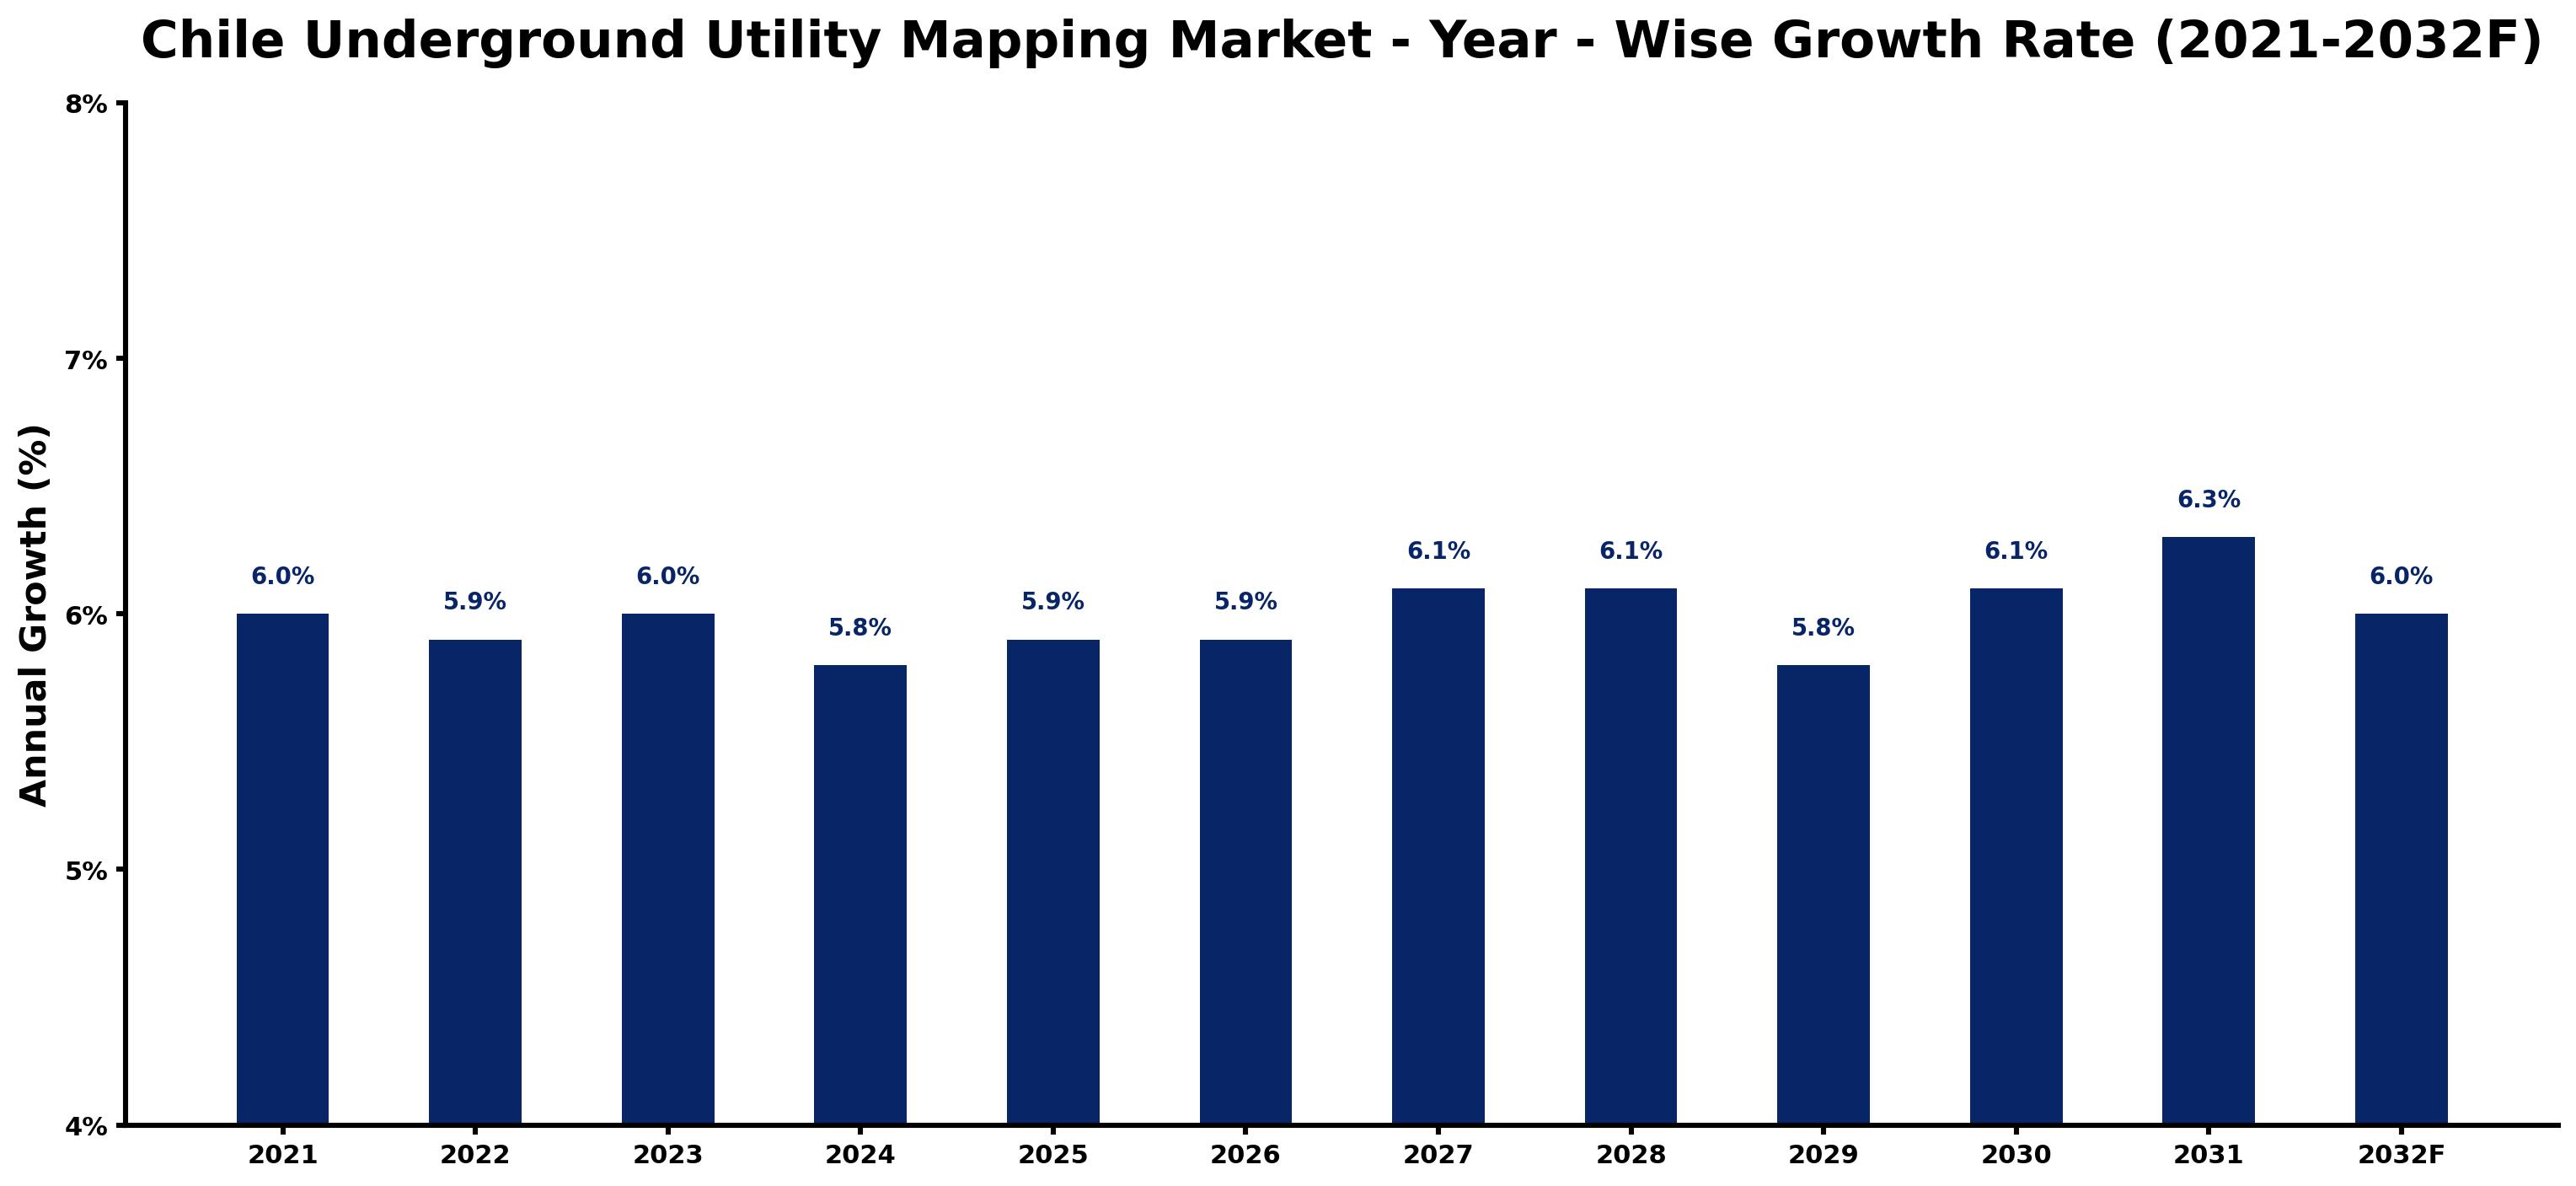
The table below presents the year‑wise growth rates along with the key drivers influencing the market
| Year | Growth Rate | Major Drivers |
| 2021 | 6.0% | Increased urbanization driving demand for accurate mapping. |
| 2022 | 5.9% | National utility regulation enforcing better infrastructure documentation. |
| 2023 | 6.0% | Government initiatives promoting smart city utility management. |
| 2024 | 5.8% | Rising focus on environmental compliance in construction projects. |
| 2025 | 5.9% | Enhanced adoption of 3D mapping technologies in utilities. |
| 2026 | 5.9% | Growing investments in infrastructure maintenance and safety protocols. |
| 2027 | 6.1% | Regional collaboration for robust underground mapping standards. |
| 2028 | 6.1% | Local demand for GIS integration in urban planning. |
| 2029 | 5.8% | Increased public-private partnerships for utility mapping innovation. |
| 2030 | 6.1% | Urban infrastructure developments requiring precise utility location data. |
| 2031 | 6.3% | Rising awareness of public safety linked to underground mapping. |
| 2032 | 6.0% | Sustainable development policies enhancing utility mapping relevance. |
Note: Market size estimations and growth projections presented in this report are based on 6Wresearch's proprietary forecasting methodology, utilizing the latest available industry data, government publications, and primary research inputs.
Chile Underground Utility Mapping Market Key Takeaways
Below are some of the specific key takeaways from the market, including:
- The demand for underground utility mapping services is driven by increasing infrastructure projects across Chile.
- Technological advancements in GPR and GIS have improved the accuracy of mapping utilities.
- Integration challenges in data collection and interoperability remain significant barriers to market growth.
- Government regulations are evolving to promote better mapping practices and data sharing among stakeholders.
- Investment opportunities are emerging as urban areas expand and require comprehensive utility mapping solutions.
Evaluation of Restraints in Chile Underground Utility Mapping Market
Several constraints hinder the growth of the Chile Underground Utility Mapping Market. Key among these are the challenges related to accuracy and data integration. Stakeholders increasingly demand precise technologies to identify underground utilities effectively, which is crucial to avoid damage during construction activities. The complexities of urban environments further complicate mapping efforts, as the risk of service disruptions grows without the right data. Providers must continually adapt to these challenges to meet the rising expectations of infrastructure development.
Chile Underground Utility Mapping Market Trends
The shift towards smart city initiatives is influencing the Chile Underground Utility Mapping Market. As cities aim for efficiency and sustainability, the integration of real-time data analytics into mapping technologies is gaining traction. on top of that, the growing emphasis on safety in construction processes is driving up the demand for precise utility mapping solutions. Collaboration between technology providers and construction firms is also on the rise, reflecting a trend towards comprehensive mapping and data-sharing practices.
Chile Underground Utility Mapping Market Opportunities
There are numerous avenues for growth within the Chile Underground Utility Mapping Market. As urbanization accelerates, investment in underground mapping technologies is essential for efficient infrastructure management. Companies that can offer innovative solutions, particularly those focused on enhancing data accuracy and real-time updates, will find lucrative opportunities. on top of that, partnerships between public and private sectors can lead to significant advancements in utility mapping initiatives.
Government Initiatives in the Chile Underground Utility Mapping Market
Government policies are increasingly shaping the Chile Underground Utility Mapping Market by establishing standards and encouraging collaboration among stakeholders. The emphasis on accurate utility mapping is reflected in recent regulatory measures aimed at promoting data sharing and mapping accuracy. As urban infrastructure evolves, these policies are crucial for minimizing disruptions and enhancing safety in construction projects.
- A regulatory framework introduced in 2025 mandating utility mapping accuracy standards for new construction projects.
- A national initiative launched in mid-2025 to improve collaboration between municipal governments and utility companies in mapping efforts.
- Ongoing development of a centralized mapping database to facilitate better data integration and sharing among stakeholders.
- Upcoming workshops planned for late 2026 to educate utility companies on the benefits of advanced mapping technologies.
Future Insights of the Chile Underground Utility Mapping Market
Looking ahead to 2026-2032, the Chile Underground Utility Mapping Market is expected to experience steady growth, fueled by increasing urban development and infrastructure investments. The demand for advanced mapping solutions will likely rise as cities prioritize safety and efficiency. Additionally, the integration of emerging technologies such as AI and machine learning into mapping processes is set to enhance accuracy and operational efficiency, positioning the market for significant advancements.
Chile Underground Utility Mapping Market Latest Developments
In the last 12-14 months, the Chile Underground Utility Mapping Market has witnessed notable activities, with a focus on technological advancements and improved collaboration among stakeholders. Companies are increasingly investing in cutting-edge technologies to enhance mapping accuracy and data integration capabilities, while government initiatives are fostering a more conducive environment for innovation.
- A major technology vendor launched an updated GPR system in early 2025, enhancing the precision of underground utility detection.
- An ongoing partnership between local authorities and utility providers aims to create a comprehensive underground mapping database, initiated in late 2025.
- A public-private initiative focusing on urban safety improvements through better mapping practices is currently underway, expected to yield results by mid-2026.
- Plans for a nationwide campaign to promote awareness of utility mapping technologies are set to kick off in Q1 2027.
Chile Underground Utility Mapping Market - Key Attractiveness of the Report
- 10 Years of Market Numbers
- Historical Data Starting from 2022 to 2025
- Base Year: 2025
- Forecast Data until 2032
- Key Performance Indicators Impacting the Market
- Major Upcoming Developments and Projects
Key Highlights of the Report:
- Chile Underground Utility Mapping Market Outlook
- Market Size of Chile Underground Utility Mapping Market, 2025
- Forecast of Chile Underground Utility Mapping Market, 2032
- Historical Data and Forecast of Chile Underground Utility Mapping Revenues & Volume for the Period 2022-2032F
- Chile Underground Utility Mapping Market Trend Evolution
- Chile Underground Utility Mapping Market Drivers and Challenges
- Chile Underground Utility Mapping Price Trends
- Chile Underground Utility Mapping Porter's Five Forces
- Chile Underground Utility Mapping Industry Life Cycle
- Historical Data and Forecast of Chile Underground Utility Mapping Market Revenues & Volume By Component for the Period 2022-2032F
- Historical Data and Forecast of Chile Underground Utility Mapping Market Revenues & Volume By Technological Solutions for the Period 2022-2032F
- Historical Data and Forecast of Chile Underground Utility Mapping Market Revenues & Volume By Services for the Period 2022-2032F
- Historical Data and Forecast of Chile Underground Utility Mapping Market Revenues & Volume By Vertical for the Period 2022-2032F
- Historical Data and Forecast of Chile Underground Utility Mapping Market Revenues & Volume By Oil & Gas for the Period 2022-2032F
- Historical Data and Forecast of Chile Underground Utility Mapping Market Revenues & Volume By Electricity for the Period 2022-2032F
- Historical Data and Forecast of Chile Underground Utility Mapping Market Revenues & Volume By Government & Public Safety for the Period 2022-2032F
- Historical Data and Forecast of Chile Underground Utility Mapping Market Revenues & Volume By Construction for the Period 2022-2032F
- Historical Data and Forecast of Chile Underground Utility Mapping Market Revenues & Volume By Telecommunication for the Period 2022-2032F
- Historical Data and Forecast of Chile Underground Utility Mapping Market Revenues & Volume By Others for the Period 2022-2032F
- Chile Underground Utility Mapping Import Export Trade Statistics
- Market Opportunity Assessment By Component
- Market Opportunity Assessment By Vertical
- Chile Underground Utility Mapping Top Companies Market Share
- Chile Underground Utility Mapping Competitive Benchmarking By Technical and Operational Parameters
- Chile Underground Utility Mapping Company Profiles
- Chile Underground Utility Mapping Key Strategic Recommendations