China Bituminous Coal Market (2025-2031) Outlook | Growth, Size, Value, Industry, Revenue, Share, Companies, Trends, Analysis & Forecast
Market Forecast By Product Type (Gas Coal, Fat Coal, Lean Coal, Long Flame Coal, Other), By Applications (Electricity Industry, Chemical Industry, Cement Industry, Steel Industry, Other) And Competitive Landscape
| Product Code: ETC233721 | Publication Date: Aug 2022 | Updated Date: Oct 2025 | Product Type: Market Research Report | |
| Publisher: 6Wresearch | Author: Ravi Bhandari | No. of Pages: 75 | No. of Figures: 35 | No. of Tables: 20 |
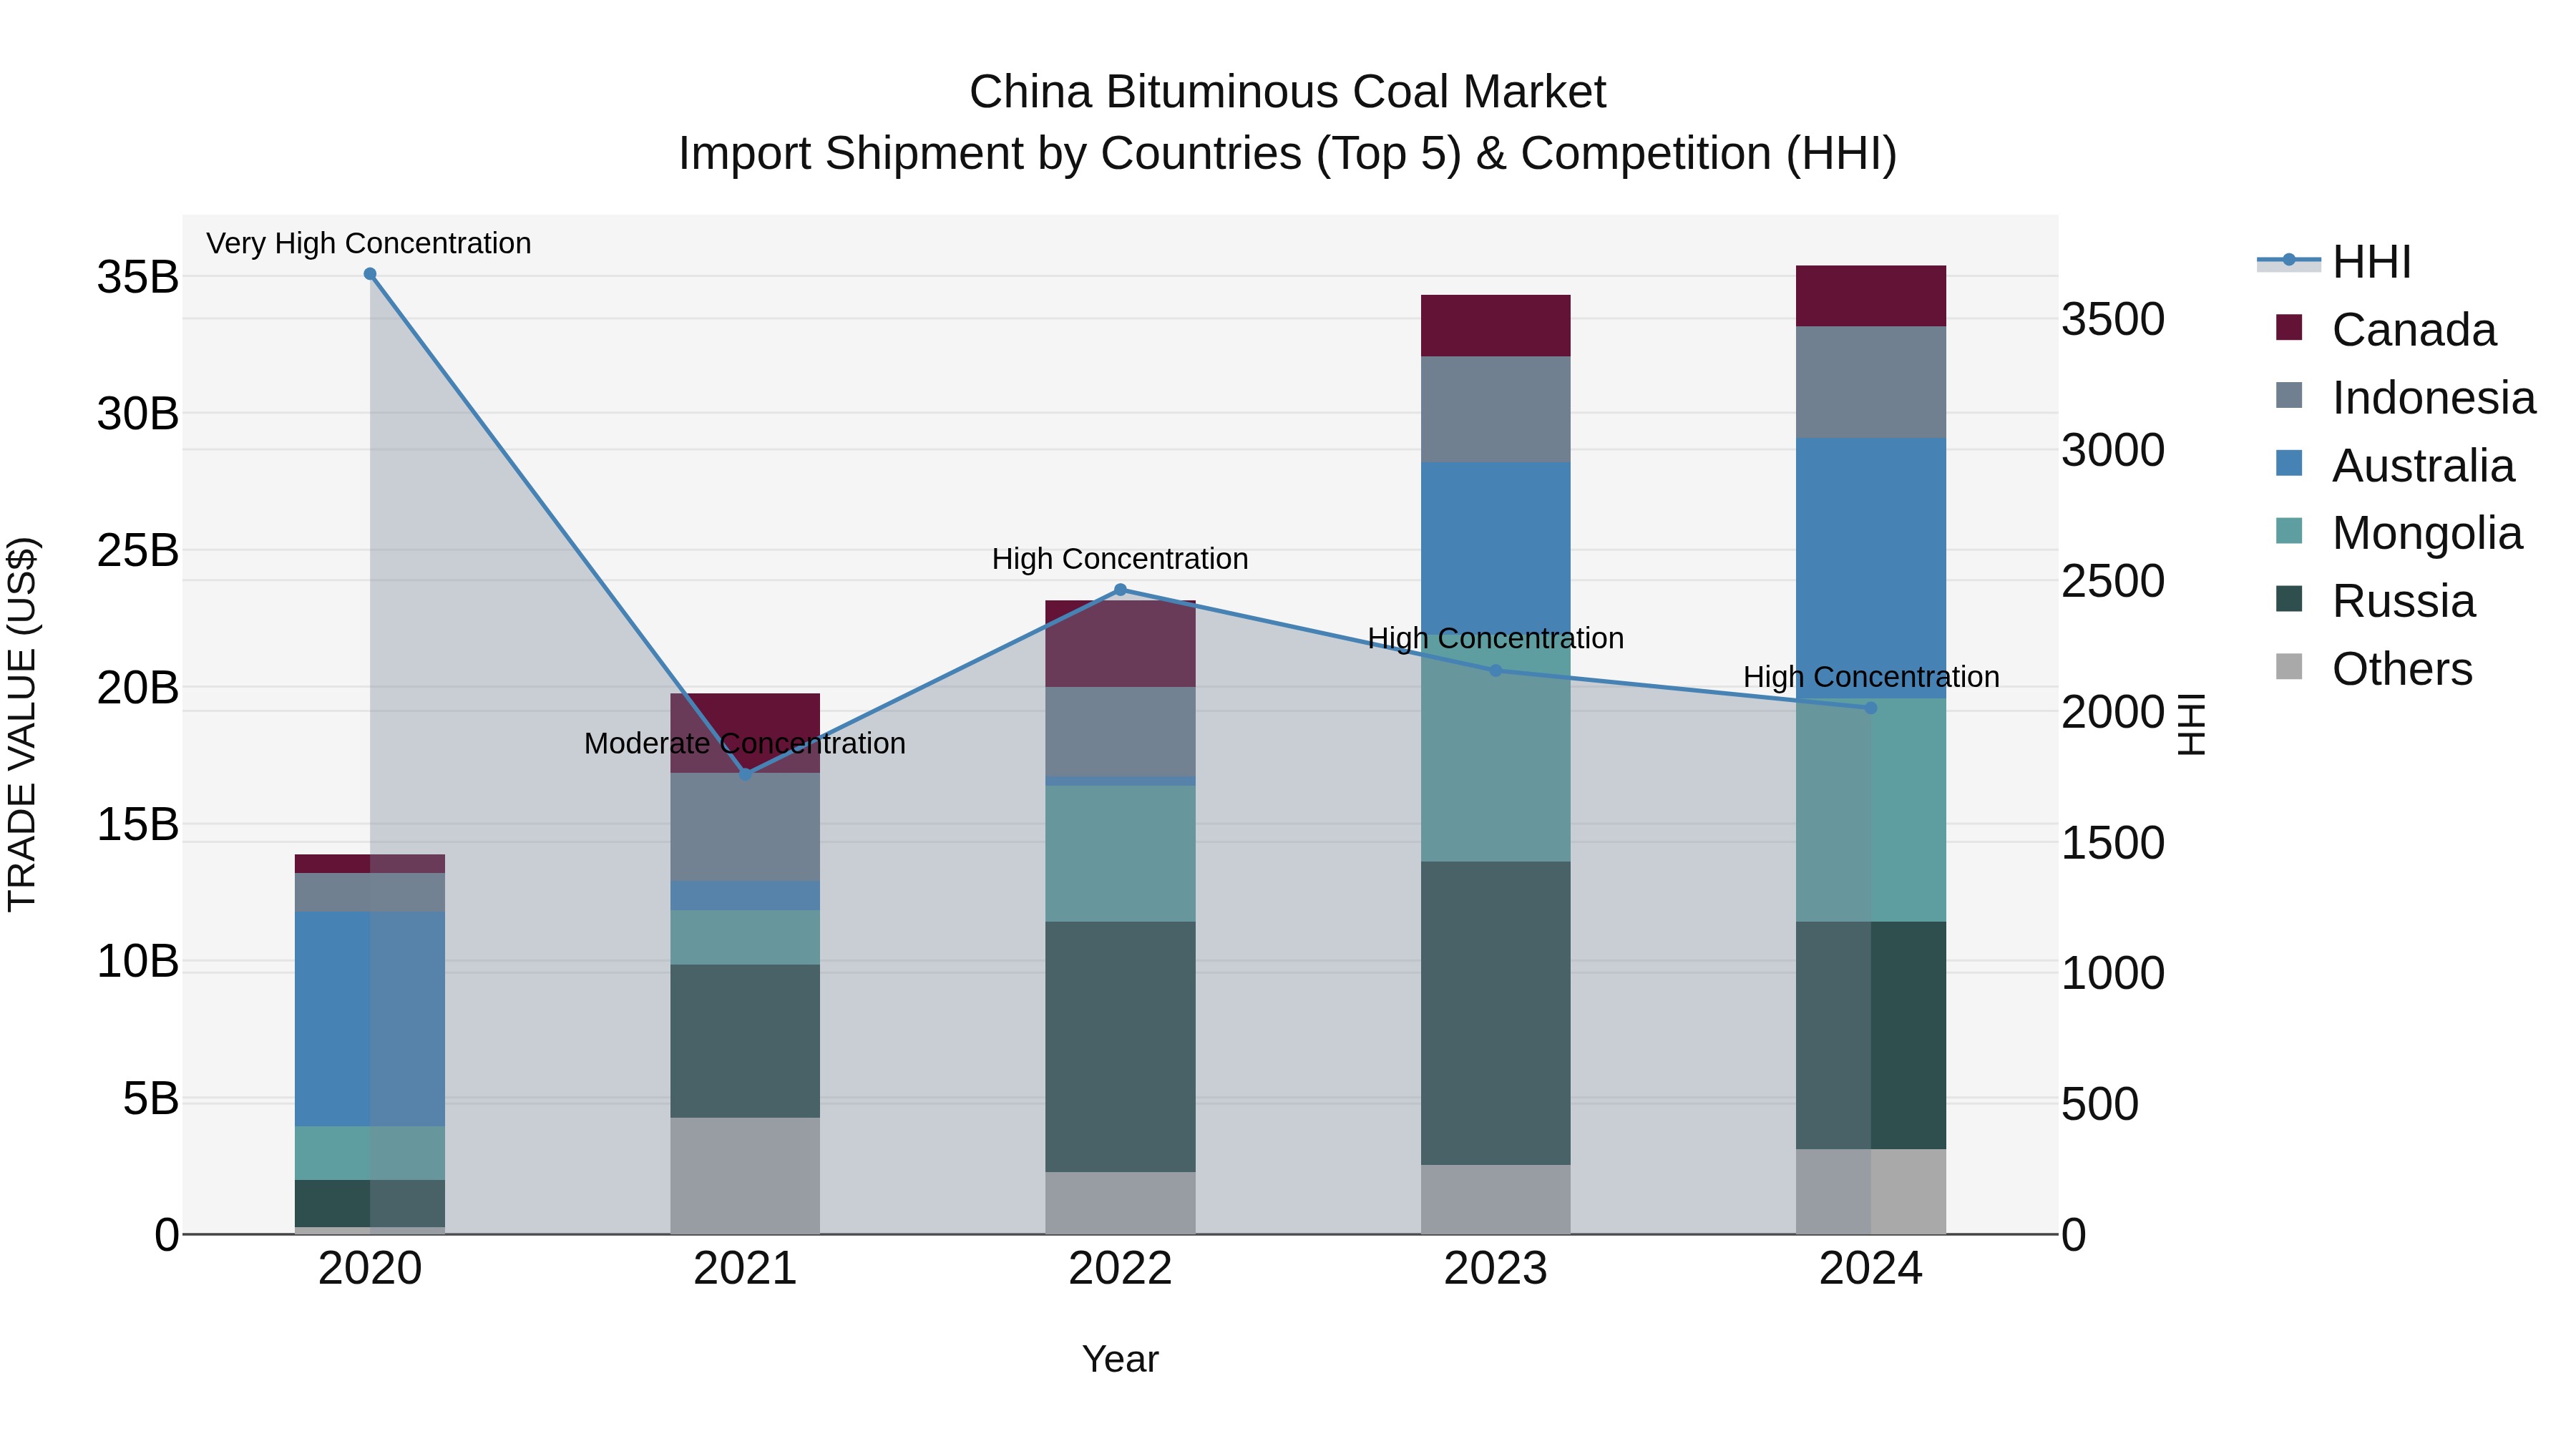
China Bituminous Coal Market Top 5 Importing Countries and Market Competition (HHI) Analysis
China bituminous coal import market showed resilience in 2024, with top exporters being Australia, Russia, Mongolia, Indonesia, and Canada. The High Herfindahl-Hirschman Index (HHI) indicates continued concentration in the market. The impressive Compound Annual Growth Rate (CAGR) of 26.35% from 2020 to 2024 demonstrates sustained demand. Despite a slight dip in the growth rate from 2023 to 2024 at 3.09%, the market remains robust with these key players dominating the import landscape.
China Bituminous Coal Market Overview
The bituminous coal market in China is influenced by the country`s significant energy demands and its reliance on coal as a primary energy source. Bituminous coal, known for its high energy content, is used extensively in power generation and industrial applications. The market is driven by robust infrastructure development and industrial growth. However, environmental concerns and government policies aimed at reducing coal dependence pose challenges to the market. The shift towards cleaner energy sources and stricter emission standards are likely to impact the long-term demand for bituminous coal.
Drivers of the market
The bituminous coal market in China is primarily driven by its significant role in power generation and industrial applications. The countrys heavy reliance on coal for electricity production and its use in steel manufacturing fuels demand. Additionally, advancements in coal processing technologies and efforts to improve coal quality also contribute to market growth.
Challenges of the market
The China Bituminous Coal market is challenged by environmental regulations and the push towards cleaner energy sources. The coal industry is under pressure to reduce emissions and environmental impact, which can increase operational costs and limit growth opportunities. Furthermore, fluctuating coal prices and competition from alternative energy sources add to the market`s instability.
Government Policy of the market
Chinas policies regarding the bituminous coal market are shaped by its energy strategy and environmental goals. The government has implemented measures to reduce coal consumption and promote cleaner energy sources. These policies include restrictions on the use of bituminous coal in urban areas and incentives for transitioning to alternative fuels. Additionally, the government regulates coal production and quality to ensure environmental compliance and reduce emissions from coal-fired power plants.
Key Highlights of the Report:
- China Bituminous Coal Market Outlook
- Market Size of China Bituminous Coal Market, 2024
- Forecast of China Bituminous Coal Market, 2031
- Historical Data and Forecast of China Bituminous Coal Revenues & Volume for the Period 2021-2031
- China Bituminous Coal Market Trend Evolution
- China Bituminous Coal Market Drivers and Challenges
- China Bituminous Coal Price Trends
- China Bituminous Coal Porter's Five Forces
- China Bituminous Coal Industry Life Cycle
- Historical Data and Forecast of China Bituminous Coal Market Revenues & Volume By Product Type for the Period 2021-2031
- Historical Data and Forecast of China Bituminous Coal Market Revenues & Volume By Gas Coal for the Period 2021-2031
- Historical Data and Forecast of China Bituminous Coal Market Revenues & Volume By Fat Coal for the Period 2021-2031
- Historical Data and Forecast of China Bituminous Coal Market Revenues & Volume By Lean Coal for the Period 2021-2031
- Historical Data and Forecast of China Bituminous Coal Market Revenues & Volume By Long Flame Coal for the Period 2021-2031
- Historical Data and Forecast of China Bituminous Coal Market Revenues & Volume By Other for the Period 2021-2031
- Historical Data and Forecast of China Bituminous Coal Market Revenues & Volume By Applications for the Period 2021-2031
- Historical Data and Forecast of China Bituminous Coal Market Revenues & Volume By Electricity Industry for the Period 2021-2031
- Historical Data and Forecast of China Bituminous Coal Market Revenues & Volume By Chemical Industry for the Period 2021-2031
- Historical Data and Forecast of China Bituminous Coal Market Revenues & Volume By Cement Industry for the Period 2021-2031
- Historical Data and Forecast of China Bituminous Coal Market Revenues & Volume By Steel Industry for the Period 2021-2031
- Historical Data and Forecast of China Bituminous Coal Market Revenues & Volume By Other for the Period 2021-2031
- China Bituminous Coal Import Export Trade Statistics
- Market Opportunity Assessment By Product Type
- Market Opportunity Assessment By Applications
- China Bituminous Coal Top Companies Market Share
- China Bituminous Coal Competitive Benchmarking By Technical and Operational Parameters
- China Bituminous Coal Company Profiles
- China Bituminous Coal Key Strategic Recommendations
Frequently Asked Questions About the Market Study (FAQs):
6Wresearch actively monitors the China Bituminous Coal Market and publishes its comprehensive annual report, highlighting emerging trends, growth drivers, revenue analysis, and forecast outlook. Our insights help businesses to make data-backed strategic decisions with ongoing market dynamics. Our analysts track relevent industries related to the China Bituminous Coal Market, allowing our clients with actionable intelligence and reliable forecasts tailored to emerging regional needs.
Yes, we provide customisation as per your requirements. To learn more, feel free to contact us on sales@6wresearch.com
1 Executive Summary |
2 Introduction |
2.1 Key Highlights of the Report |
2.2 Report Description |
2.3 Market Scope & Segmentation |
2.4 Research Methodology |
2.5 Assumptions |
3 China Bituminous Coal Market Overview |
3.1 China Country Macro Economic Indicators |
3.2 China Bituminous Coal Market Revenues & Volume, 2021 & 2031F |
3.3 China Bituminous Coal Market - Industry Life Cycle |
3.4 China Bituminous Coal Market - Porter's Five Forces |
3.5 China Bituminous Coal Market Revenues & Volume Share, By Product Type, 2021 & 2031F |
3.6 China Bituminous Coal Market Revenues & Volume Share, By Applications, 2021 & 2031F |
4 China Bituminous Coal Market Dynamics |
4.1 Impact Analysis |
4.2 Market Drivers |
4.2.1 Increasing demand for energy in China |
4.2.2 Growth in infrastructure development projects |
4.2.3 Government support and investment in the coal industry |
4.3 Market Restraints |
4.3.1 Environmental concerns and pressure to reduce carbon emissions |
4.3.2 Competition from alternative energy sources |
4.3.3 Fluctuating international coal prices |
5 China Bituminous Coal Market Trends |
6 China Bituminous Coal Market, By Types |
6.1 China Bituminous Coal Market, By Product Type |
6.1.1 Overview and Analysis |
6.1.2 China Bituminous Coal Market Revenues & Volume, By Product Type, 2021-2031F |
6.1.3 China Bituminous Coal Market Revenues & Volume, By Gas Coal, 2021-2031F |
6.1.4 China Bituminous Coal Market Revenues & Volume, By Fat Coal, 2021-2031F |
6.1.5 China Bituminous Coal Market Revenues & Volume, By Lean Coal, 2021-2031F |
6.1.6 China Bituminous Coal Market Revenues & Volume, By Long Flame Coal, 2021-2031F |
6.1.7 China Bituminous Coal Market Revenues & Volume, By Other, 2021-2031F |
6.2 China Bituminous Coal Market, By Applications |
6.2.1 Overview and Analysis |
6.2.2 China Bituminous Coal Market Revenues & Volume, By Electricity Industry, 2021-2031F |
6.2.3 China Bituminous Coal Market Revenues & Volume, By Chemical Industry, 2021-2031F |
6.2.4 China Bituminous Coal Market Revenues & Volume, By Cement Industry, 2021-2031F |
6.2.5 China Bituminous Coal Market Revenues & Volume, By Steel Industry, 2021-2031F |
6.2.6 China Bituminous Coal Market Revenues & Volume, By Other, 2021-2031F |
7 China Bituminous Coal Market Import-Export Trade Statistics |
7.1 China Bituminous Coal Market Export to Major Countries |
7.2 China Bituminous Coal Market Imports from Major Countries |
8 China Bituminous Coal Market Key Performance Indicators |
8.1 Average selling price of bituminous coal |
8.2 Percentage of energy generated from coal in China |
8.3 Investment in coal mining infrastructure and technology |
9 China Bituminous Coal Market - Opportunity Assessment |
9.1 China Bituminous Coal Market Opportunity Assessment, By Product Type, 2021 & 2031F |
9.2 China Bituminous Coal Market Opportunity Assessment, By Applications, 2021 & 2031F |
10 China Bituminous Coal Market - Competitive Landscape |
10.1 China Bituminous Coal Market Revenue Share, By Companies, 2024 |
10.2 China Bituminous Coal Market Competitive Benchmarking, By Operating and Technical Parameters |
11 Company Profiles |
12 Recommendations |
13 Disclaimer |
Global Go To Market Strategy - 2030
Export potential enables firms to identify high-growth global markets with greater confidence by combining advanced trade intelligence with a structured quantitative methodology. The framework analyzes emerging demand trends and country-level import patterns while integrating macroeconomic and trade datasets such as GDP and population forecasts, bilateral import–export flows, tariff structures, elasticity differentials between developed and developing economies, geographic distance, and import demand projections. Using weighted trade values from 2020–2024 as the base period to project country-to-country export potential for 2030, these inputs are operationalized through calculated drivers such as gravity model parameters, tariff impact factors, and projected GDP per-capita growth. Through an analysis of hidden potentials, demand hotspots, and market conditions that are most favorable to success, this method enables firms to focus on target countries, maximize returns, and global expansion with data, backed by accuracy.
By factoring in the projected importer demand gap that is currently unmet and could be potential opportunity, it identifies the potential for the Exporter (Country) among 190 countries, against the general trade analysis, which identifies the biggest importer or exporter.
To discover high-growth global markets and optimize your business strategy:
Click Here
Pricing
- Single User License$ 1,995
- Department License$ 2,400
- Site License$ 3,120
- Global License$ 3,795

Leadership Perspectives from Industry Events
Search
Thought Leadership and Analyst Meet


Our Clients
6WResearch In News
- India Air Conditioner Market Set for Strong Rebound in 2026 After Weather-Led Correction and GST-Driven Recovery: 6Wresearch
- ADAS in India: How Automatic Emergency Braking, Blind Spot Detection & Driver Monitoring are Transforming Road Safety
- Doha a strategic location for EV manufacturing hub: IPA Qatar
- Demand for luxury TVs surging in the GCC, says Samsung
- Empowering Growth: The Thriving Journey of Bangladesh’s Cable Industry
- Demand for luxury TVs surging in the GCC, says Samsung
Latest Reports
- Poland Fire Protection Systems Market (2026-2032)
- Cape Verde Portable Hand-Thrown Extinguisher Market (2026-2032)
- Canada Portable Hand-Thrown Extinguisher Market (2026-2032)
- Cameroon Portable Hand-Thrown Extinguisher Market (2026-2032)
- Burundi Portable Hand-Thrown Extinguisher Market (2026-2032)
- Burkina Faso Portable Hand-Thrown Extinguisher Market (2026-2032)
- Bulgaria Portable Hand-Thrown Extinguisher Market (2026-2032)
- Brunei Portable Hand-Thrown Extinguisher Market (2026-2032)
- Botswana Portable Hand-Thrown Extinguisher Market (2026-2032)
- Bosnia and Herzegovina Portable Hand-Thrown Extinguisher Market (2026-2032)
Industry Events and Analyst Meet

HIMTEX 2026

India Refining Summit 2026

India EV Show 2026

EV tech India Expo 2026

Auto Tech Asia 2026
Whitepaper
- Middle East & Africa Commercial Security Market Click here to view more.
- Middle East & Africa Fire Safety Systems & Equipment Market Click here to view more.
- GCC Drone Market Click here to view more.
- Middle East Lighting Fixture Market Click here to view more.
- GCC Physical & Perimeter Security Market Click here to view more.