China Cryogenic Valve Market (2025-2031) Outlook | Trends, Growth, Companies, Industry, Analysis, Size, Share, Forecast, Revenue, Value
Market Forecast By Gas (LNG, Oxygen, Nitrogen), By Type (Globe, Gate, Ball), By End-User (Energy & Power, Food, Chemicals) And Competitive Landscape
| Product Code: ETC4529122 | Publication Date: Jul 2023 | Updated Date: Oct 2025 | Product Type: Report | |
| Publisher: 6Wresearch | Author: Dhaval Chaurasia | No. of Pages: 85 | No. of Figures: 45 | No. of Tables: 25 |
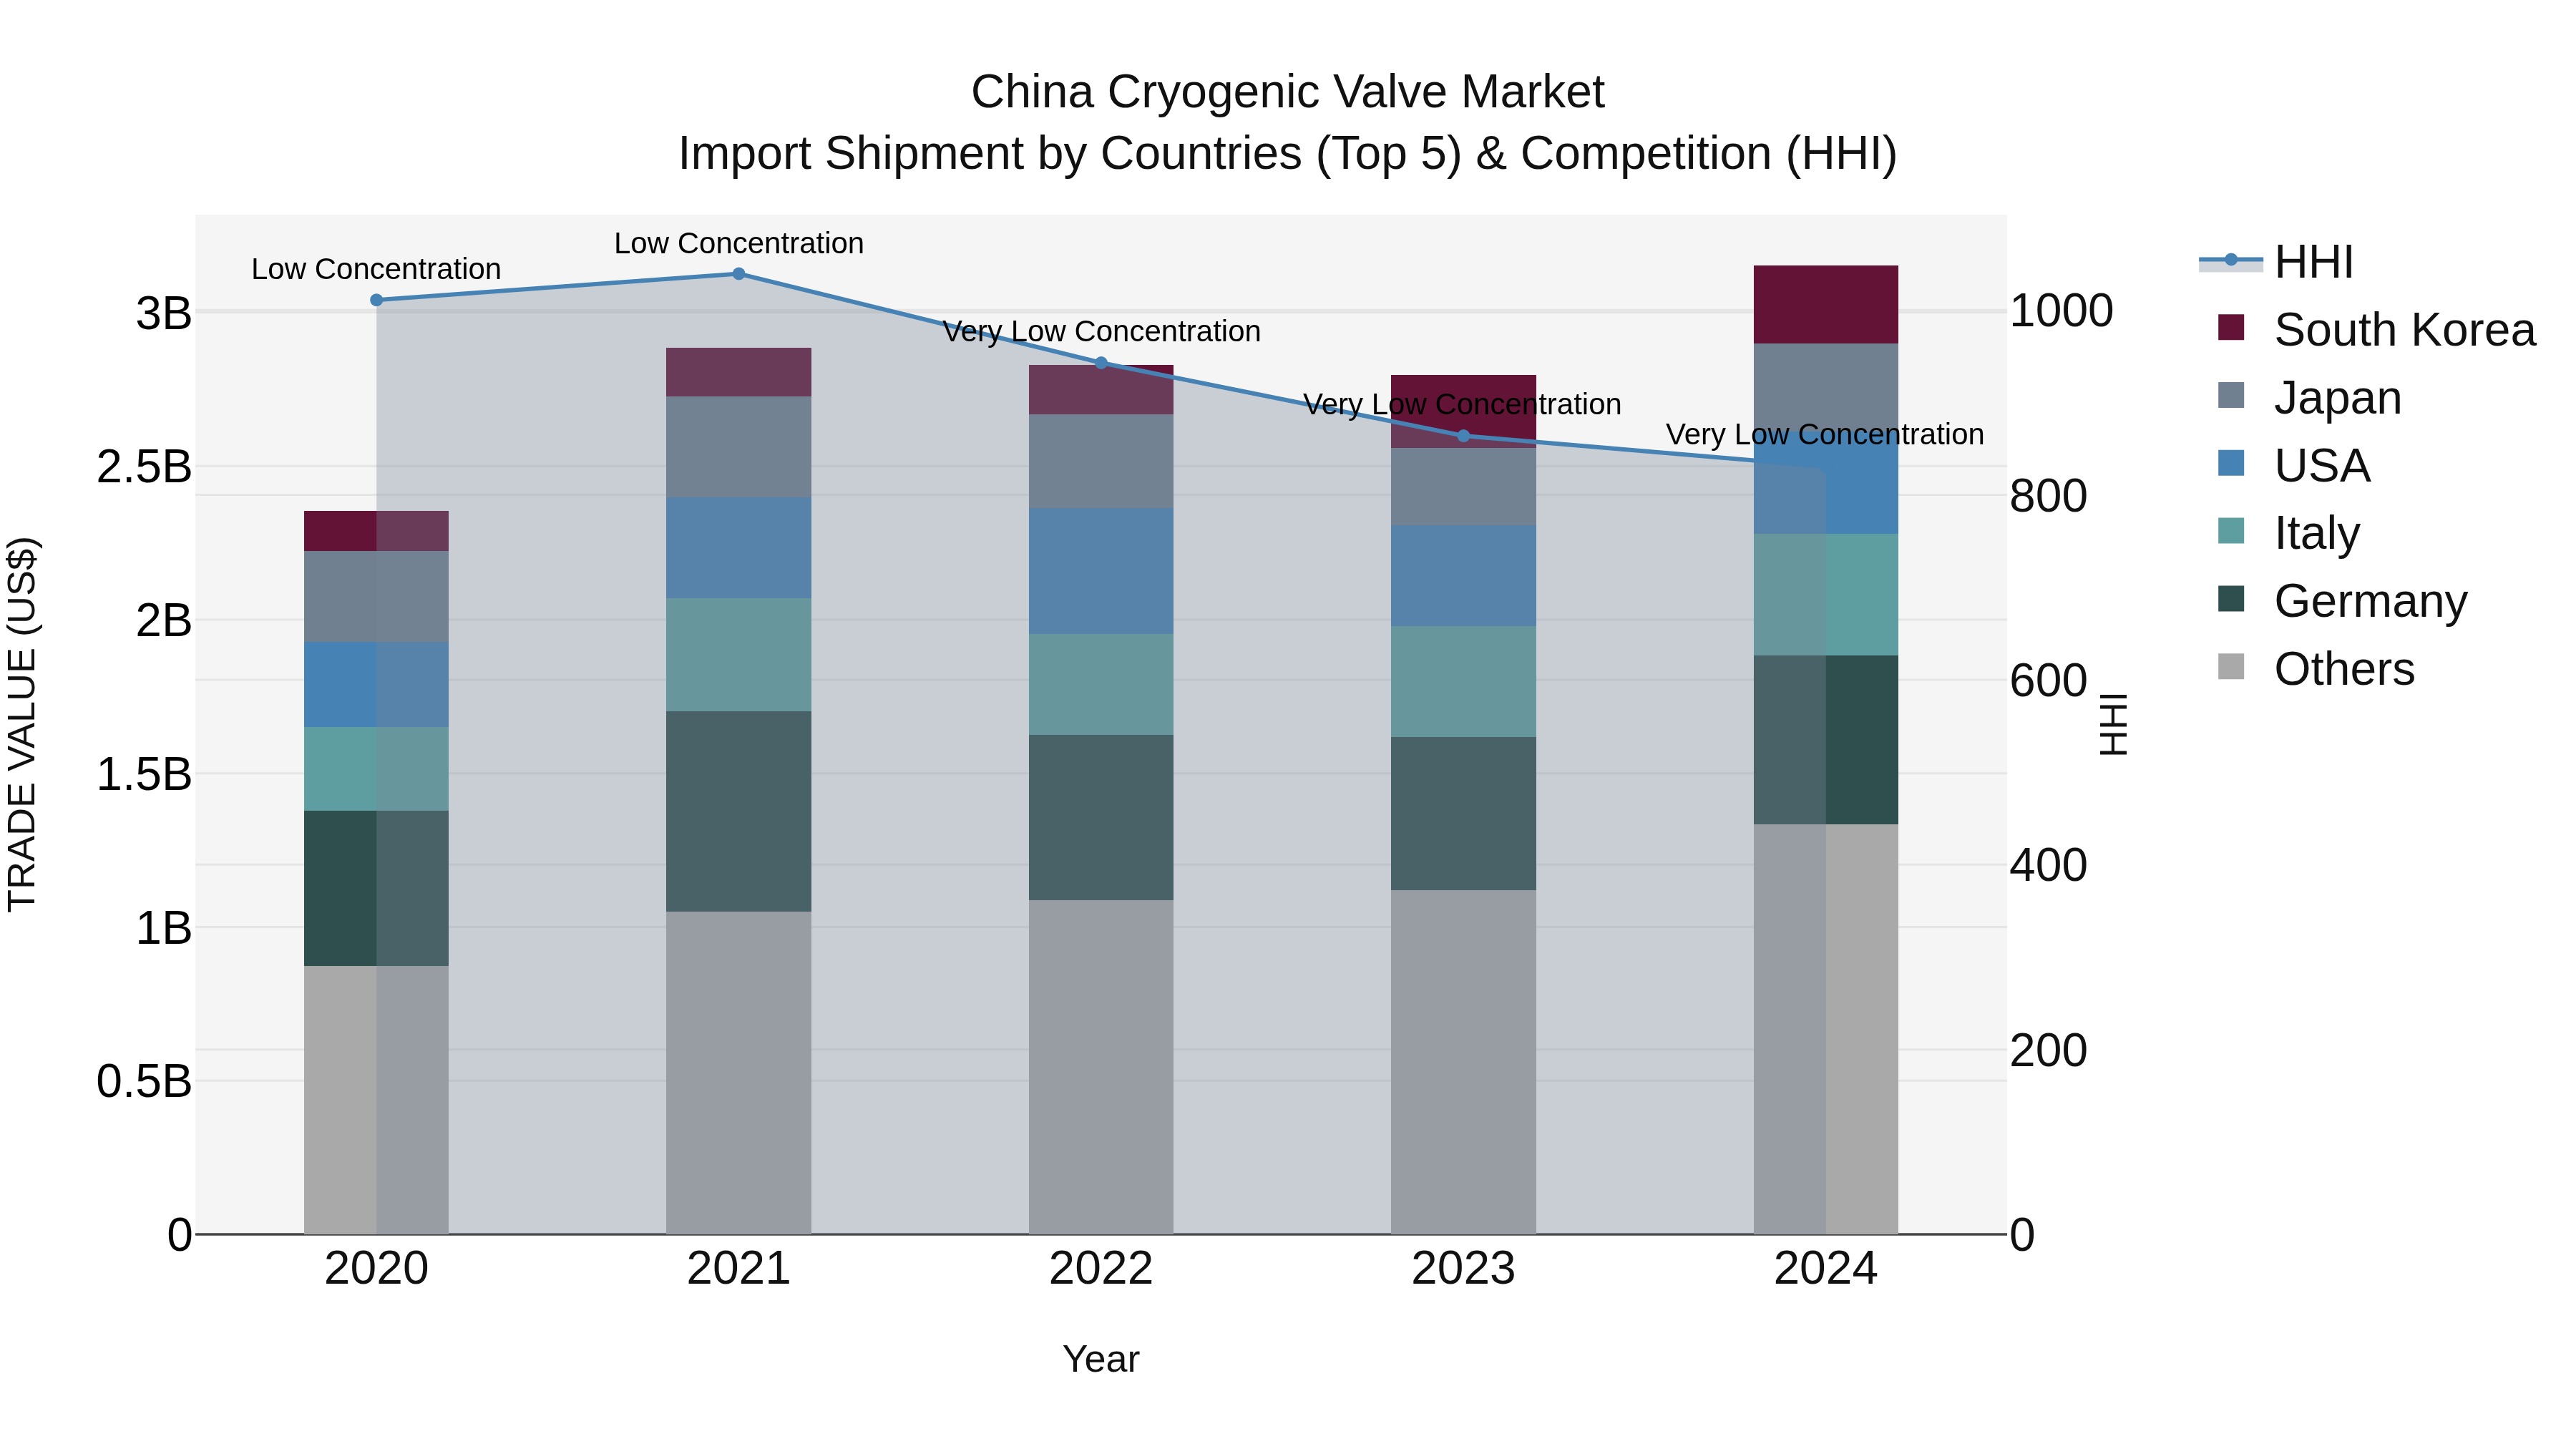
China Cryogenic Valve Market Top 5 Importing Countries and Market Competition (HHI) Analysis
China cryogenic valve import market saw robust growth in 2024, with top exporting countries being Germany, Italy, USA, Japan, and South Korea. The market remained competitive with a low Herfindahl-Hirschman Index (HHI) concentration. The compound annual growth rate (CAGR) from 2020 to 2024 stood at 7.58%, indicating sustained expansion. Notably, the growth rate in 2024 surged to 12.71%, signaling a potentially lucrative market for cryogenic valve suppliers aiming to enter or expand their presence in China.
China Cryogenic Valve Market Overview
The Cryogenic Valve Market in China is seeing significant growth due to the increasing use of cryogenic valves in industrial processes involving liquefied gases. These valves are vital for controlling the flow of gases at cryogenic temperatures. The market is driven by advancements in valve technologies, growing demand from the LNG sector, and the expansion of chemical and petrochemical industries. Innovations in valve design and improved safety standards are contributing to market growth.
Drivers of the market
The growth of the cryogenic valve market in China is driven by the expanding LNG infrastructure and the increasing use of cryogenic fluids in various industries. The need for reliable and efficient valve systems in high-pressure and low-temperature environments supports market growth. Advancements in valve technology, including improved materials and automation, enhance performance and safety, further driving demand. The rise in industrial applications and the expansion of gas distribution networks also contribute to market growth.
Challenges of the market
The China cryogenic valve market is challenged by the need for high precision and reliability under extreme conditions. Cryogenic valves must function accurately at very low temperatures, which requires advanced design and manufacturing capabilities. The market also faces pressure from rising raw material costs and the need for regular technological upgrades to meet evolving industry standards.
Government Policy of the market
The cryogenic valve market in China is influenced by policies aimed at improving industrial safety and standards. The "National Standards for Cryogenic Equipment" set forth guidelines for manufacturing and testing cryogenic valves, ensuring their reliability and safety. The government also provides support for research into advanced valve technologies and encourages domestic production through subsidies and tax incentives.
Key Highlights of the Report:
- China Cryogenic Valve Market Outlook
- Market Size of China Cryogenic Valve Market, 2024
- Forecast of China Cryogenic Valve Market, 2031
- Historical Data and Forecast of China Cryogenic Valve Revenues & Volume for the Period 2021-2031
- China Cryogenic Valve Market Trend Evolution
- China Cryogenic Valve Market Drivers and Challenges
- China Cryogenic Valve Price Trends
- China Cryogenic Valve Porter's Five Forces
- China Cryogenic Valve Industry Life Cycle
- Historical Data and Forecast of China Cryogenic Valve Market Revenues & Volume By Gas for the Period 2021-2031
- Historical Data and Forecast of China Cryogenic Valve Market Revenues & Volume By LNG for the Period 2021-2031
- Historical Data and Forecast of China Cryogenic Valve Market Revenues & Volume By Oxygen for the Period 2021-2031
- Historical Data and Forecast of China Cryogenic Valve Market Revenues & Volume By Nitrogen for the Period 2021-2031
- Historical Data and Forecast of China Cryogenic Valve Market Revenues & Volume By Type for the Period 2021-2031
- Historical Data and Forecast of China Cryogenic Valve Market Revenues & Volume By Globe for the Period 2021-2031
- Historical Data and Forecast of China Cryogenic Valve Market Revenues & Volume By Gate for the Period 2021-2031
- Historical Data and Forecast of China Cryogenic Valve Market Revenues & Volume By Ball for the Period 2021-2031
- Historical Data and Forecast of China Cryogenic Valve Market Revenues & Volume By End-User for the Period 2021-2031
- Historical Data and Forecast of China Cryogenic Valve Market Revenues & Volume By Energy & Power for the Period 2021-2031
- Historical Data and Forecast of China Cryogenic Valve Market Revenues & Volume By Food for the Period 2021-2031
- Historical Data and Forecast of China Cryogenic Valve Market Revenues & Volume By Chemicals for the Period 2021-2031
- China Cryogenic Valve Import Export Trade Statistics
- Market Opportunity Assessment By Gas
- Market Opportunity Assessment By Type
- Market Opportunity Assessment By End-User
- China Cryogenic Valve Top Companies Market Share
- China Cryogenic Valve Competitive Benchmarking By Technical and Operational Parameters
- China Cryogenic Valve Company Profiles
- China Cryogenic Valve Key Strategic Recommendations
Frequently Asked Questions About the Market Study (FAQs):
6Wresearch actively monitors the China Cryogenic Valve Market and publishes its comprehensive annual report, highlighting emerging trends, growth drivers, revenue analysis, and forecast outlook. Our insights help businesses to make data-backed strategic decisions with ongoing market dynamics. Our analysts track relevent industries related to the China Cryogenic Valve Market, allowing our clients with actionable intelligence and reliable forecasts tailored to emerging regional needs.
Yes, we provide customisation as per your requirements. To learn more, feel free to contact us on sales@6wresearch.com
1 Executive Summary |
2 Introduction |
2.1 Key Highlights of the Report |
2.2 Report Description |
2.3 Market Scope & Segmentation |
2.4 Research Methodology |
2.5 Assumptions |
3 China Cryogenic Valve Market Overview |
3.1 China Country Macro Economic Indicators |
3.2 China Cryogenic Valve Market Revenues & Volume, 2021 & 2031F |
3.3 China Cryogenic Valve Market - Industry Life Cycle |
3.4 China Cryogenic Valve Market - Porter's Five Forces |
3.5 China Cryogenic Valve Market Revenues & Volume Share, By Gas, 2021 & 2031F |
3.6 China Cryogenic Valve Market Revenues & Volume Share, By Type, 2021 & 2031F |
3.7 China Cryogenic Valve Market Revenues & Volume Share, By End-User, 2021 & 2031F |
4 China Cryogenic Valve Market Dynamics |
4.1 Impact Analysis |
4.2 Market Drivers |
4.2.1 Growing demand for liquefied natural gas (LNG) in China |
4.2.2 Increasing investments in energy infrastructure projects |
4.2.3 Advancements in cryogenic technology and materials |
4.3 Market Restraints |
4.3.1 High initial investment and maintenance costs of cryogenic valves |
4.3.2 Stringent regulations and standards for cryogenic equipment |
4.3.3 Limited availability of skilled technicians for installation and maintenance |
5 China Cryogenic Valve Market Trends |
6 China Cryogenic Valve Market, By Types |
6.1 China Cryogenic Valve Market, By Gas |
6.1.1 Overview and Analysis |
6.1.2 China Cryogenic Valve Market Revenues & Volume, By Gas, 2021-2031F |
6.1.3 China Cryogenic Valve Market Revenues & Volume, By LNG, 2021-2031F |
6.1.4 China Cryogenic Valve Market Revenues & Volume, By Oxygen, 2021-2031F |
6.1.5 China Cryogenic Valve Market Revenues & Volume, By Nitrogen, 2021-2031F |
6.2 China Cryogenic Valve Market, By Type |
6.2.1 Overview and Analysis |
6.2.2 China Cryogenic Valve Market Revenues & Volume, By Globe, 2021-2031F |
6.2.3 China Cryogenic Valve Market Revenues & Volume, By Gate, 2021-2031F |
6.2.4 China Cryogenic Valve Market Revenues & Volume, By Ball, 2021-2031F |
6.3 China Cryogenic Valve Market, By End-User |
6.3.1 Overview and Analysis |
6.3.2 China Cryogenic Valve Market Revenues & Volume, By Energy & Power, 2021-2031F |
6.3.3 China Cryogenic Valve Market Revenues & Volume, By Food, 2021-2031F |
6.3.4 China Cryogenic Valve Market Revenues & Volume, By Chemicals, 2021-2031F |
7 China Cryogenic Valve Market Import-Export Trade Statistics |
7.1 China Cryogenic Valve Market Export to Major Countries |
7.2 China Cryogenic Valve Market Imports from Major Countries |
8 China Cryogenic Valve Market Key Performance Indicators |
8.1 Number of new LNG terminals being constructed in China |
8.2 Research and development expenditure on cryogenic valve technology |
8.3 Adoption rate of cryogenic valves in emerging industries such as healthcare and food processing |
9 China Cryogenic Valve Market - Opportunity Assessment |
9.1 China Cryogenic Valve Market Opportunity Assessment, By Gas, 2021 & 2031F |
9.2 China Cryogenic Valve Market Opportunity Assessment, By Type, 2021 & 2031F |
9.3 China Cryogenic Valve Market Opportunity Assessment, By End-User, 2021 & 2031F |
10 China Cryogenic Valve Market - Competitive Landscape |
10.1 China Cryogenic Valve Market Revenue Share, By Companies, 2024 |
10.2 China Cryogenic Valve Market Competitive Benchmarking, By Operating and Technical Parameters |
11 Company Profiles |
12 Recommendations |
13 Disclaimer |
Global Go To Market Strategy - 2030
Export potential enables firms to identify high-growth global markets with greater confidence by combining advanced trade intelligence with a structured quantitative methodology. The framework analyzes emerging demand trends and country-level import patterns while integrating macroeconomic and trade datasets such as GDP and population forecasts, bilateral import–export flows, tariff structures, elasticity differentials between developed and developing economies, geographic distance, and import demand projections. Using weighted trade values from 2020–2024 as the base period to project country-to-country export potential for 2030, these inputs are operationalized through calculated drivers such as gravity model parameters, tariff impact factors, and projected GDP per-capita growth. Through an analysis of hidden potentials, demand hotspots, and market conditions that are most favorable to success, this method enables firms to focus on target countries, maximize returns, and global expansion with data, backed by accuracy.
By factoring in the projected importer demand gap that is currently unmet and could be potential opportunity, it identifies the potential for the Exporter (Country) among 190 countries, against the general trade analysis, which identifies the biggest importer or exporter.
To discover high-growth global markets and optimize your business strategy:
Click Here
Pricing
- Single User License$ 1,995
- Department License$ 2,400
- Site License$ 3,120
- Global License$ 3,795

Leadership Perspectives from Industry Events
Search
Thought Leadership and Analyst Meet


Our Clients
6WResearch In News
- Doha a strategic location for EV manufacturing hub: IPA Qatar
- Demand for luxury TVs surging in the GCC, says Samsung
- Empowering Growth: The Thriving Journey of Bangladesh’s Cable Industry
- Demand for luxury TVs surging in the GCC, says Samsung
- Video call with a traditional healer? Once unthinkable, it’s now common in South Africa
- Intelligent Buildings To Smooth GCC’s Path To Net Zero
Latest Reports
- New Zealand Aseptic Manufacturing Market (2026-2032)
- Netherlands Aseptic Manufacturing Market (2026-2032)
- Nauru Aseptic Manufacturing Market (2026-2032)
- Namibia Aseptic Manufacturing Market (2026-2032)
- Mozambique Aseptic Manufacturing Market (2026-2032)
- Montenegro Aseptic Manufacturing Market (2026-2032)
- Mongolia Aseptic Manufacturing Market (2026-2032)
- Monaco Aseptic Manufacturing Market (2026-2032)
- Micronesia Aseptic Manufacturing Market (2026-2032)
- Mauritius Aseptic Manufacturing Market (2026-2032)
Industry Events and Analyst Meet

HIMTEX 2026

India Refining Summit 2026

India EV Show 2026

EV tech India Expo 2026

Auto Tech Asia 2026
Whitepaper
- Middle East & Africa Commercial Security Market Click here to view more.
- Middle East & Africa Fire Safety Systems & Equipment Market Click here to view more.
- GCC Drone Market Click here to view more.
- Middle East Lighting Fixture Market Click here to view more.
- GCC Physical & Perimeter Security Market Click here to view more.