China Vitamin B3 Market Outlook | Share, Trends, Value, COVID-19 IMPACT, Industry, Forecast, Growth, Companies, Analysis, Size & Revenue
Market Forecast By Type (Feed grade, Nutrition grade), By Source (Natural, Synthetic), By Form (Dry, Liquid), By Application (Nutrition, Consumer, Agrochemicals, Pharmaceuticals, Other applications) And Competitive Landscape
| Product Code: ETC103900 | Publication Date: Jun 2021 | Updated Date: Aug 2025 | Product Type: Report | |
| Publisher: 6Wresearch | Author: Ravi Bhandari | No. of Pages: 70 | No. of Figures: 35 | No. of Tables: 5 |
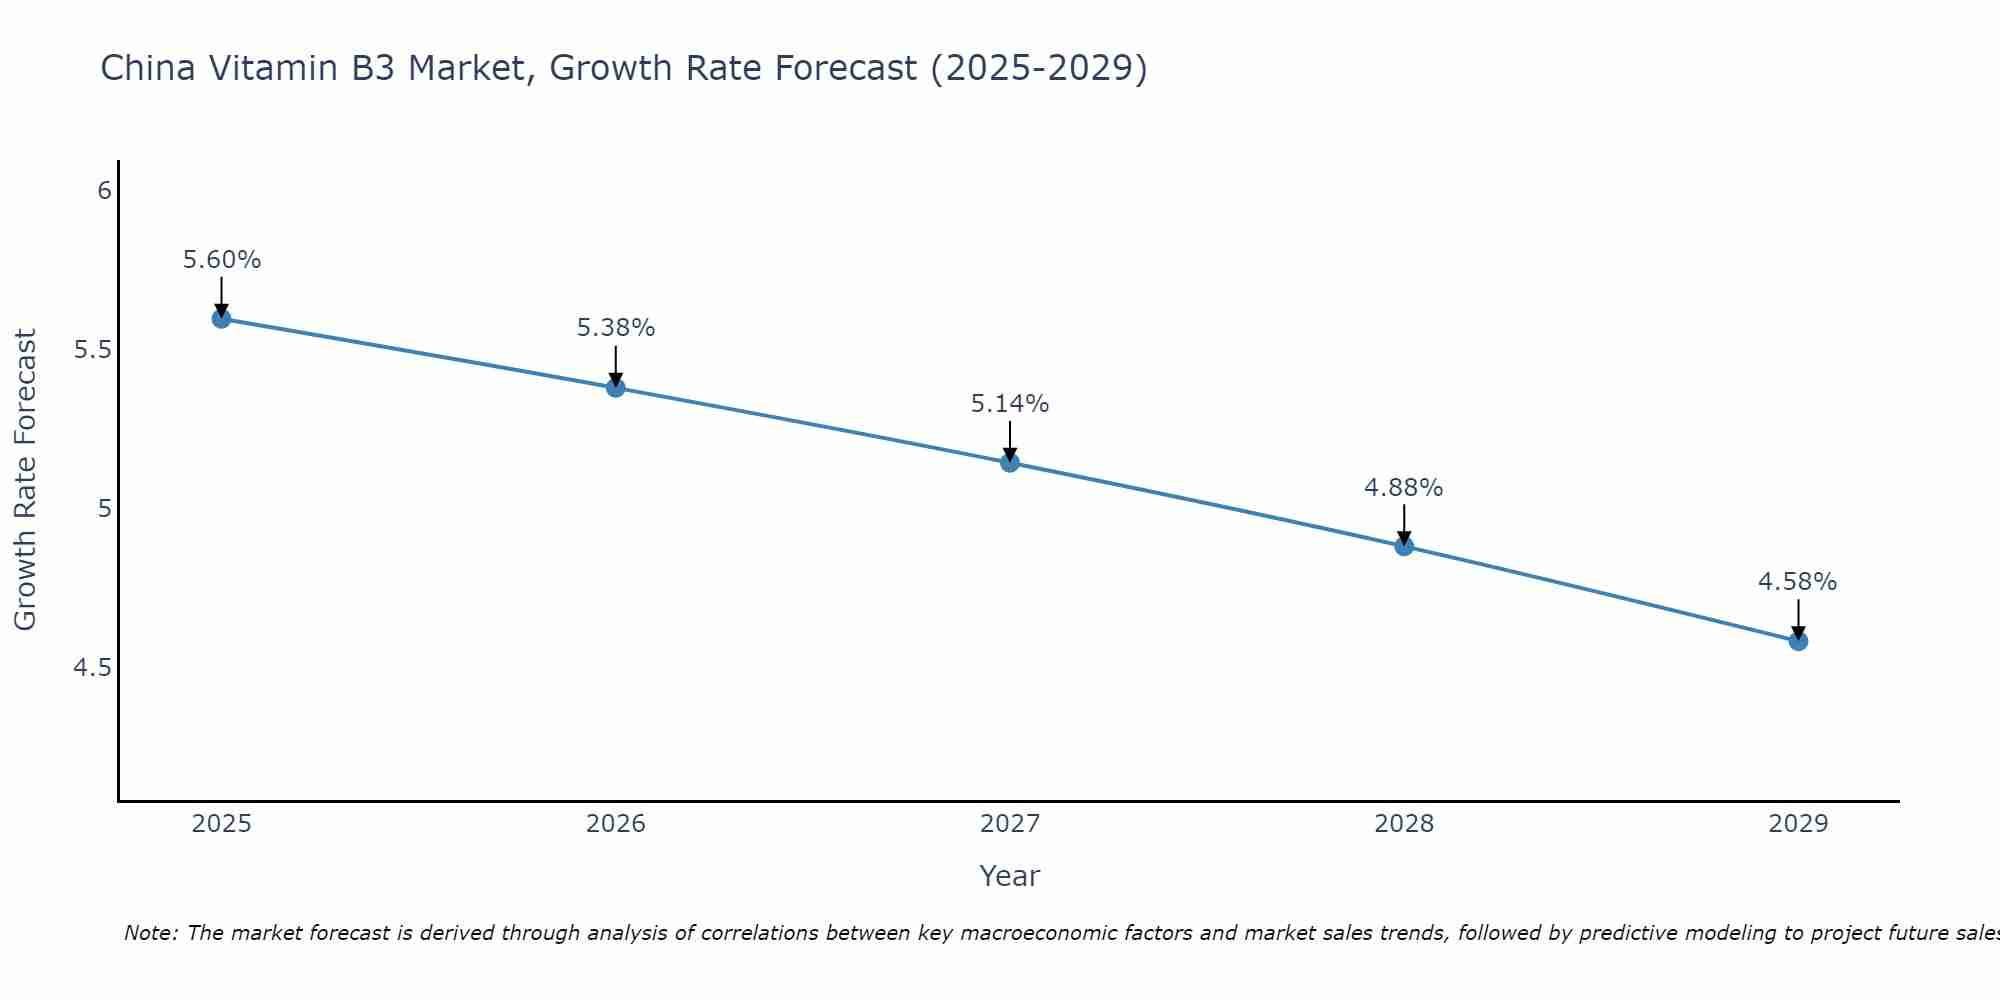
China Vitamin B3 Market Size Growth Rate
The China Vitamin B3 Market may undergo a gradual slowdown in growth rates between 2025 and 2029. Beginning strongly at 5.60% in 2025, growth softens to 4.58% in 2029.
China Vitamin B3 Market Overview
The Vitamin B3 market in China is growing steadily, propelled by the rising demand in the pharmaceutical, cosmetic, and food industries. Niacin, a form of Vitamin B3, is widely used for its therapeutic benefits, including improving cholesterol levels and supporting skin health. Increased consumer awareness of nutritional supplements and the rise of health and wellness trends are also contributing to market growth. Challenges include competition from synthetic alternatives and price volatility of raw materials, which may affect profit margins for manufacturers.
Drivers of the market
The China Vitamin B3 Market is driven by its wide application in skincare and pharmaceutical products. The rising consumer demand for anti-aging and skin-brightening products is boosting the market. Additionally, the use of Vitamin B3 (niacin) in managing cholesterol levels and cardiovascular health is driving its demand in the pharmaceutical sector. Growing health consciousness among consumers is further fueling market growth.
Challenges of the market
The Vitamin B3 market faces challenges related to the sourcing and sustainability of raw materials. Price volatility of niacinamide and niacin, the primary forms of Vitamin B3, can affect production costs. Moreover, the market is influenced by stringent regulations on product quality and health claims, requiring manufacturers to comply with rigorous standards and invest in quality control.
Government Policy of the market
Vitamin B3, also known as niacin, is regulated under China`s food safety and pharmaceutical laws. The governments policies include setting permissible limits for vitamin B3 content in dietary supplements and fortified foods. The National Health Commission provides guidelines for the use of vitamins in food products to prevent deficiencies while ensuring consumer safety. Import and export regulations also play a role, with tariffs and trade policies affecting the cost and availability of vitamin B3 products in China.
Key Highlights of the Report:
- China Vitamin B3 Market Outlook
- Market Size of China Vitamin B3 Market, 2024
- Forecast of China Vitamin B3 Market, 2031
- Historical Data and Forecast of China Vitamin B3 Revenues & Volume for the Period 2018 - 2031
- China Vitamin B3 Market Trend Evolution
- China Vitamin B3 Market Drivers and Challenges
- China Vitamin B3 Price Trends
- China Vitamin B3 Porter's Five Forces
- China Vitamin B3 Industry Life Cycle
- Historical Data and Forecast of China Vitamin B3 Market Revenues & Volume By Type for the Period 2018 - 2031
- Historical Data and Forecast of China Vitamin B3 Market Revenues & Volume By Feed grade for the Period 2018 - 2031
- Historical Data and Forecast of China Vitamin B3 Market Revenues & Volume By Nutrition grade for the Period 2018 - 2031
- Historical Data and Forecast of China Vitamin B3 Market Revenues & Volume By Source for the Period 2018 - 2031
- Historical Data and Forecast of China Vitamin B3 Market Revenues & Volume By Natural for the Period 2018 - 2031
- Historical Data and Forecast of China Vitamin B3 Market Revenues & Volume By Synthetic for the Period 2018 - 2031
- Historical Data and Forecast of China Vitamin B3 Market Revenues & Volume By Form for the Period 2018 - 2031
- Historical Data and Forecast of China Vitamin B3 Market Revenues & Volume By Dry for the Period 2018 - 2031
- Historical Data and Forecast of China Vitamin B3 Market Revenues & Volume By Liquid for the Period 2018 - 2031
- Historical Data and Forecast of China Vitamin B3 Market Revenues & Volume By Application for the Period 2018 - 2031
- Historical Data and Forecast of China Vitamin B3 Market Revenues & Volume By Nutrition for the Period 2018 - 2031
- Historical Data and Forecast of China Vitamin B3 Market Revenues & Volume By Consumer for the Period 2018 - 2031
- Historical Data and Forecast of China Vitamin B3 Market Revenues & Volume By Agrochemicals for the Period 2018 - 2031
- Historical Data and Forecast of China Vitamin B3 Market Revenues & Volume By Pharmaceuticals for the Period 2018 - 2031
- Historical Data and Forecast of China Vitamin B3 Market Revenues & Volume By Other applications for the Period 2018 - 2031
- China Vitamin B3 Import Export Trade Statistics
- Market Opportunity Assessment By Type
- Market Opportunity Assessment By Source
- Market Opportunity Assessment By Form
- Market Opportunity Assessment By Application
- China Vitamin B3 Top Companies Market Share
- China Vitamin B3 Competitive Benchmarking By Technical and Operational Parameters
- China Vitamin B3 Company Profiles
- China Vitamin B3 Key Strategic Recommendations
Frequently Asked Questions About the Market Study (FAQs):
6Wresearch actively monitors the China Vitamin B3 Market and publishes its comprehensive annual report, highlighting emerging trends, growth drivers, revenue analysis, and forecast outlook. Our insights help businesses to make data-backed strategic decisions with ongoing market dynamics. Our analysts track relevent industries related to the China Vitamin B3 Market, allowing our clients with actionable intelligence and reliable forecasts tailored to emerging regional needs.
Yes, we provide customisation as per your requirements. To learn more, feel free to contact us on sales@6wresearch.com
1 Executive Summary |
2 Introduction |
2.1 Key Highlights of the Report |
2.2 Report Description |
2.3 Market Scope & Segmentation |
2.4 Research Methodology |
2.5 Assumptions |
3 China Vitamin B3 Market Overview |
3.1 China Country Macro Economic Indicators |
3.2 China Vitamin B3 Market Revenues & Volume, 2021 & 2031F |
3.3 China Vitamin B3 Market - Industry Life Cycle |
3.4 China Vitamin B3 Market - Porter's Five Forces |
3.5 China Vitamin B3 Market Revenues & Volume Share, By Type, 2021 & 2031F |
3.6 China Vitamin B3 Market Revenues & Volume Share, By Source, 2021 & 2031F |
3.7 China Vitamin B3 Market Revenues & Volume Share, By Form, 2021 & 2031F |
3.8 China Vitamin B3 Market Revenues & Volume Share, By Application, 2021 & 2031F |
4 China Vitamin B3 Market Dynamics |
4.1 Impact Analysis |
4.2 Market Drivers |
4.2.1 Increasing awareness about the importance of vitamin B3 for overall health and wellness in China. |
4.2.2 Growing demand for dietary supplements and functional foods containing vitamin B3. |
4.2.3 Rising disposable income levels leading to higher spending on health and wellness products in China. |
4.3 Market Restraints |
4.3.1 Stringent regulatory requirements and quality standards in the supplement industry in China. |
4.3.2 Limited availability of vitamin B3 sources or raw materials in the Chinese market. |
4.3.3 Competition from alternative sources of nutrition and wellness products. |
5 China Vitamin B3 Market Trends |
6 China Vitamin B3 Market, By Types |
6.1 China Vitamin B3 Market, By Type |
6.1.1 Overview and Analysis |
6.1.2 China Vitamin B3 Market Revenues & Volume, By Type, 2021-2031F |
6.1.3 China Vitamin B3 Market Revenues & Volume, By Feed grade, 2021-2031F |
6.1.4 China Vitamin B3 Market Revenues & Volume, By Nutrition grade, 2021-2031F |
6.2 China Vitamin B3 Market, By Source |
6.2.1 Overview and Analysis |
6.2.2 China Vitamin B3 Market Revenues & Volume, By Natural, 2021-2031F |
6.2.3 China Vitamin B3 Market Revenues & Volume, By Synthetic, 2021-2031F |
6.3 China Vitamin B3 Market, By Form |
6.3.1 Overview and Analysis |
6.3.2 China Vitamin B3 Market Revenues & Volume, By Dry, 2021-2031F |
6.3.3 China Vitamin B3 Market Revenues & Volume, By Liquid, 2021-2031F |
6.4 China Vitamin B3 Market, By Application |
6.4.1 Overview and Analysis |
6.4.2 China Vitamin B3 Market Revenues & Volume, By Nutrition, 2021-2031F |
6.4.3 China Vitamin B3 Market Revenues & Volume, By Consumer, 2021-2031F |
6.4.4 China Vitamin B3 Market Revenues & Volume, By Agrochemicals, 2021-2031F |
6.4.5 China Vitamin B3 Market Revenues & Volume, By Pharmaceuticals, 2021-2031F |
6.4.6 China Vitamin B3 Market Revenues & Volume, By Other applications, 2021-2031F |
7 China Vitamin B3 Market Import-Export Trade Statistics |
7.1 China Vitamin B3 Market Export to Major Countries |
7.2 China Vitamin B3 Market Imports from Major Countries |
8 China Vitamin B3 Market Key Performance Indicators |
8.1 Number of new product launches containing vitamin B3 in the Chinese market. |
8.2 Consumer awareness and perception surveys regarding the benefits of vitamin B3. |
8.3 Growth in the number of health and wellness stores or pharmacies stocking vitamin B3 products in China. |
9 China Vitamin B3 Market - Opportunity Assessment |
9.1 China Vitamin B3 Market Opportunity Assessment, By Type, 2021 & 2031F |
9.2 China Vitamin B3 Market Opportunity Assessment, By Source, 2021 & 2031F |
9.3 China Vitamin B3 Market Opportunity Assessment, By Form, 2021 & 2031F |
9.4 China Vitamin B3 Market Opportunity Assessment, By Application, 2021 & 2031F |
10 China Vitamin B3 Market - Competitive Landscape |
10.1 China Vitamin B3 Market Revenue Share, By Companies, 2024 |
10.2 China Vitamin B3 Market Competitive Benchmarking, By Operating and Technical Parameters |
11 Company Profiles |
12 Recommendations |
13 Disclaimer |
Global Go To Market Strategy - 2030
Export potential enables firms to identify high-growth global markets with greater confidence by combining advanced trade intelligence with a structured quantitative methodology. The framework analyzes emerging demand trends and country-level import patterns while integrating macroeconomic and trade datasets such as GDP and population forecasts, bilateral import–export flows, tariff structures, elasticity differentials between developed and developing economies, geographic distance, and import demand projections. Using weighted trade values from 2020–2024 as the base period to project country-to-country export potential for 2030, these inputs are operationalized through calculated drivers such as gravity model parameters, tariff impact factors, and projected GDP per-capita growth. Through an analysis of hidden potentials, demand hotspots, and market conditions that are most favorable to success, this method enables firms to focus on target countries, maximize returns, and global expansion with data, backed by accuracy.
By factoring in the projected importer demand gap that is currently unmet and could be potential opportunity, it identifies the potential for the Exporter (Country) among 190 countries, against the general trade analysis, which identifies the biggest importer or exporter.
To discover high-growth global markets and optimize your business strategy:
Click Here
Pricing
- Single User License$ 1,995
- Department License$ 2,400
- Site License$ 3,120
- Global License$ 3,795

Leadership Perspectives from Industry Events
Search
Thought Leadership and Analyst Meet


Our Clients
6WResearch In News
- India Air Conditioner Market Set for Strong Rebound in 2026 After Weather-Led Correction and GST-Driven Recovery: 6Wresearch
- ADAS in India: How Automatic Emergency Braking, Blind Spot Detection & Driver Monitoring are Transforming Road Safety
- Doha a strategic location for EV manufacturing hub: IPA Qatar
- Demand for luxury TVs surging in the GCC, says Samsung
- Empowering Growth: The Thriving Journey of Bangladesh’s Cable Industry
- Demand for luxury TVs surging in the GCC, says Samsung
Latest Reports
- Nicaragua RPG Gaming Market (2026-2032)
- New Zealand RPG Gaming Market (2026-2032)
- Netherlands RPG Gaming Market (2026-2032)
- Nauru RPG Gaming Market (2026-2032)
- Namibia RPG Gaming Market (2026-2032)
- Mozambique RPG Gaming Market (2026-2032)
- Montenegro RPG Gaming Market (2026-2032)
- Mongolia RPG Gaming Market (2026-2032)
- Monaco RPG Gaming Market (2026-2032)
- Micronesia RPG Gaming Market (2026-2032)
Industry Events and Analyst Meet

EV India Expo 2026

HIMTEX 2026

India Refining Summit 2026

India EV Show 2026

EV tech India Expo 2026
Whitepaper
- Middle East & Africa Commercial Security Market Click here to view more.
- Middle East & Africa Fire Safety Systems & Equipment Market Click here to view more.
- GCC Drone Market Click here to view more.
- Middle East Lighting Fixture Market Click here to view more.
- GCC Physical & Perimeter Security Market Click here to view more.