Croatia Adipic acid Market (2026-2032) | Segmentation, Revenue, Value, Size, Forecast, Companies, Outlook, Trends, Share, Growth, Analysis & Industry
Market Forecast By Application (Nylon 6,6 Fiber, Nylon 6,6 Resin, Polyurethane, Adipate Esters, Others), By Raw Material (Cyclohexanol, Cyclohexanone) And Competitive Landscape
| Product Code: ETC4820474 | Publication Date: Nov 2023 | Updated Date: Apr 2026 | Product Type: Market Research Report | |
| Publisher: 6Wresearch | Author: Shubham Padhi | No. of Pages: 60 | No. of Figures: 30 | No. of Tables: 5 |
Croatia Adipic Acid Market Size (2020-2030)
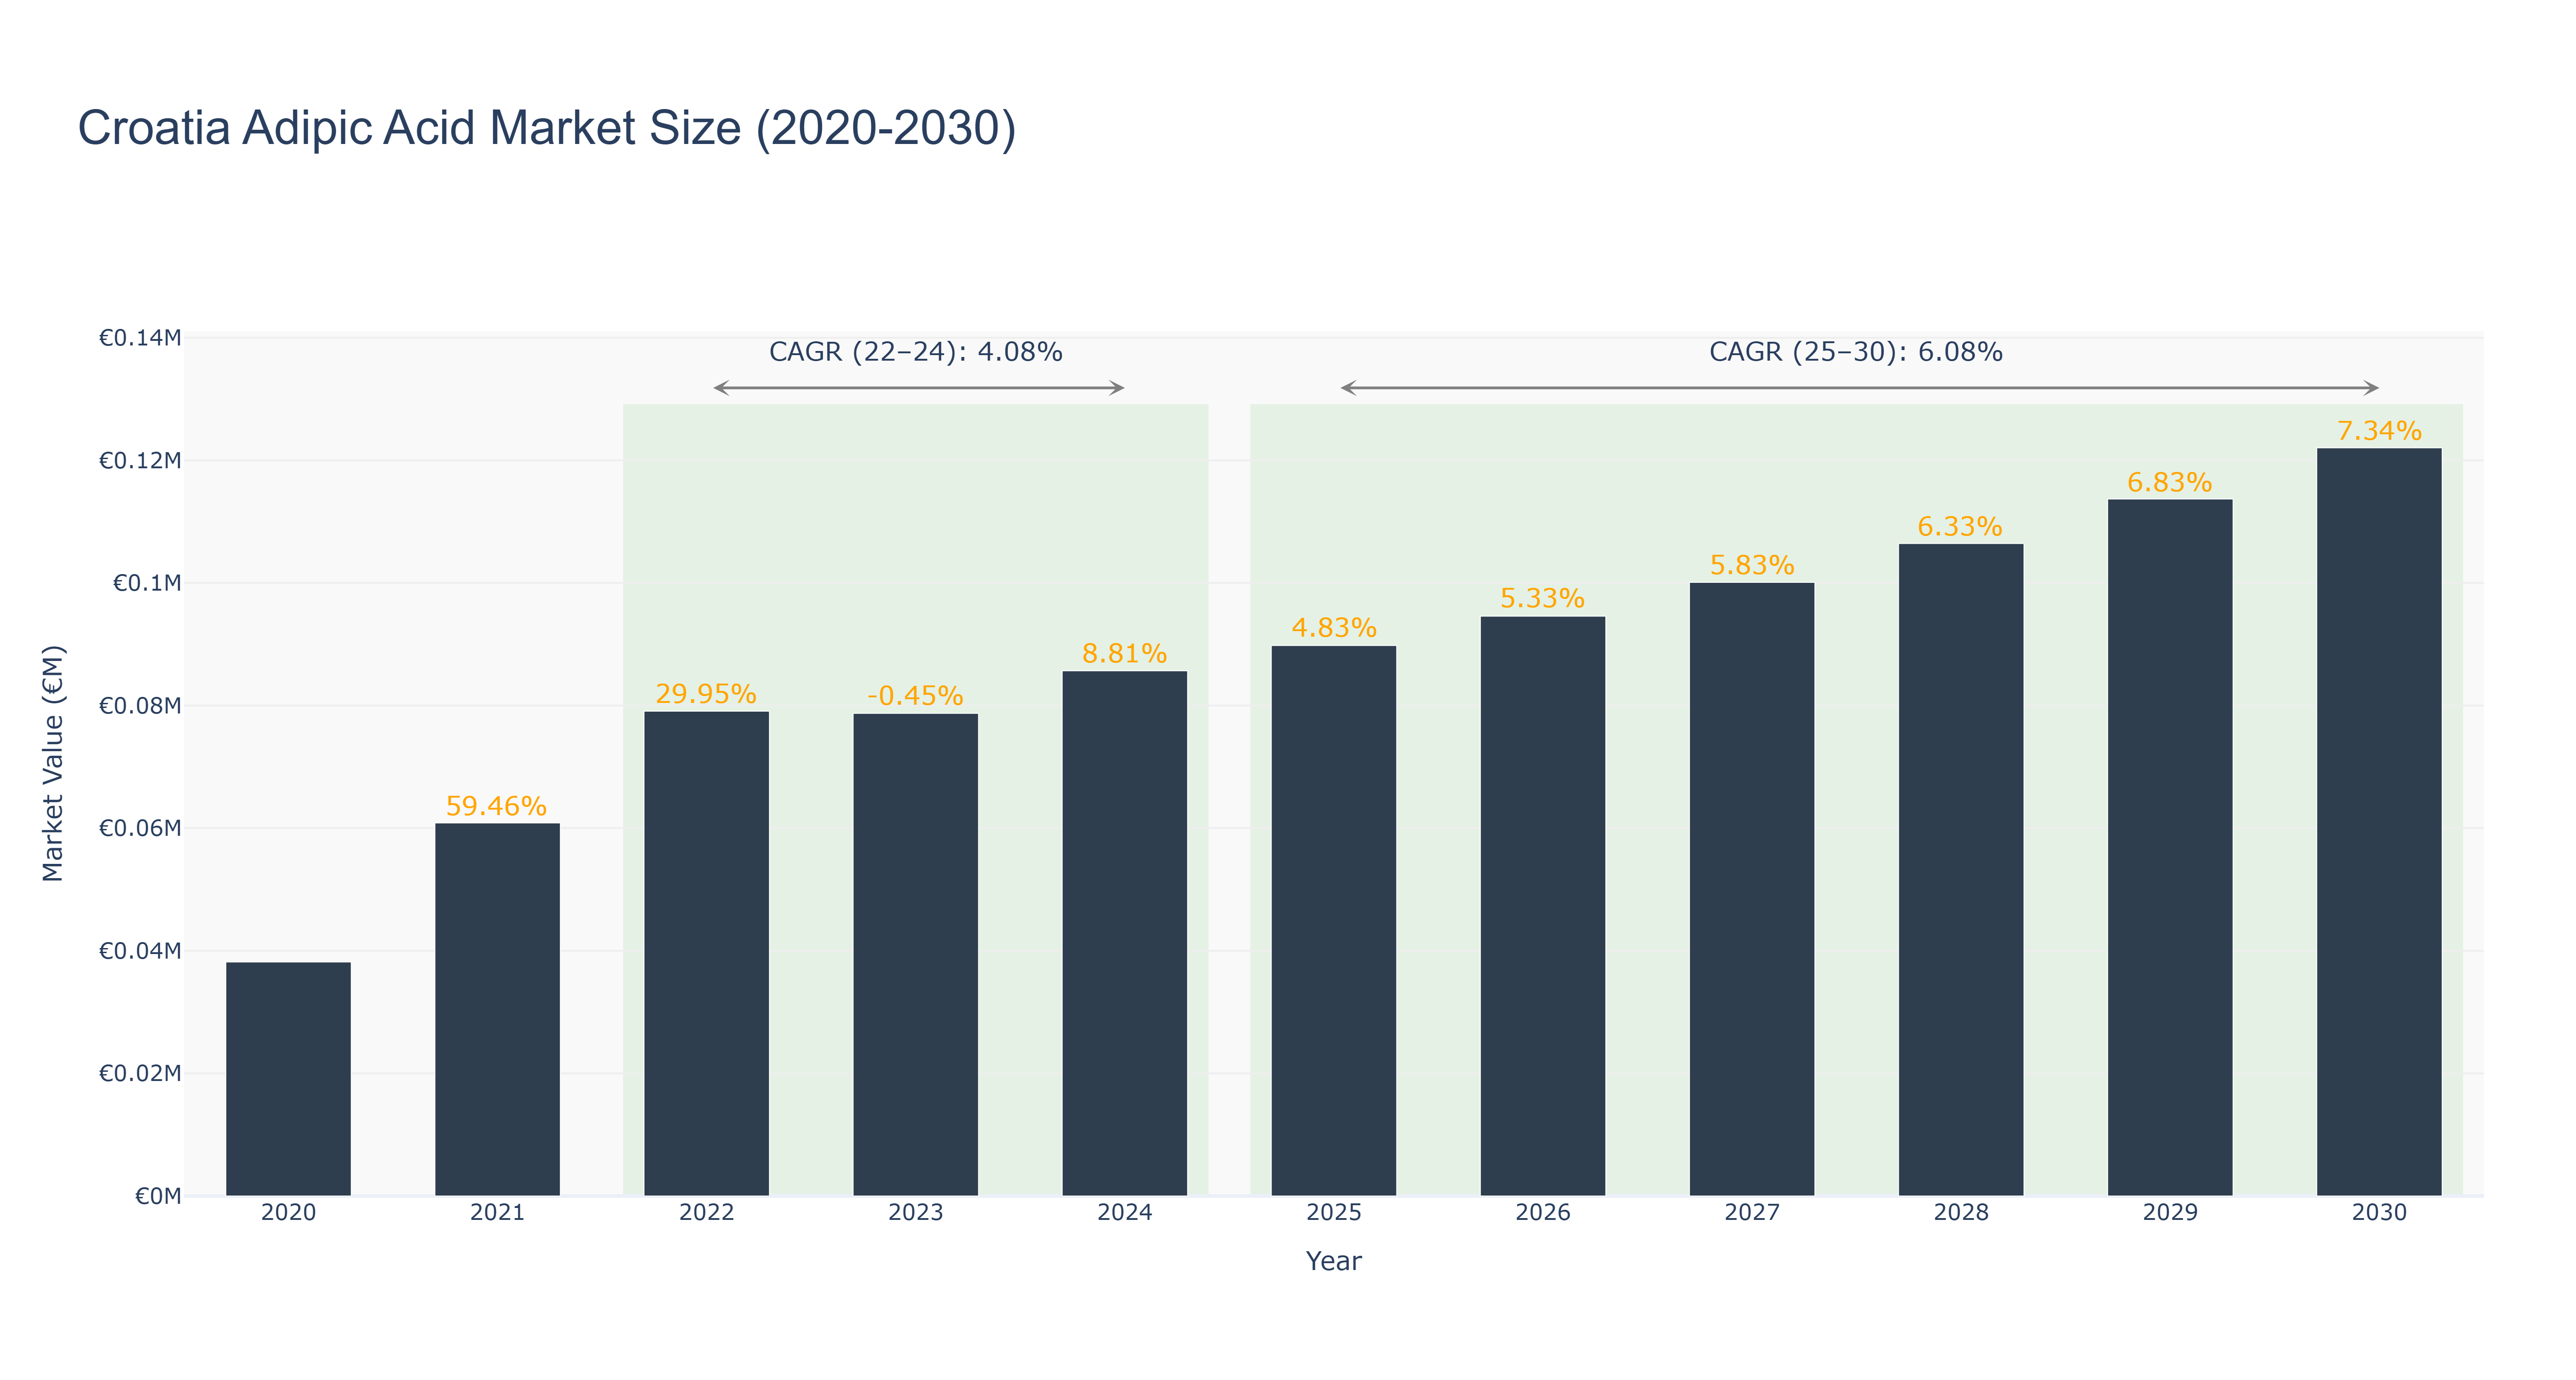
Croatia's Adipic Acid Market has shown a steady growth trajectory over the years, with the peak market size of €0.12 million expected in 2030. From 2020 to 2024, the market size increased from €0.04 million to €0.09 million, driven by increasing demand in various industries. However, a slight decline was observed in 2023 due to market saturation and economic factors. The forecasted market size from 2025 to 2030 is expected to reach €0.12 million, indicating a promising growth trend. The CAGR for the periods 2022-24 and 2025-30 are 4.08% and 6.08% respectively, reflecting a positive outlook for the market. Recent developments in Croatia's chemical industry, including investments in sustainable production methods, are poised to further boost the Adipic Acid Market in the coming years.
Croatia Adipic Acid Market: Production & Trade Performance (2019-2025)
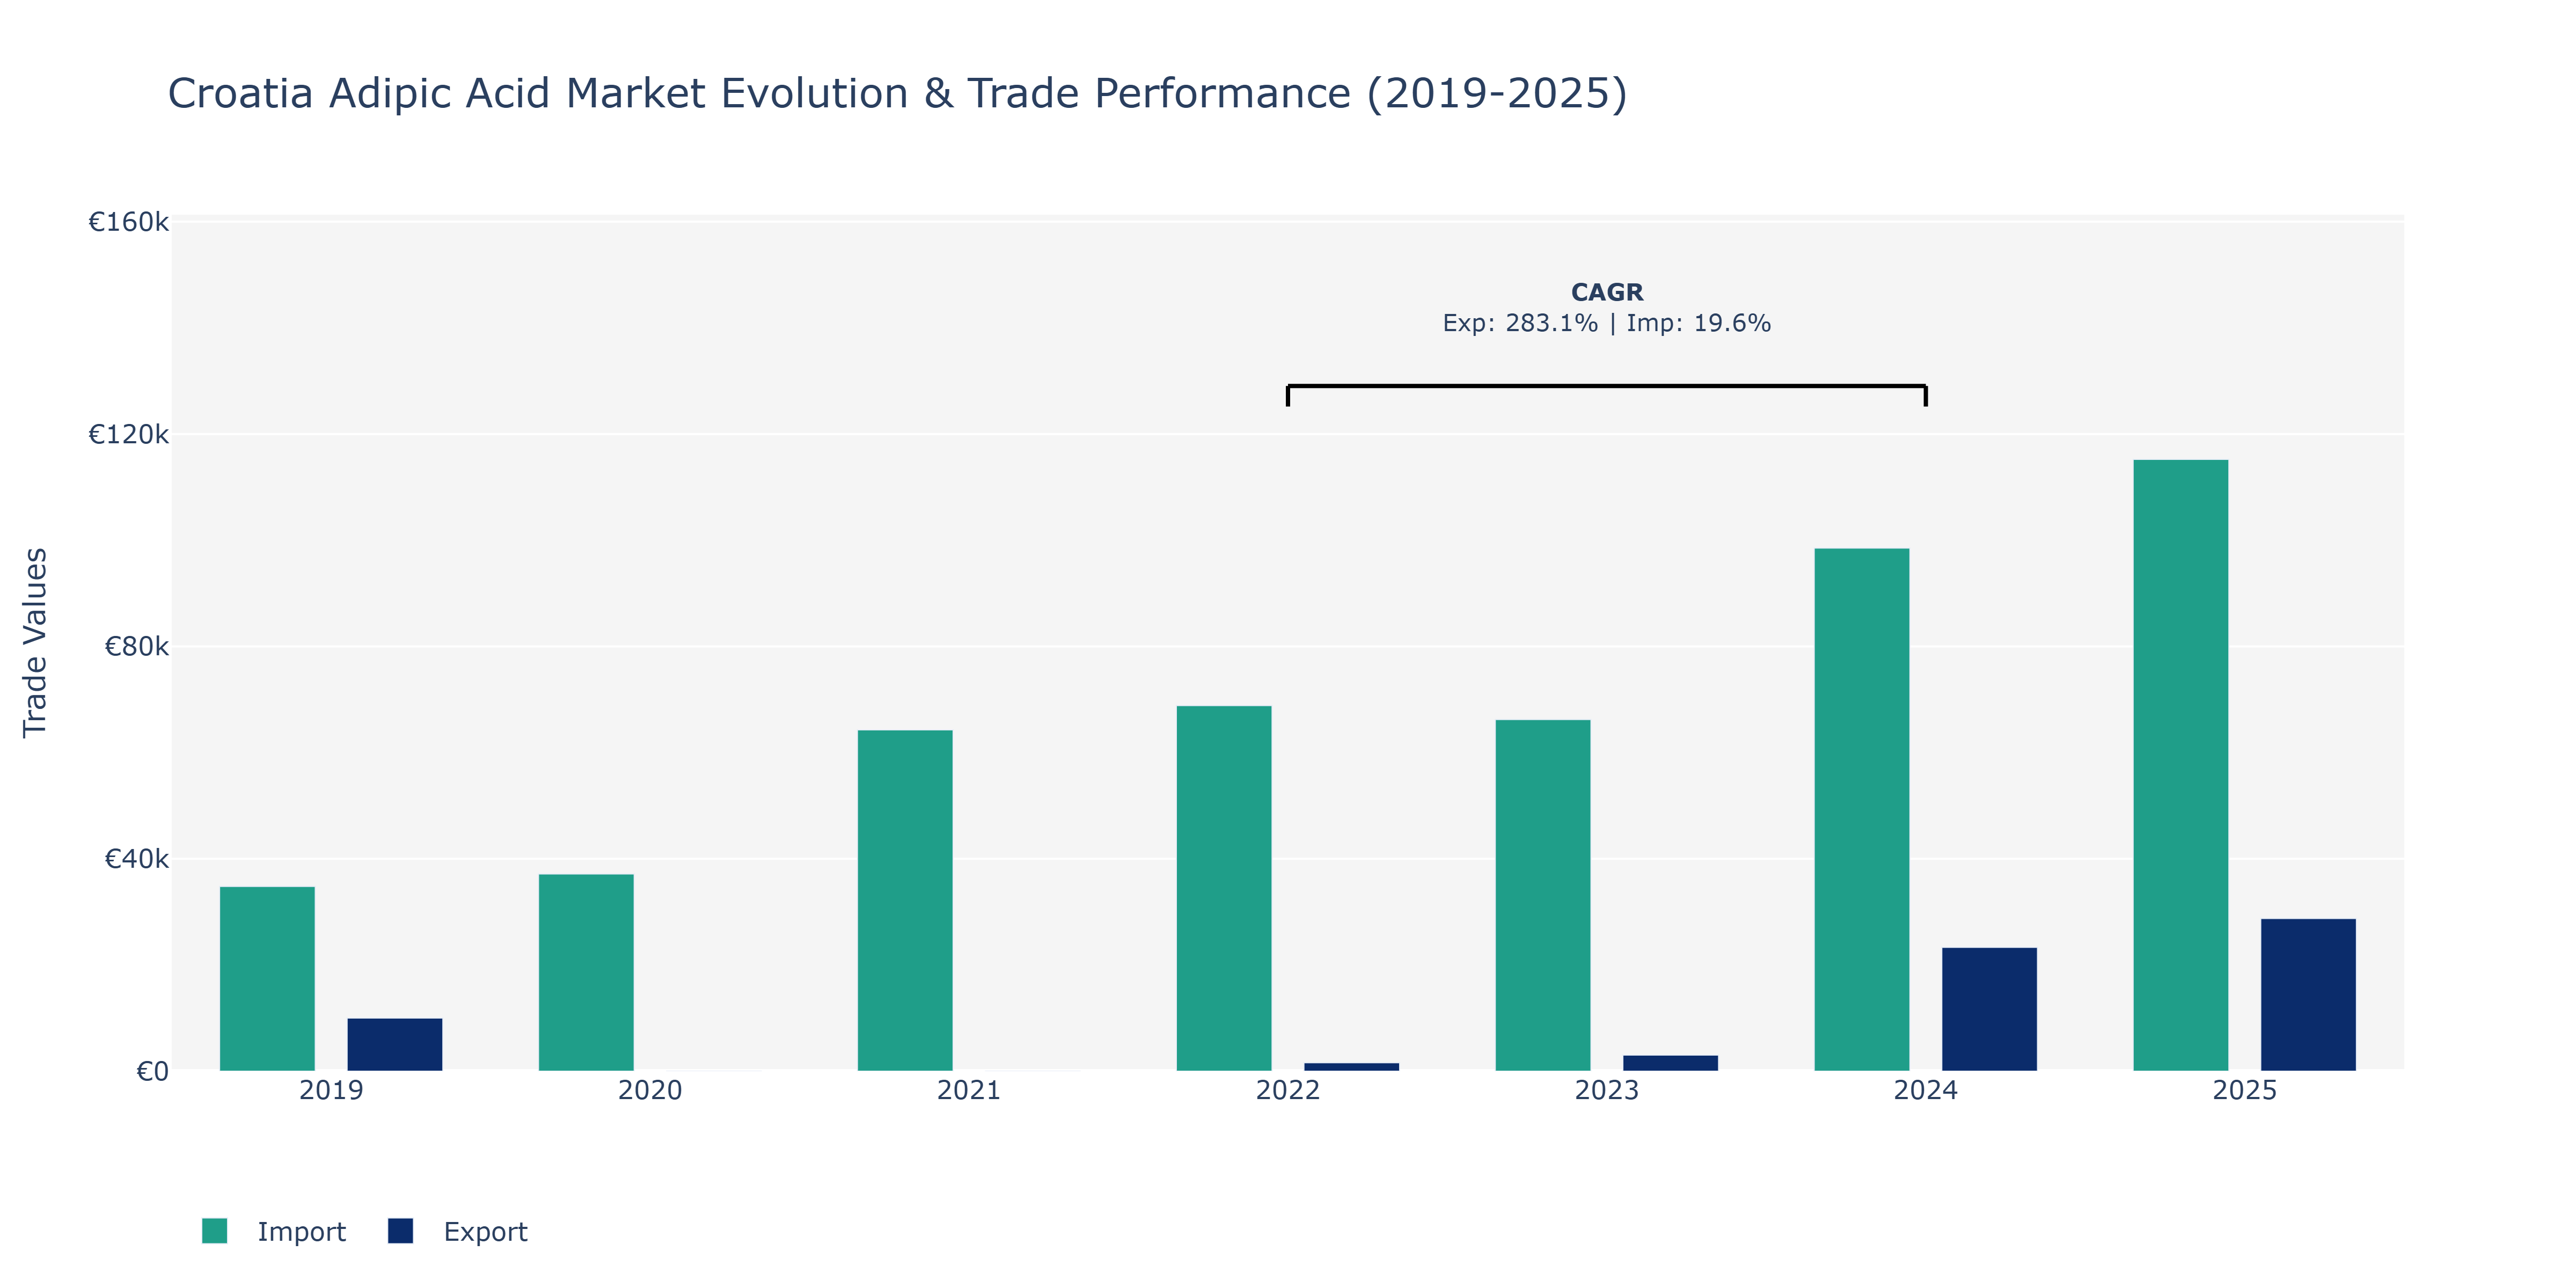
Between 2019 to 2025, Croatia's Adipic Acid Market witnessed notable fluctuations in both exports and imports. In 2019, exports were at €10.0 thousand, contrasting with a substantial jump to €23.31 thousand in 2024, representing a peak point. Similarly, imports surged from €34.79 thousand in 2019 to reach €115.22 thousand in 2025, showcasing a consistent upward trend. The year 2022 stood out for a dip in exports to €1.59 thousand while imports increased to €68.86 thousand, indicating a demand-supply imbalance. The robust growth in imports can be attributed to increased demand for Adipic Acid in various industries within Croatia, potentially driven by expanding manufacturing sectors and infrastructure development. On the other hand, the surge in exports might be linked to the country's strategic location providing access to multiple markets, enhancing its export potential in the Adipic Acid segment. Such dynamics highlight Croatia's evolving position in the global Adipic Acid trade landscape.
Key Highlights of the Report:
- Croatia Adipic acid Market Outlook
- Market Size of Croatia Adipic acid Market, 2025
- Forecast of Croatia Adipic acid Market, 2032
- Historical Data and Forecast of Croatia Adipic acid Revenues & Volume for the Period 2022 - 2032F
- Croatia Adipic acid Market Trend Evolution
- Croatia Adipic acid Market Drivers and Challenges
- Croatia Adipic acid Price Trends
- Croatia Adipic acid Porter`s Five Forces
- Croatia Adipic acid Industry Life Cycle
- Historical Data and Forecast of Croatia Adipic acid Market Revenues & Volume By Application for the Period 2022 - 2032F
- Historical Data and Forecast of Croatia Adipic acid Market Revenues & Volume By Nylon 6,6 Fiber for the Period 2022 - 2032F
- Historical Data and Forecast of Croatia Adipic acid Market Revenues & Volume By Nylon 6,6 Resin for the Period 2022 - 2032F
- Historical Data and Forecast of Croatia Adipic acid Market Revenues & Volume By Polyurethane for the Period 2022 - 2032F
- Historical Data and Forecast of Croatia Adipic acid Market Revenues & Volume By Adipate Esters for the Period 2022 - 2032F
- Historical Data and Forecast of Croatia Adipic acid Market Revenues & Volume By Others for the Period 2022 - 2032F
- Historical Data and Forecast of Croatia Adipic acid Market Revenues & Volume By Raw Material for the Period 2022 - 2032F
- Historical Data and Forecast of Croatia Adipic acid Market Revenues & Volume By Cyclohexanol for the Period 2022 - 2032F
- Historical Data and Forecast of Croatia Adipic acid Market Revenues & Volume By Cyclohexanone for the Period 2022 - 2032F
- Croatia Adipic acid Import Export Trade Statistics
- Market Opportunity Assessment By Application
- Market Opportunity Assessment By Raw Material
- Croatia Adipic acid Top Companies Market Share
- Croatia Adipic acid Competitive Benchmarking By Technical and Operational Parameters
- Croatia Adipic acid Company Profiles
- Croatia Adipic acid Key Strategic Recommendations
Frequently Asked Questions About the Market Study (FAQs):
6Wresearch actively monitors the Croatia Adipic acid Market and publishes its comprehensive annual report, highlighting emerging trends, growth drivers, revenue analysis, and forecast outlook. Our insights help businesses to make data-backed strategic decisions with ongoing market dynamics. Our analysts track relevent industries related to the Croatia Adipic acid Market, allowing our clients with actionable intelligence and reliable forecasts tailored to emerging regional needs.
Yes, we provide customisation as per your requirements. To learn more, feel free to contact us on sales@6wresearch.com
1 Executive Summary |
2 Introduction |
2.1 Key Highlights of the Report |
2.2 Report Description |
2.3 Market Scope & Segmentation |
2.4 Research Methodology |
2.5 Assumptions |
3 Croatia Adipic acid Market Overview |
3.1 Croatia Country Macro Economic Indicators |
3.2 Croatia Adipic acid Market Revenues & Volume, 2022 & 2032F |
3.3 Croatia Adipic acid Market - Industry Life Cycle |
3.4 Croatia Adipic acid Market - Porter's Five Forces |
3.5 Croatia Adipic acid Market Revenues & Volume Share, By Application, 2022 & 2032F |
3.6 Croatia Adipic acid Market Revenues & Volume Share, By Raw Material, 2022 & 2032F |
4 Croatia Adipic acid Market Dynamics |
4.1 Impact Analysis |
4.2 Market Drivers |
4.2.1 Growing demand for adipic acid in the automotive industry for the production of nylon fibers and plastics |
4.2.2 Increasing use of adipic acid in the textile industry for manufacturing clothing and furnishings |
4.2.3 Favorable government regulations promoting the use of bio-based adipic acid |
4.3 Market Restraints |
4.3.1 Fluctuating prices of raw materials used in the production of adipic acid |
4.3.2 Environmental concerns related to the manufacturing process of adipic acid |
4.3.3 Competition from alternative materials and substitutes in various end-user industries |
5 Croatia Adipic acid Market Trends |
6 Croatia Adipic acid Market Segmentations |
6.1 Croatia Adipic acid Market, By Application |
6.1.1 Overview and Analysis |
6.1.2 Croatia Adipic acid Market Revenues & Volume, By Nylon 6,6 Fiber, 2022 - 2032F |
6.1.3 Croatia Adipic acid Market Revenues & Volume, By Nylon 6,6 Resin, 2022 - 2032F |
6.1.4 Croatia Adipic acid Market Revenues & Volume, By Polyurethane, 2022 - 2032F |
6.1.5 Croatia Adipic acid Market Revenues & Volume, By Adipate Esters, 2022 - 2032F |
6.1.6 Croatia Adipic acid Market Revenues & Volume, By Others, 2022 - 2032F |
6.2 Croatia Adipic acid Market, By Raw Material |
6.2.1 Overview and Analysis |
6.2.2 Croatia Adipic acid Market Revenues & Volume, By Cyclohexanol, 2022 - 2032F |
6.2.3 Croatia Adipic acid Market Revenues & Volume, By Cyclohexanone, 2022 - 2032F |
7 Croatia Adipic acid Market Import-Export Trade Statistics |
7.1 Croatia Adipic acid Market Export to Major Countries |
7.2 Croatia Adipic acid Market Imports from Major Countries |
8 Croatia Adipic acid Market Key Performance Indicators |
8.1 Production capacity utilization rate |
8.2 Research and development investment in sustainable production methods |
8.3 Adoption rate of bio-based adipic acid technologies |
8.4 Number of patents filed for adipic acid production processes |
8.5 Compliance with environmental regulations and certifications |
9 Croatia Adipic acid Market - Opportunity Assessment |
9.1 Croatia Adipic acid Market Opportunity Assessment, By Application, 2022 & 2032F |
9.2 Croatia Adipic acid Market Opportunity Assessment, By Raw Material, 2022 & 2032F |
10 Croatia Adipic acid Market - Competitive Landscape |
10.1 Croatia Adipic acid Market Revenue Share, By Companies, 2025 |
10.2 Croatia Adipic acid Market Competitive Benchmarking, By Operating and Technical Parameters |
11 Company Profiles |
12 Recommendations | 13 Disclaimer |
Global Go To Market Strategy - 2030
Export potential enables firms to identify high-growth global markets with greater confidence by combining advanced trade intelligence with a structured quantitative methodology. The framework analyzes emerging demand trends and country-level import patterns while integrating macroeconomic and trade datasets such as GDP and population forecasts, bilateral import–export flows, tariff structures, elasticity differentials between developed and developing economies, geographic distance, and import demand projections. Using weighted trade values from 2020–2024 as the base period to project country-to-country export potential for 2030, these inputs are operationalized through calculated drivers such as gravity model parameters, tariff impact factors, and projected GDP per-capita growth. Through an analysis of hidden potentials, demand hotspots, and market conditions that are most favorable to success, this method enables firms to focus on target countries, maximize returns, and global expansion with data, backed by accuracy.
By factoring in the projected importer demand gap that is currently unmet and could be potential opportunity, it identifies the potential for the Exporter (Country) among 190 countries, against the general trade analysis, which identifies the biggest importer or exporter.
To discover high-growth global markets and optimize your business strategy:
Click Here
Pricing
- Single User License$ 1,995
- Department License$ 2,400
- Site License$ 3,120
- Global License$ 3,795

Leadership Perspectives from Industry Events
Search
Thought Leadership and Analyst Meet


Our Clients
6WResearch In News
- India Export Attractiveness Tracker 2026
- India Air Conditioner Market Set for Strong Rebound in 2026 After Weather-Led Correction and GST-Driven Recovery: 6Wresearch
- ADAS in India: How Automatic Emergency Braking, Blind Spot Detection & Driver Monitoring are Transforming Road Safety
- Doha a strategic location for EV manufacturing hub: IPA Qatar
- Demand for luxury TVs surging in the GCC, says Samsung
- Empowering Growth: The Thriving Journey of Bangladesh’s Cable Industry
Latest Reports
- Rwanda Transmission Electron Microscope Market (2026-2032)
- Republic of Moldova Transmission Electron Microscope Market (2026-2032)
- Republic of Macedonia Transmission Electron Microscope Market (2026-2032)
- Portugal Transmission Electron Microscope Market (2026-2032)
- Paraguay Transmission Electron Microscope Market (2026-2032)
- Papua New Guinea Transmission Electron Microscope Market (2026-2032)
- Panama Transmission Electron Microscope Market (2026-2032)
- Palau Transmission Electron Microscope Market (2026-2032)
- Norway Transmission Electron Microscope Market (2026-2032)
- North Korea Transmission Electron Microscope Market (2026-2032)
Industry Events and Analyst Meet

EV India Expo 2026

HIMTEX 2026

India Refining Summit 2026

India EV Show 2026

EV tech India Expo 2026
Whitepaper
- Middle East & Africa Commercial Security Market Click here to view more.
- Middle East & Africa Fire Safety Systems & Equipment Market Click here to view more.
- GCC Drone Market Click here to view more.
- Middle East Lighting Fixture Market Click here to view more.
- GCC Physical & Perimeter Security Market Click here to view more.