Croatia Biscuit mixes Market (2026-2032) | Companies, Segmentation, Industry, Outlook, Forecast, Trends, Revenue, Analysis, Share, Value, Growth & Size
Market Forecast By Functional Use (Gluten-Free, Vegan, Organic, Sugar-Free, Paleo and Others), By Distribution Channel (Conventional Grocery Stores, Specialty Natural Food Stores, Supermarkets and Hypermarkets, Online retail channels, Others), By Flavor (Chocolate, Plain, Dryfruit, Others), By Category (Conventional, Organic, Others) And Competitive Landscape
| Product Code: ETC4772727 | Publication Date: Nov 2023 | Updated Date: Apr 2026 | Product Type: Market Research Report | |
| Publisher: 6Wresearch | Author: Shubham Padhi | No. of Pages: 60 | No. of Figures: 30 | No. of Tables: 5 |
Croatia Biscuit Mixes Market Size (2020-2030)
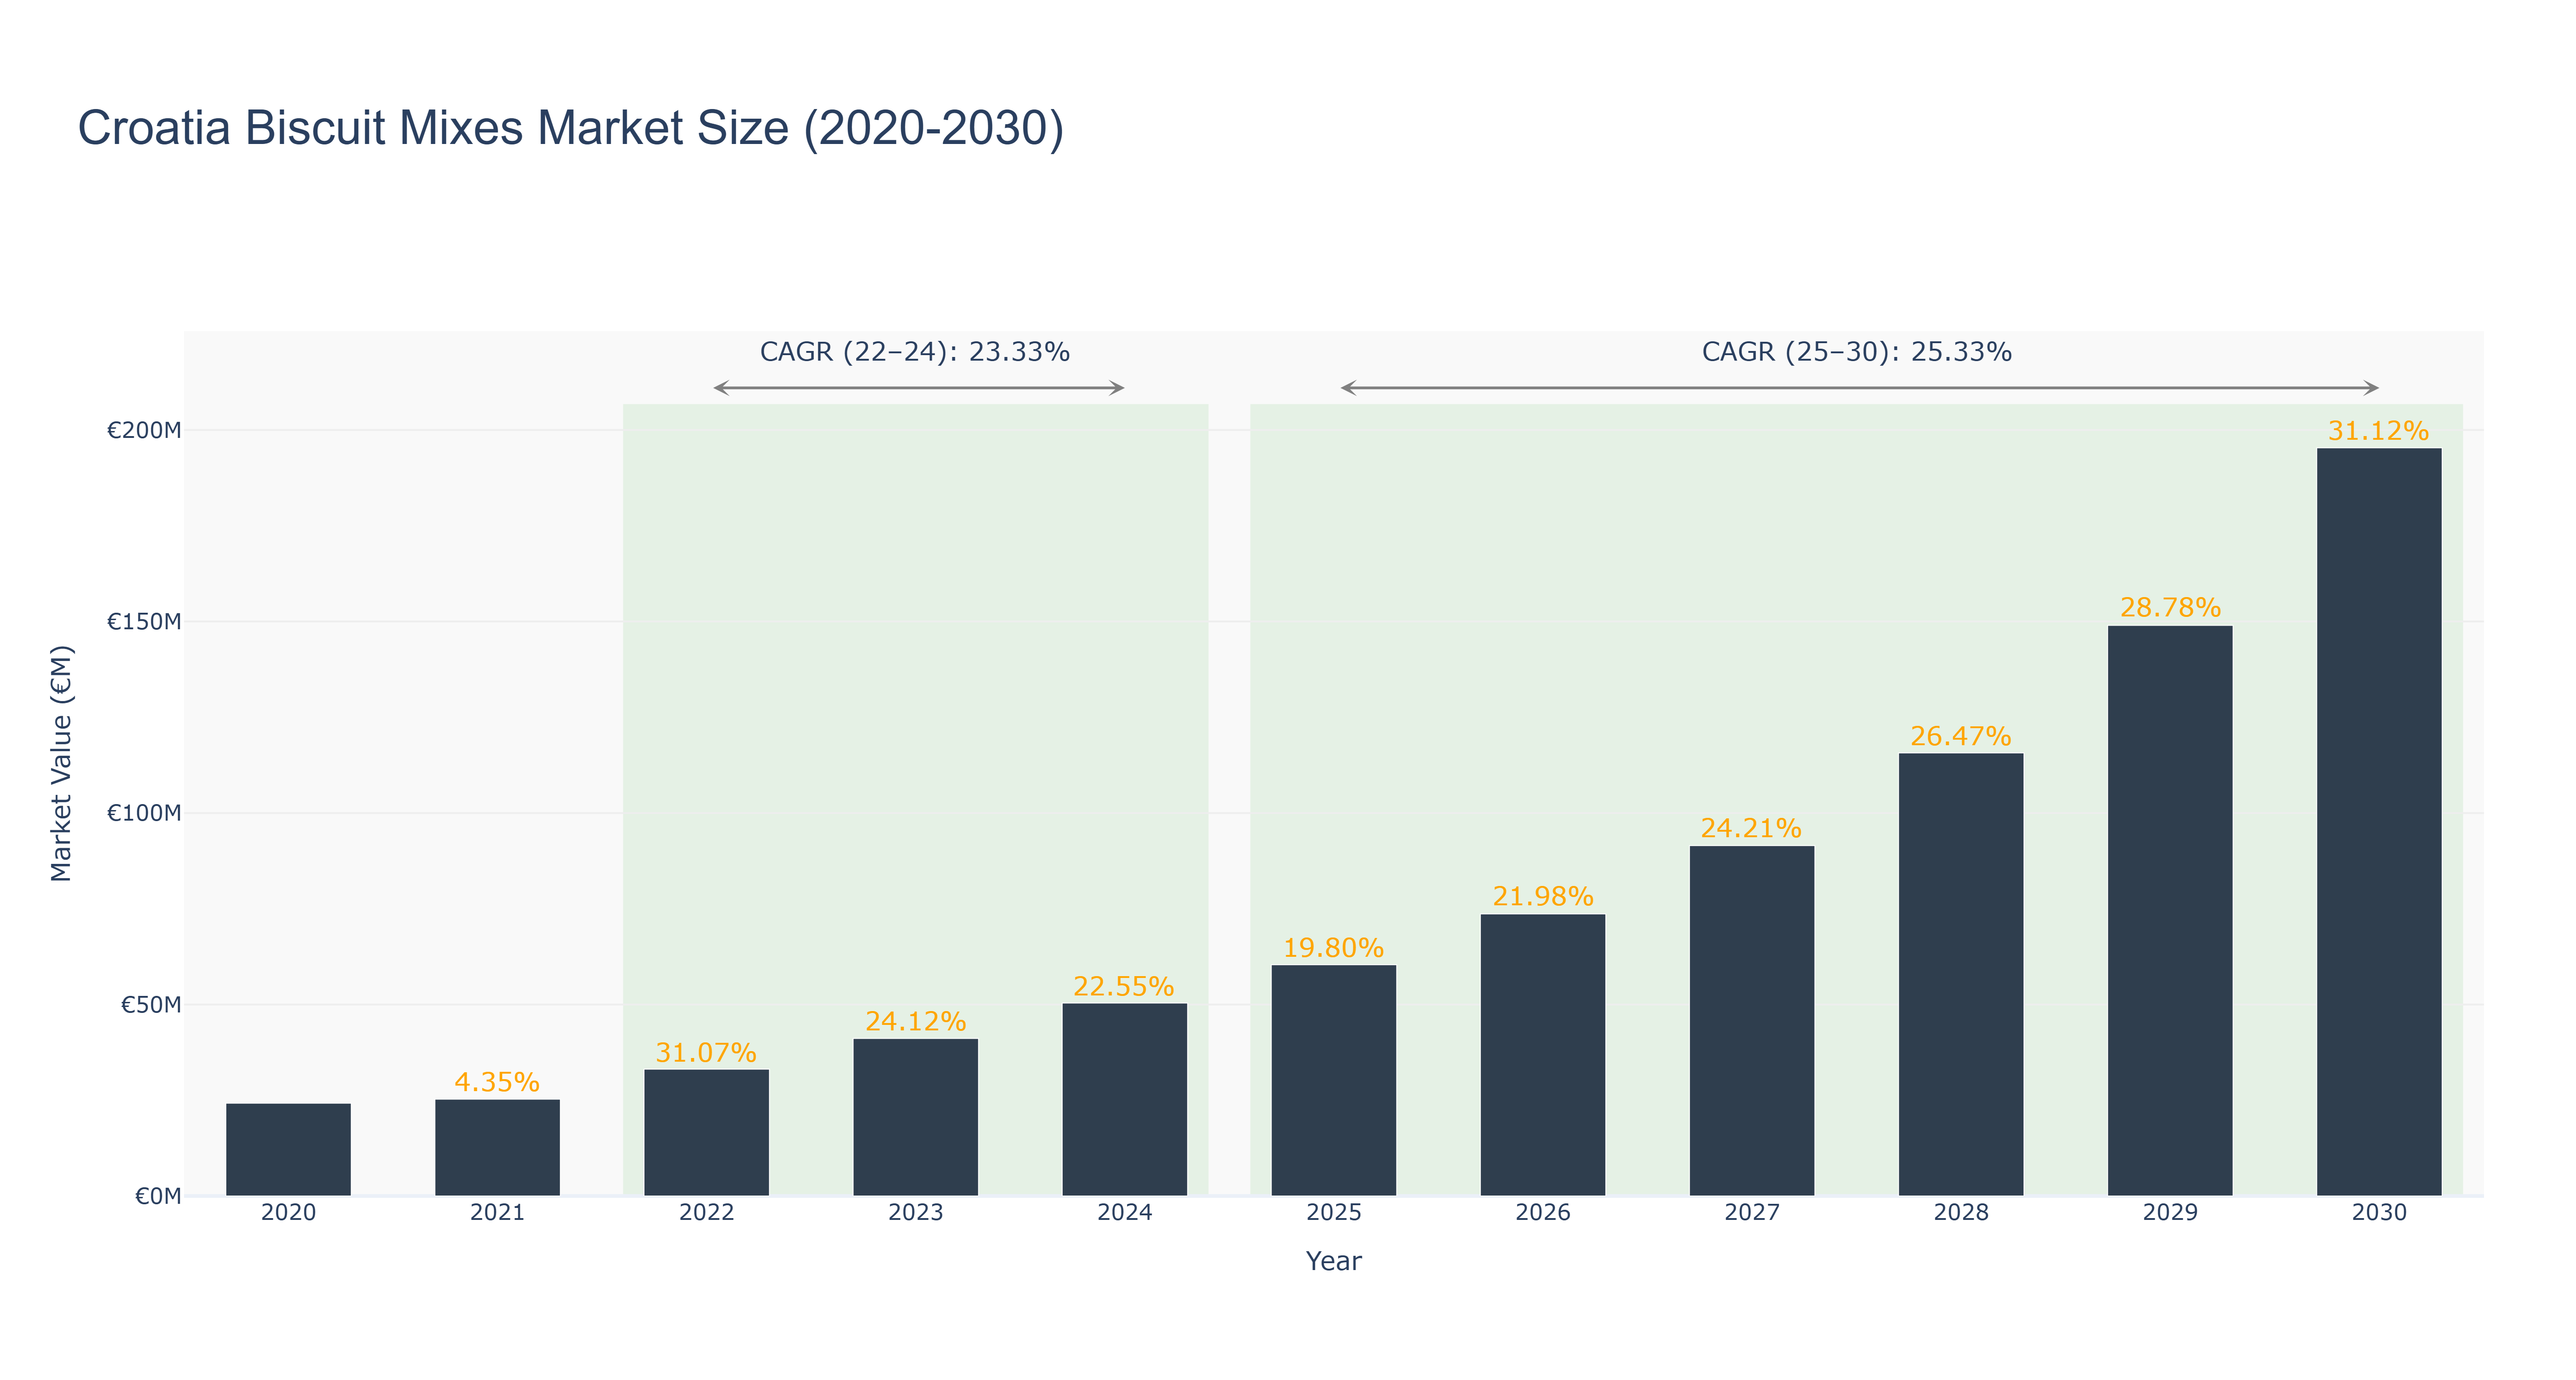
Croatia Biscuit Mixes Market has shown a steady growth trajectory over the years. The peak market size of €195.36 million is forecasted for 2030, with a notable increase in market size from €24.23 million in 2020 to €50.40 million in 2024. The CAGR for the periods 2022-24 and 2025-30 are 23.33% and 25.33% respectively. The market experienced significant growth due to increasing consumer demand for convenient baking solutions and a shift towards homemade baked goods during the pandemic. Looking ahead, the market is expected to continue its upward trend driven by innovative product offerings and expanding distribution channels. Recent developments include partnerships with local bakeries to promote biscuit mixes as a premium baking option, paving the way for increased market penetration and consumer awareness.
Croatia Biscuit Mixes Market: Production & Trade Performance (2019-2025)
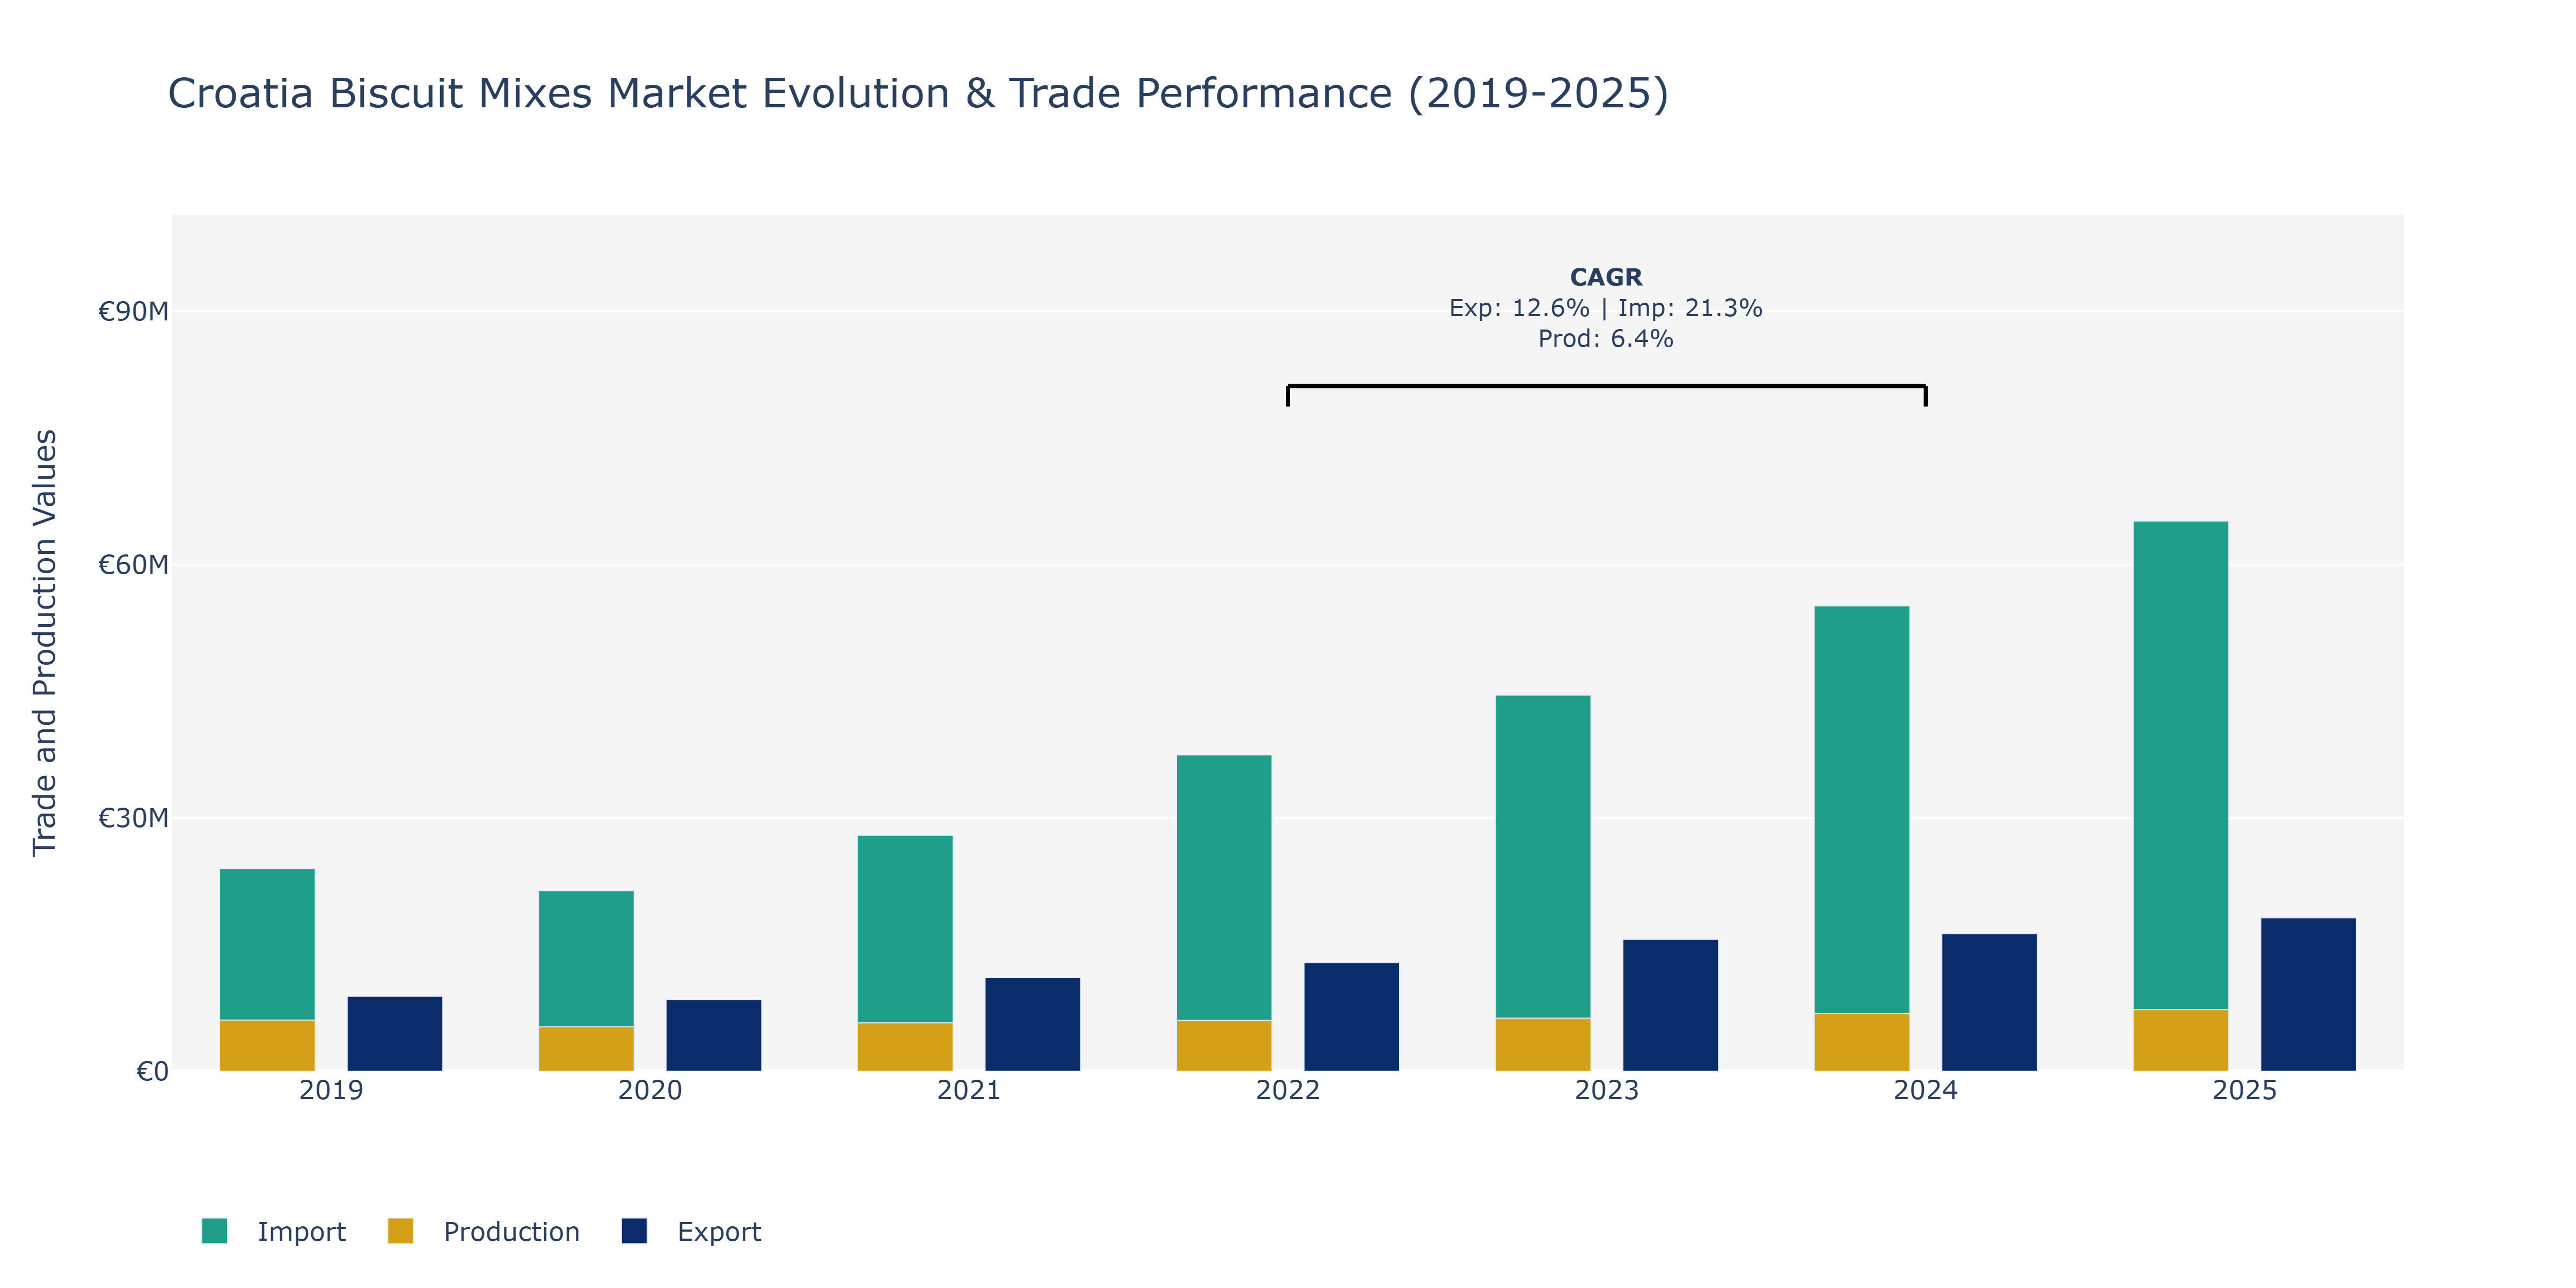
Between 2019 and 2025, Croatia's Biscuit Mixes Market demonstrated varying trends in Exports, Imports, and Production. Exports decreased from €8.87 million in 2019 to €8.5 million in 2020, showing a dip before a steady rise to €18.17 million in 2025. Conversely, Imports saw a consistent increase from €24.02 million in 2019 to €65.18 million in 2025. Production also experienced growth from €6.06 million in 2019 to €7.30 million in 2025. The surge in exports after 2020 could be attributed to the expansion of Croatia's export markets, increased demand for biscuit mixes, and potentially better trade agreements. The upward trajectory of imports may indicate a growing appetite for international biscuit mixes in Croatia, driven by changing consumer preferences and the availability of a wider range of products. The rise in production could be a response to the higher demand both domestically and abroad, leading manufacturers to increase their output capacity to meet market needs. These trends reflect Croatia's evolving position in the global biscuit mix market, aligning with the country's efforts to boost its food industry and enhance trade relations.
Key Highlights of the Report:
- Croatia Biscuit mixes Market Outlook
- Market Size of Croatia Biscuit mixes Market, 2025
- Forecast of Croatia Biscuit mixes Market, 2032
- Historical Data and Forecast of Croatia Biscuit mixes Revenues & Volume for the Period 2022 - 2032F
- Croatia Biscuit mixes Market Trend Evolution
- Croatia Biscuit mixes Market Drivers and Challenges
- Croatia Biscuit mixes Price Trends
- Croatia Biscuit mixes Porter`s Five Forces
- Croatia Biscuit mixes Industry Life Cycle
- Historical Data and Forecast of Croatia Biscuit mixes Market Revenues & Volume By Functional Use for the Period 2022 - 2032F
- Historical Data and Forecast of Croatia Biscuit mixes Market Revenues & Volume By Gluten-Free for the Period 2022 - 2032F
- Historical Data and Forecast of Croatia Biscuit mixes Market Revenues & Volume By Vegan for the Period 2022 - 2032F
- Historical Data and Forecast of Croatia Biscuit mixes Market Revenues & Volume By Organic for the Period 2022 - 2032F
- Historical Data and Forecast of Croatia Biscuit mixes Market Revenues & Volume By Sugar-Free for the Period 2022 - 2032F
- Historical Data and Forecast of Croatia Biscuit mixes Market Revenues & Volume By Paleo and Others for the Period 2022 - 2032F
- Historical Data and Forecast of Croatia Biscuit mixes Market Revenues & Volume By Distribution Channel for the Period 2022 - 2032F
- Historical Data and Forecast of Croatia Biscuit mixes Market Revenues & Volume By Conventional Grocery Stores for the Period 2022 - 2032F
- Historical Data and Forecast of Croatia Biscuit mixes Market Revenues & Volume By Specialty Natural Food Stores for the Period 2022 - 2032F
- Historical Data and Forecast of Croatia Biscuit mixes Market Revenues & Volume By Supermarkets and Hypermarkets for the Period 2022 - 2032F
- Historical Data and Forecast of Croatia Biscuit mixes Market Revenues & Volume By Online retail channels for the Period 2022 - 2032F
- Historical Data and Forecast of Croatia Biscuit mixes Market Revenues & Volume By Others for the Period 2022 - 2032F
- Historical Data and Forecast of Croatia Biscuit mixes Market Revenues & Volume By Flavor for the Period 2022 - 2032F
- Historical Data and Forecast of Croatia Biscuit mixes Market Revenues & Volume By Chocolate for the Period 2022 - 2032F
- Historical Data and Forecast of Croatia Biscuit mixes Market Revenues & Volume By Plain for the Period 2022 - 2032F
- Historical Data and Forecast of Croatia Biscuit mixes Market Revenues & Volume By Dryfruit for the Period 2022 - 2032F
- Historical Data and Forecast of Croatia Biscuit mixes Market Revenues & Volume By Others for the Period 2022 - 2032F
- Historical Data and Forecast of Croatia Biscuit mixes Market Revenues & Volume By Category for the Period 2022 - 2032F
- Historical Data and Forecast of Croatia Biscuit mixes Market Revenues & Volume By Conventional for the Period 2022 - 2032F
- Historical Data and Forecast of Croatia Biscuit mixes Market Revenues & Volume By Organic for the Period 2022 - 2032F
- Historical Data and Forecast of Croatia Biscuit mixes Market Revenues & Volume By Others for the Period 2022 - 2032F
- Croatia Biscuit mixes Import Export Trade Statistics
- Market Opportunity Assessment By Functional Use
- Market Opportunity Assessment By Distribution Channel
- Market Opportunity Assessment By Flavor
- Market Opportunity Assessment By Category
- Croatia Biscuit mixes Top Companies Market Share
- Croatia Biscuit mixes Competitive Benchmarking By Technical and Operational Parameters
- Croatia Biscuit mixes Company Profiles
- Croatia Biscuit mixes Key Strategic Recommendations
Frequently Asked Questions About the Market Study (FAQs):
6Wresearch actively monitors the Croatia Biscuit mixes Market and publishes its comprehensive annual report, highlighting emerging trends, growth drivers, revenue analysis, and forecast outlook. Our insights help businesses to make data-backed strategic decisions with ongoing market dynamics. Our analysts track relevent industries related to the Croatia Biscuit mixes Market, allowing our clients with actionable intelligence and reliable forecasts tailored to emerging regional needs.
Yes, we provide customisation as per your requirements. To learn more, feel free to contact us on sales@6wresearch.com
1 Executive Summary |
2 Introduction |
2.1 Key Highlights of the Report |
2.2 Report Description |
2.3 Market Scope & Segmentation |
2.4 Research Methodology |
2.5 Assumptions |
3 Croatia Biscuit mixes Market Overview |
3.1 Croatia Country Macro Economic Indicators |
3.2 Croatia Biscuit mixes Market Revenues & Volume, 2022 & 2032F |
3.3 Croatia Biscuit mixes Market - Industry Life Cycle |
3.4 Croatia Biscuit mixes Market - Porter's Five Forces |
3.5 Croatia Biscuit mixes Market Revenues & Volume Share, By Functional Use, 2022 & 2032F |
3.6 Croatia Biscuit mixes Market Revenues & Volume Share, By Distribution Channel, 2022 & 2032F |
3.7 Croatia Biscuit mixes Market Revenues & Volume Share, By Flavor, 2022 & 2032F |
3.8 Croatia Biscuit mixes Market Revenues & Volume Share, By Category, 2022 & 2032F |
4 Croatia Biscuit mixes Market Dynamics |
4.1 Impact Analysis |
4.2 Market Drivers |
4.2.1 Increasing consumer interest in homemade baked goods due to health and wellness trends |
4.2.2 Growing popularity of baking as a hobby and form of relaxation, especially during lockdowns |
4.2.3 Rising disposable income leading to higher spending on premium baking products |
4.3 Market Restraints |
4.3.1 Price sensitivity among consumers, especially in a price-sensitive market like Croatia |
4.3.2 Competition from ready-to-eat baked goods and convenience foods |
4.3.3 Fluctuating raw material prices impacting production costs |
5 Croatia Biscuit mixes Market Trends |
6 Croatia Biscuit mixes Market Segmentations |
6.1 Croatia Biscuit mixes Market, By Functional Use |
6.1.1 Overview and Analysis |
6.1.2 Croatia Biscuit mixes Market Revenues & Volume, By Gluten-Free, 2022 - 2032F |
6.1.3 Croatia Biscuit mixes Market Revenues & Volume, By Vegan, 2022 - 2032F |
6.1.4 Croatia Biscuit mixes Market Revenues & Volume, By Organic, 2022 - 2032F |
6.1.5 Croatia Biscuit mixes Market Revenues & Volume, By Sugar-Free, 2022 - 2032F |
6.1.6 Croatia Biscuit mixes Market Revenues & Volume, By Paleo and Others, 2022 - 2032F |
6.2 Croatia Biscuit mixes Market, By Distribution Channel |
6.2.1 Overview and Analysis |
6.2.2 Croatia Biscuit mixes Market Revenues & Volume, By Conventional Grocery Stores, 2022 - 2032F |
6.2.3 Croatia Biscuit mixes Market Revenues & Volume, By Specialty Natural Food Stores, 2022 - 2032F |
6.2.4 Croatia Biscuit mixes Market Revenues & Volume, By Supermarkets and Hypermarkets, 2022 - 2032F |
6.2.5 Croatia Biscuit mixes Market Revenues & Volume, By Online retail channels, 2022 - 2032F |
6.2.6 Croatia Biscuit mixes Market Revenues & Volume, By Others, 2022 - 2032F |
6.3 Croatia Biscuit mixes Market, By Flavor |
6.3.1 Overview and Analysis |
6.3.2 Croatia Biscuit mixes Market Revenues & Volume, By Chocolate, 2022 - 2032F |
6.3.3 Croatia Biscuit mixes Market Revenues & Volume, By Plain, 2022 - 2032F |
6.3.4 Croatia Biscuit mixes Market Revenues & Volume, By Dryfruit, 2022 - 2032F |
6.3.5 Croatia Biscuit mixes Market Revenues & Volume, By Others, 2022 - 2032F |
6.4 Croatia Biscuit mixes Market, By Category |
6.4.1 Overview and Analysis |
6.4.2 Croatia Biscuit mixes Market Revenues & Volume, By Conventional, 2022 - 2032F |
6.4.3 Croatia Biscuit mixes Market Revenues & Volume, By Organic, 2022 - 2032F |
6.4.4 Croatia Biscuit mixes Market Revenues & Volume, By Others, 2022 - 2032F |
7 Croatia Biscuit mixes Market Import-Export Trade Statistics |
7.1 Croatia Biscuit mixes Market Export to Major Countries |
7.2 Croatia Biscuit mixes Market Imports from Major Countries |
8 Croatia Biscuit mixes Market Key Performance Indicators |
8.1 Consumer engagement on social media platforms for baking-related content |
8.2 Number of baking workshops and classes held in Croatia |
8.3 Percentage of households that own baking equipment |
8.4 Growth in the number of specialty baking stores in Croatia |
8.5 Adoption rate of innovative biscuit mix flavors and varieties in the market |
9 Croatia Biscuit mixes Market - Opportunity Assessment |
9.1 Croatia Biscuit mixes Market Opportunity Assessment, By Functional Use, 2022 & 2032F |
9.2 Croatia Biscuit mixes Market Opportunity Assessment, By Distribution Channel, 2022 & 2032F |
9.3 Croatia Biscuit mixes Market Opportunity Assessment, By Flavor, 2022 & 2032F |
9.4 Croatia Biscuit mixes Market Opportunity Assessment, By Category, 2022 & 2032F |
10 Croatia Biscuit mixes Market - Competitive Landscape |
10.1 Croatia Biscuit mixes Market Revenue Share, By Companies, 2025 |
10.2 Croatia Biscuit mixes Market Competitive Benchmarking, By Operating and Technical Parameters |
11 Company Profiles |
12 Recommendations | 13 Disclaimer |
Global Go To Market Strategy - 2030
Export potential enables firms to identify high-growth global markets with greater confidence by combining advanced trade intelligence with a structured quantitative methodology. The framework analyzes emerging demand trends and country-level import patterns while integrating macroeconomic and trade datasets such as GDP and population forecasts, bilateral import–export flows, tariff structures, elasticity differentials between developed and developing economies, geographic distance, and import demand projections. Using weighted trade values from 2020–2024 as the base period to project country-to-country export potential for 2030, these inputs are operationalized through calculated drivers such as gravity model parameters, tariff impact factors, and projected GDP per-capita growth. Through an analysis of hidden potentials, demand hotspots, and market conditions that are most favorable to success, this method enables firms to focus on target countries, maximize returns, and global expansion with data, backed by accuracy.
By factoring in the projected importer demand gap that is currently unmet and could be potential opportunity, it identifies the potential for the Exporter (Country) among 190 countries, against the general trade analysis, which identifies the biggest importer or exporter.
To discover high-growth global markets and optimize your business strategy:
Click Here
Pricing
- Single User License$ 1,995
- Department License$ 2,400
- Site License$ 3,120
- Global License$ 3,795

Leadership Perspectives from Industry Events
Search
Thought Leadership and Analyst Meet


Our Clients
6WResearch In News
- India Air Conditioner Market Set for Strong Rebound in 2026 After Weather-Led Correction and GST-Driven Recovery: 6Wresearch
- ADAS in India: How Automatic Emergency Braking, Blind Spot Detection & Driver Monitoring are Transforming Road Safety
- Doha a strategic location for EV manufacturing hub: IPA Qatar
- Demand for luxury TVs surging in the GCC, says Samsung
- Empowering Growth: The Thriving Journey of Bangladesh’s Cable Industry
- Demand for luxury TVs surging in the GCC, says Samsung
Latest Reports
- Nicaragua RPG Gaming Market (2026-2032)
- New Zealand RPG Gaming Market (2026-2032)
- Netherlands RPG Gaming Market (2026-2032)
- Nauru RPG Gaming Market (2026-2032)
- Namibia RPG Gaming Market (2026-2032)
- Mozambique RPG Gaming Market (2026-2032)
- Montenegro RPG Gaming Market (2026-2032)
- Mongolia RPG Gaming Market (2026-2032)
- Monaco RPG Gaming Market (2026-2032)
- Micronesia RPG Gaming Market (2026-2032)
Industry Events and Analyst Meet

EV India Expo 2026

HIMTEX 2026

India Refining Summit 2026

India EV Show 2026

EV tech India Expo 2026
Whitepaper
- Middle East & Africa Commercial Security Market Click here to view more.
- Middle East & Africa Fire Safety Systems & Equipment Market Click here to view more.
- GCC Drone Market Click here to view more.
- Middle East Lighting Fixture Market Click here to view more.
- GCC Physical & Perimeter Security Market Click here to view more.