Croatia Canned Salmon Market (2026-2032) | Growth, Size, Share, Revenue, Trends, Value, Companies, Analysis, Segmentation, Outlook, Industry & Forecast
Market Forecast By Product Type (Sockeye Salmon, Chum salmon, Pink Salmon, Coho Salmon), By Distribution Channel (Direct Selling, Mass Retailers, Internet Retailing, Others) And Competitive Landscape
| Product Code: ETC4735886 | Publication Date: Nov 2023 | Updated Date: Apr 2026 | Product Type: Market Research Report | |
| Publisher: 6Wresearch | Author: Shubham Padhi | No. of Pages: 60 | No. of Figures: 30 | No. of Tables: 5 |
Croatia Canned Salmon Market Size (2020-2030)
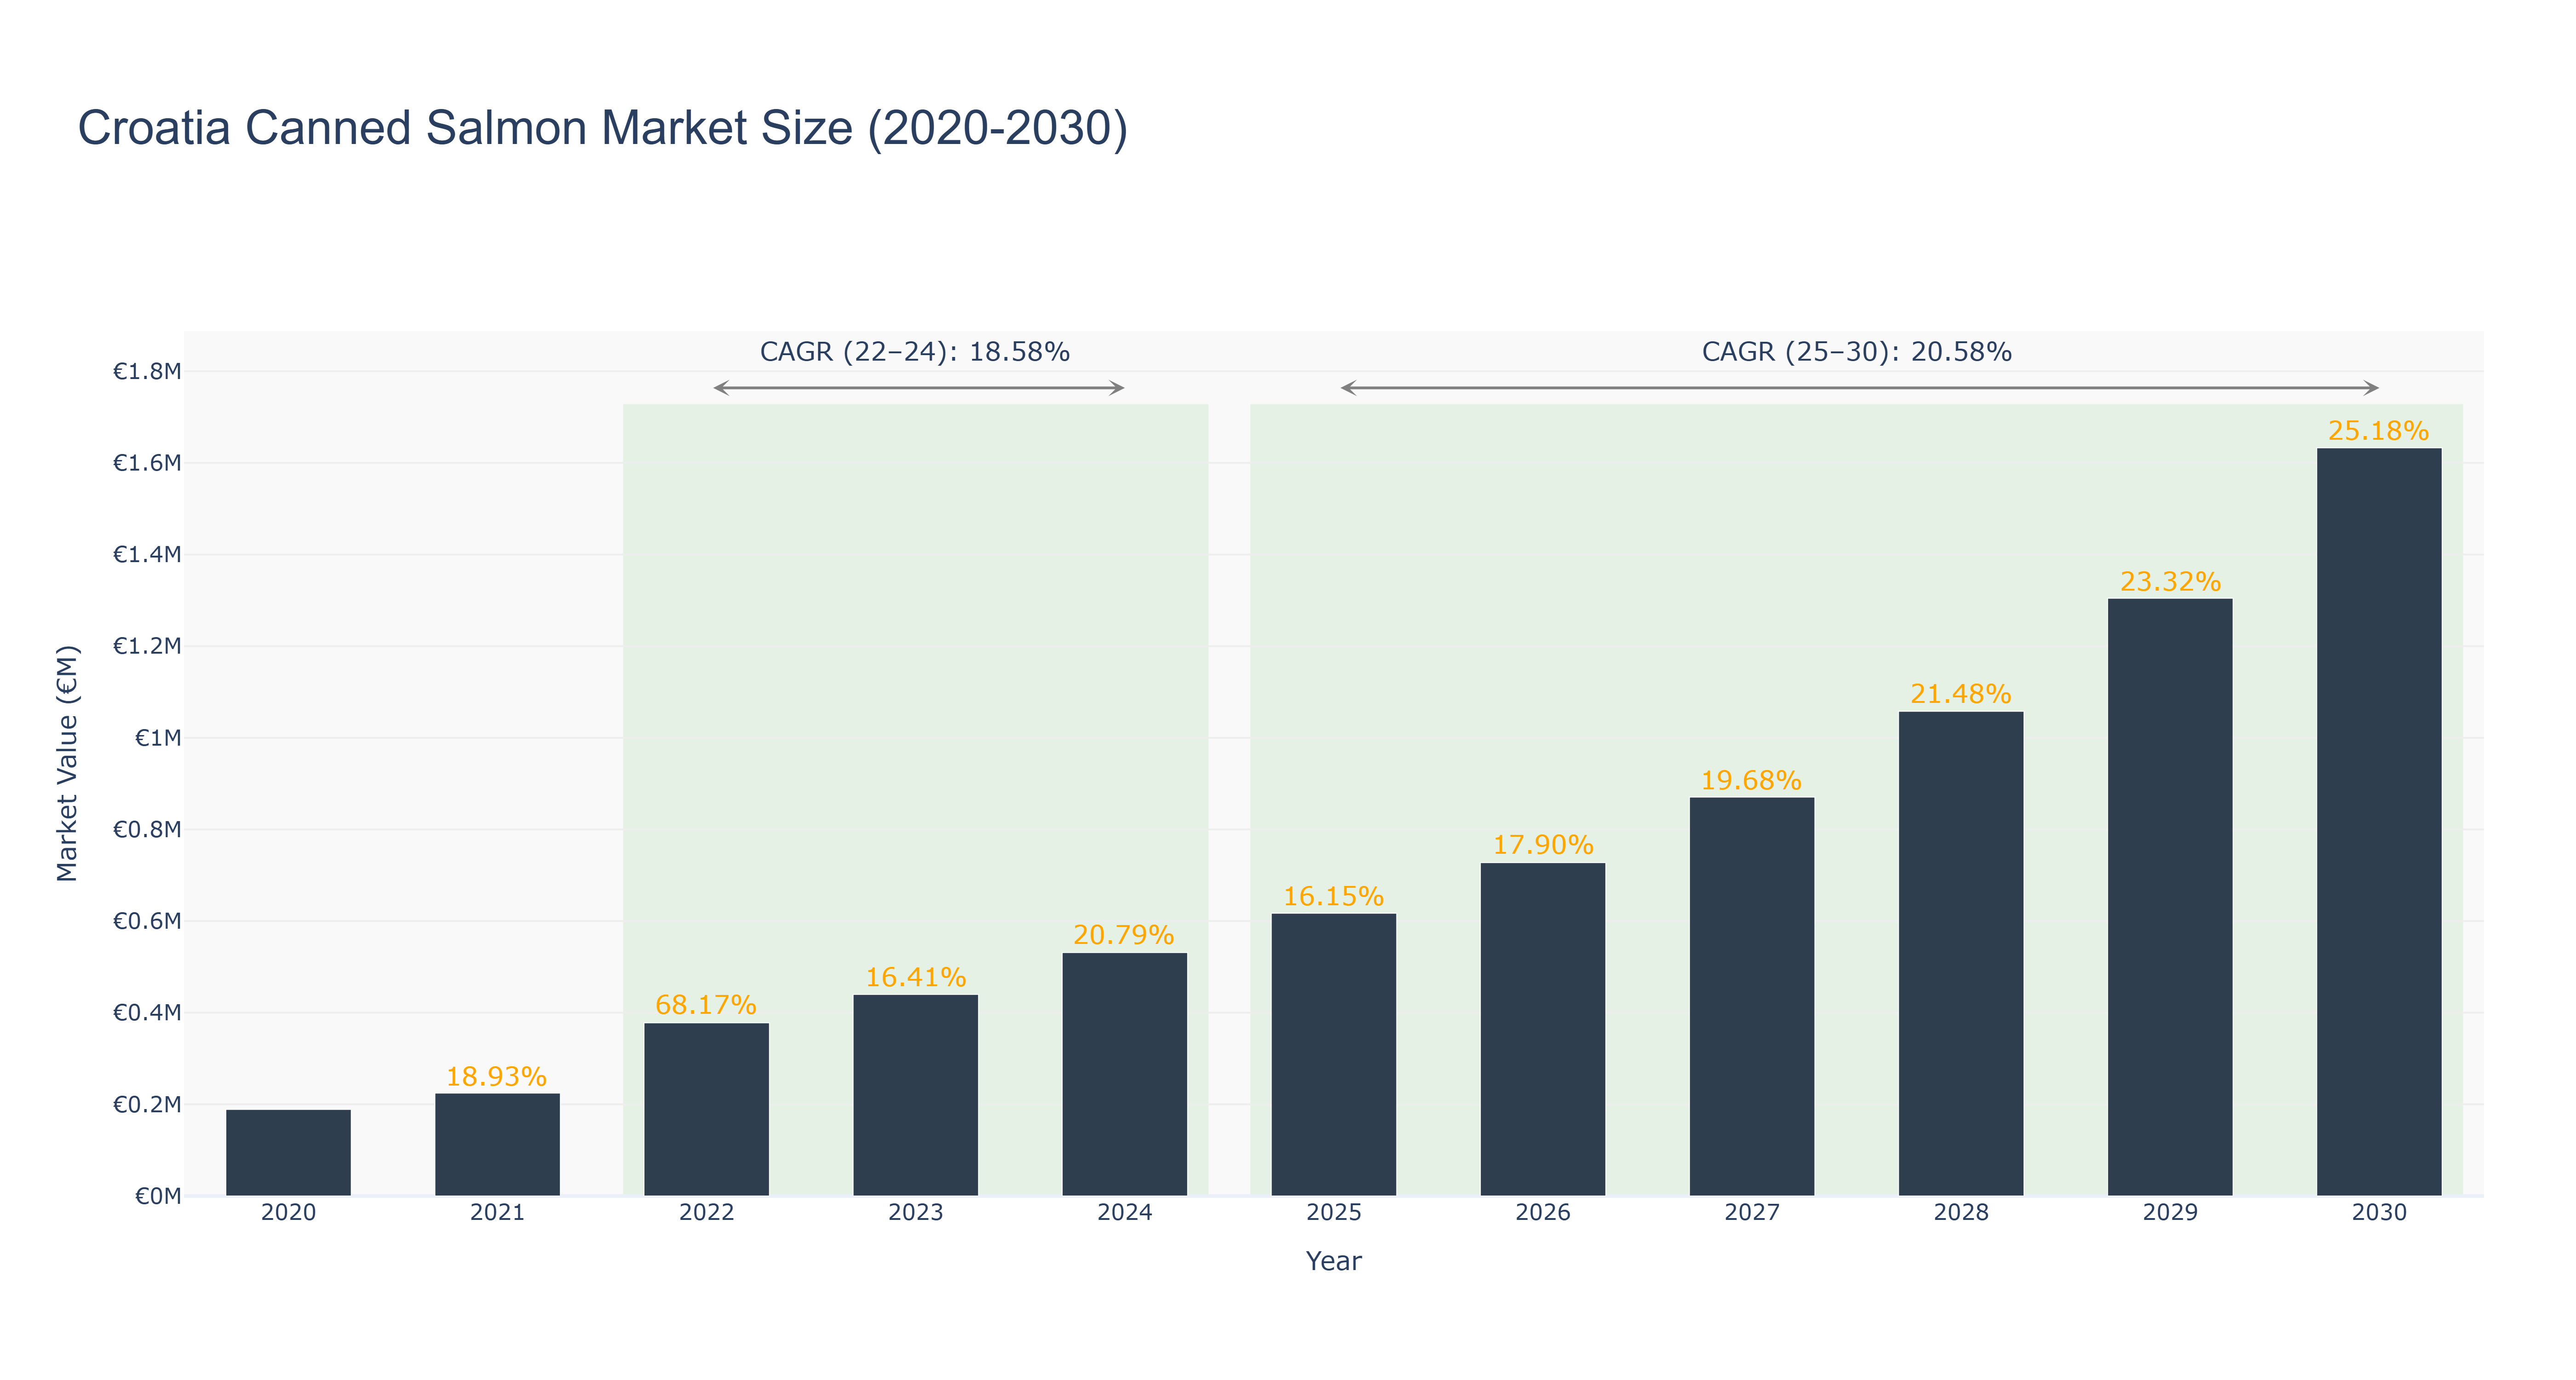
The Croatia Canned Salmon Market has demonstrated significant growth, peaking at €531.30 thousand in 2024, with a robust actual CAGR of 18.58% from 2022 to 2024. This period witnessed substantial increases, particularly in 2022, where the market size surged by 68.17%. The growth can be attributed to rising consumer interest in convenient and healthy food options, along with an increase in seafood consumption driven by health trends. Looking ahead, the forecasted period from 2025 to 2030 anticipates a continued upward trajectory, with a projected CAGR of 20.58%, culminating in a market size of approximately €1.63 million by 2030. Factors such as expected innovations in packaging and distribution, along with potential expansions in the retail sector, will likely contribute to sustained demand. Overall, the Croatia Canned Salmon Market is poised for robust growth, fueled by evolving consumer preferences and industry advancements.
Croatia Canned Salmon Market: Production & Trade Performance (2019-2025)
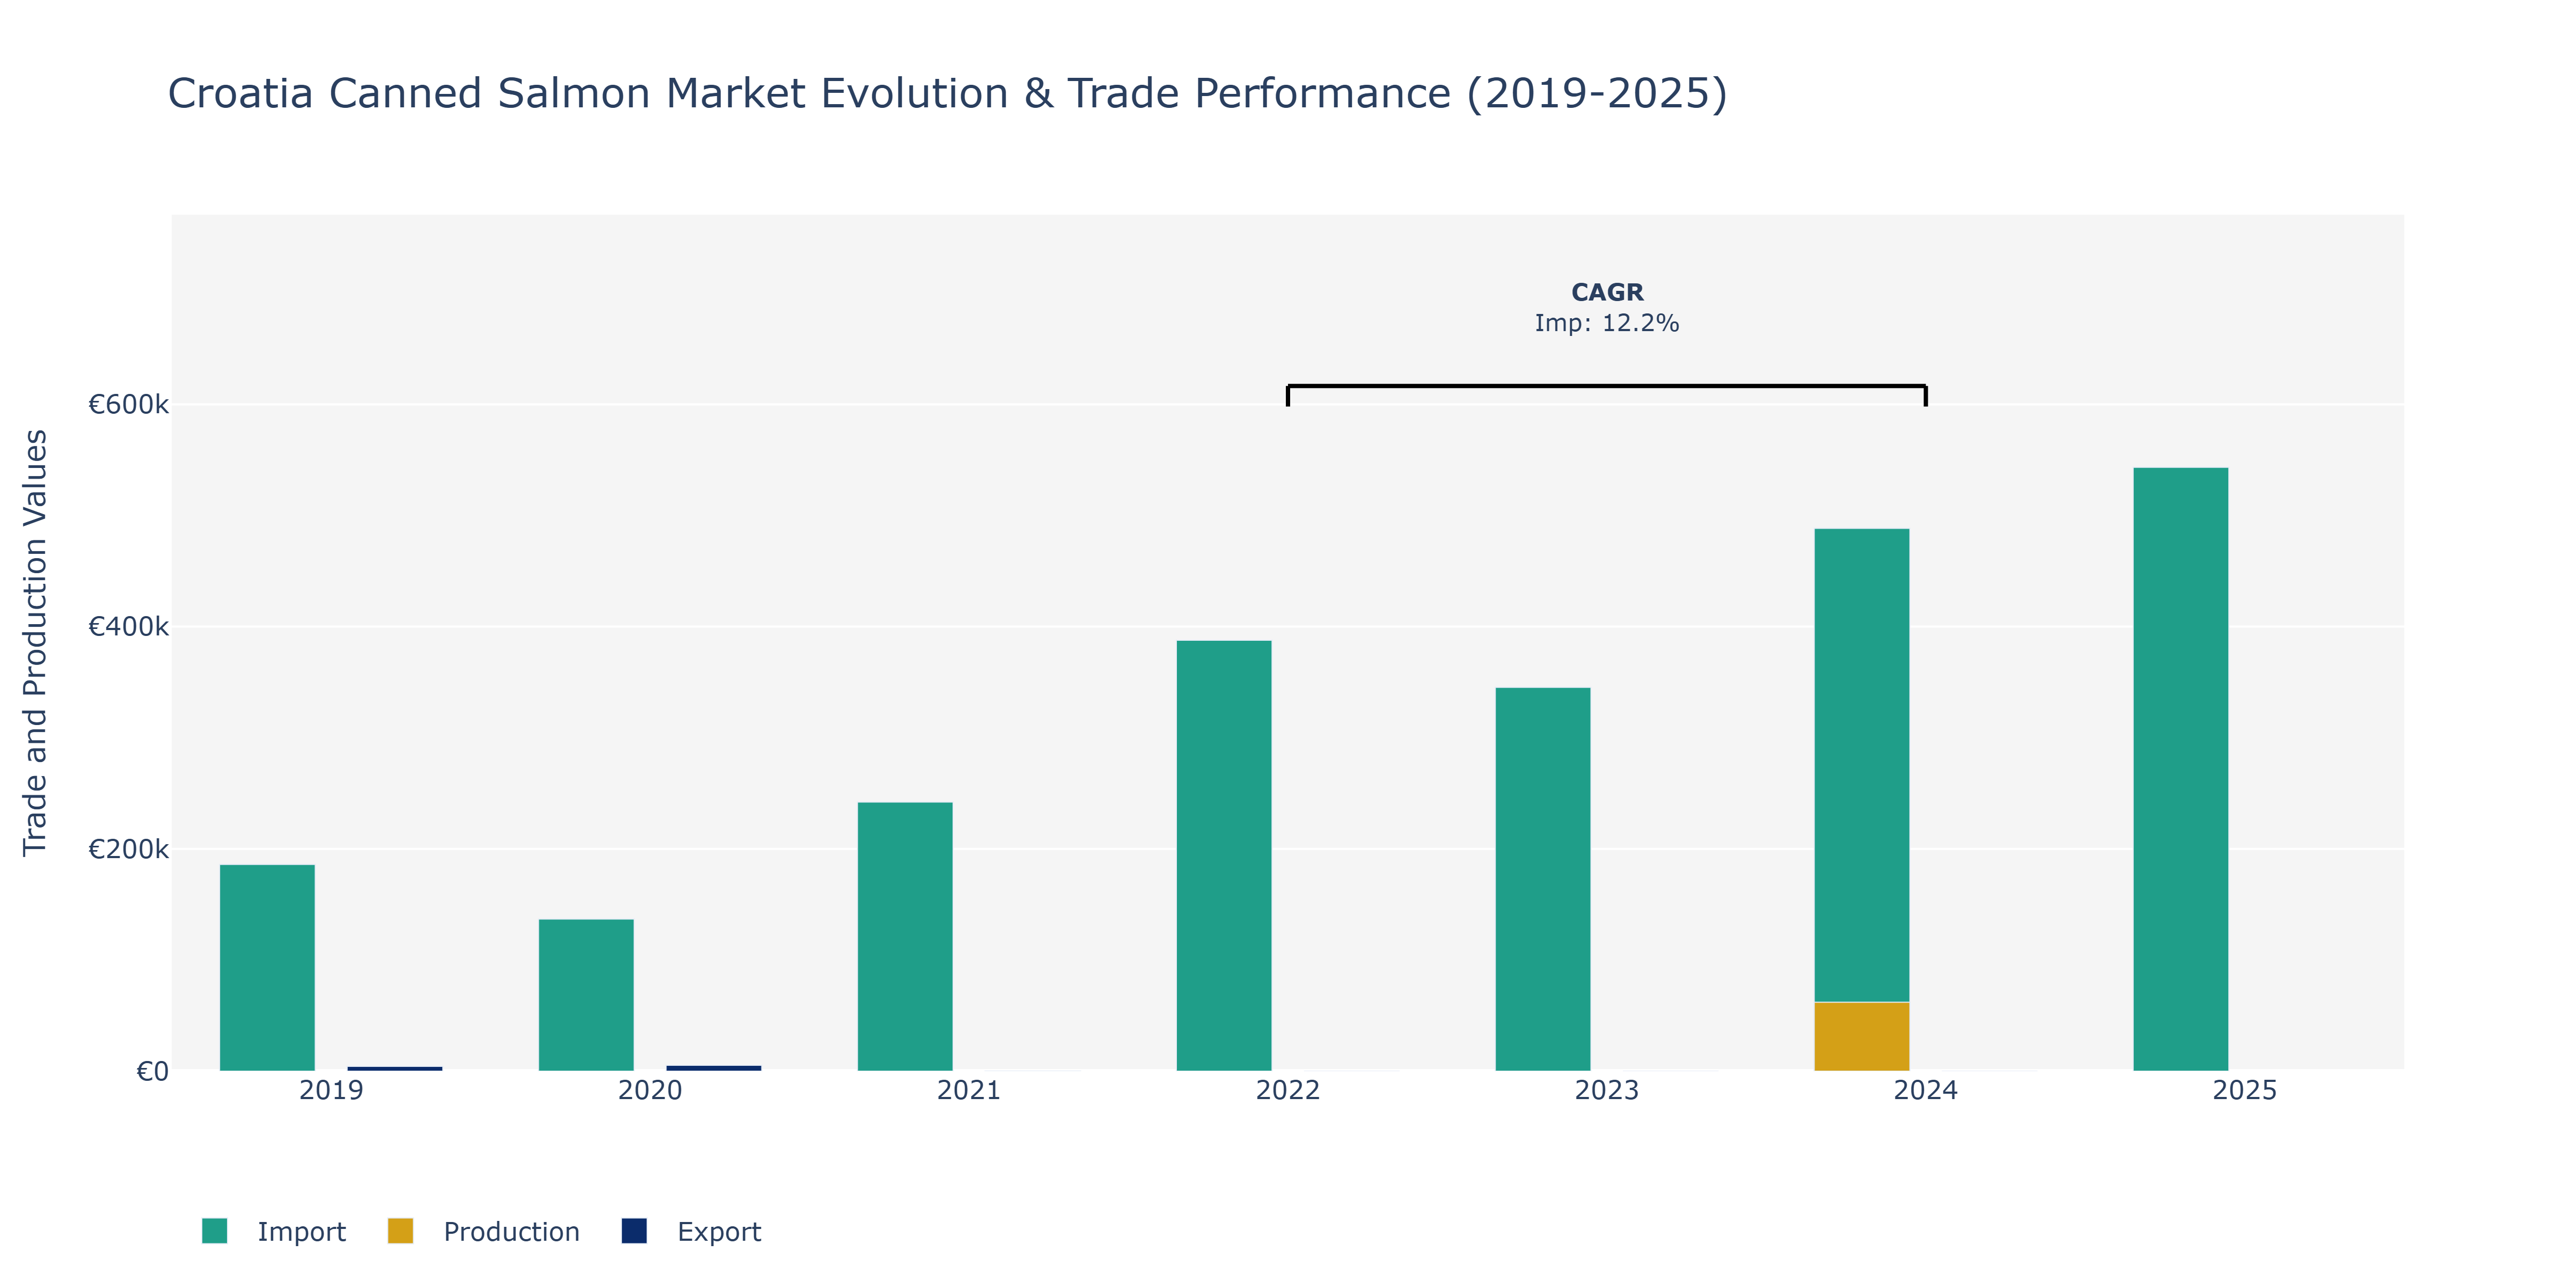
In the Croatia Canned Salmon Market, a notable decline was observed in exports from 2019 to 2021, dropping from €4.38 thousand to €0.16 thousand. This sharp decrease could be attributed to various factors such as changes in consumer preferences, global economic conditions, or disruptions in supply chains. On the import front, a contrasting trend is evident with a consistent increase from €186.07 thousand in 2019 to €543.34 thousand in 2025. The surge in imports could indicate a growing demand for canned salmon in Croatia, potentially driven by increasing health awareness or a shift towards convenient food options. Additionally, the sudden emergence of imports in 2022 at €387.73 thousand might signify a strategic shift in sourcing practices. The production value in 2024 at €62 thousand indicates a local manufacturing presence, reflecting efforts to enhance domestic production capabilities to meet rising demand and reduce reliance on imports.
Key Highlights of the Report:
- Croatia Canned Salmon Market Outlook
- Market Size of Croatia Canned Salmon Market, 2025
- Forecast of Croatia Canned Salmon Market, 2032
- Historical Data and Forecast of Croatia Canned Salmon Revenues & Volume for the Period 2022 - 2032F
- Croatia Canned Salmon Market Trend Evolution
- Croatia Canned Salmon Market Drivers and Challenges
- Croatia Canned Salmon Price Trends
- Croatia Canned Salmon Porter`s Five Forces
- Croatia Canned Salmon Industry Life Cycle
- Historical Data and Forecast of Croatia Canned Salmon Market Revenues & Volume By Product Type for the Period 2022 - 2032F
- Historical Data and Forecast of Croatia Canned Salmon Market Revenues & Volume By Sockeye Salmon for the Period 2022 - 2032F
- Historical Data and Forecast of Croatia Canned Salmon Market Revenues & Volume By Chum salmon for the Period 2022 - 2032F
- Historical Data and Forecast of Croatia Canned Salmon Market Revenues & Volume By Pink Salmon for the Period 2022 - 2032F
- Historical Data and Forecast of Croatia Canned Salmon Market Revenues & Volume By Coho Salmon for the Period 2022 - 2032F
- Historical Data and Forecast of Croatia Canned Salmon Market Revenues & Volume By Distribution Channel for the Period 2022 - 2032F
- Historical Data and Forecast of Croatia Canned Salmon Market Revenues & Volume By Direct Selling for the Period 2022 - 2032F
- Historical Data and Forecast of Croatia Canned Salmon Market Revenues & Volume By Mass Retailers for the Period 2022 - 2032F
- Historical Data and Forecast of Croatia Canned Salmon Market Revenues & Volume By Internet Retailing for the Period 2022 - 2032F
- Historical Data and Forecast of Croatia Canned Salmon Market Revenues & Volume By Others for the Period 2022 - 2032F
- Croatia Canned Salmon Import Export Trade Statistics
- Market Opportunity Assessment By Product Type
- Market Opportunity Assessment By Distribution Channel
- Croatia Canned Salmon Top Companies Market Share
- Croatia Canned Salmon Competitive Benchmarking By Technical and Operational Parameters
- Croatia Canned Salmon Company Profiles
- Croatia Canned Salmon Key Strategic Recommendations
Frequently Asked Questions About the Market Study (FAQs):
6Wresearch actively monitors the Croatia Canned Salmon Market and publishes its comprehensive annual report, highlighting emerging trends, growth drivers, revenue analysis, and forecast outlook. Our insights help businesses to make data-backed strategic decisions with ongoing market dynamics. Our analysts track relevent industries related to the Croatia Canned Salmon Market, allowing our clients with actionable intelligence and reliable forecasts tailored to emerging regional needs.
Yes, we provide customisation as per your requirements. To learn more, feel free to contact us on sales@6wresearch.com
1 Executive Summary |
2 Introduction |
2.1 Key Highlights of the Report |
2.2 Report Description |
2.3 Market Scope & Segmentation |
2.4 Research Methodology |
2.5 Assumptions |
3 Croatia Canned Salmon Market Overview |
3.1 Croatia Country Macro Economic Indicators |
3.2 Croatia Canned Salmon Market Revenues & Volume, 2022 & 2032F |
3.3 Croatia Canned Salmon Market - Industry Life Cycle |
3.4 Croatia Canned Salmon Market - Porter's Five Forces |
3.5 Croatia Canned Salmon Market Revenues & Volume Share, By Product Type, 2022 & 2032F |
3.6 Croatia Canned Salmon Market Revenues & Volume Share, By Distribution Channel, 2022 & 2032F |
4 Croatia Canned Salmon Market Dynamics |
4.1 Impact Analysis |
4.2 Market Drivers |
4.2.1 Increasing consumer awareness about the health benefits of consuming salmon |
4.2.2 Growing demand for convenient and ready-to-eat seafood products |
4.2.3 Rising popularity of canned salmon as a versatile ingredient in various cuisines |
4.3 Market Restraints |
4.3.1 Fluctuations in raw material prices affecting production costs |
4.3.2 Competition from other protein sources like chicken and beef |
4.3.3 Concerns over sustainability and environmental impact of salmon farming practices |
5 Croatia Canned Salmon Market Trends |
6 Croatia Canned Salmon Market Segmentations |
6.1 Croatia Canned Salmon Market, By Product Type |
6.1.1 Overview and Analysis |
6.1.2 Croatia Canned Salmon Market Revenues & Volume, By Sockeye Salmon, 2022 - 2032F |
6.1.3 Croatia Canned Salmon Market Revenues & Volume, By Chum salmon, 2022 - 2032F |
6.1.4 Croatia Canned Salmon Market Revenues & Volume, By Pink Salmon, 2022 - 2032F |
6.1.5 Croatia Canned Salmon Market Revenues & Volume, By Coho Salmon, 2022 - 2032F |
6.2 Croatia Canned Salmon Market, By Distribution Channel |
6.2.1 Overview and Analysis |
6.2.2 Croatia Canned Salmon Market Revenues & Volume, By Direct Selling, 2022 - 2032F |
6.2.3 Croatia Canned Salmon Market Revenues & Volume, By Mass Retailers, 2022 - 2032F |
6.2.4 Croatia Canned Salmon Market Revenues & Volume, By Internet Retailing, 2022 - 2032F |
6.2.5 Croatia Canned Salmon Market Revenues & Volume, By Others, 2022 - 2032F |
7 Croatia Canned Salmon Market Import-Export Trade Statistics |
7.1 Croatia Canned Salmon Market Export to Major Countries |
7.2 Croatia Canned Salmon Market Imports from Major Countries |
8 Croatia Canned Salmon Market Key Performance Indicators |
8.1 Average selling price of canned salmon in Croatia |
8.2 Consumer satisfaction ratings of canned salmon products |
8.3 Number of new product launches in the canned salmon segment |
8.4 Percentage of households in Croatia regularly purchasing canned salmon |
8.5 Growth rate of online sales of canned salmon in Croatia |
9 Croatia Canned Salmon Market - Opportunity Assessment |
9.1 Croatia Canned Salmon Market Opportunity Assessment, By Product Type, 2022 & 2032F |
9.2 Croatia Canned Salmon Market Opportunity Assessment, By Distribution Channel, 2022 & 2032F |
10 Croatia Canned Salmon Market - Competitive Landscape |
10.1 Croatia Canned Salmon Market Revenue Share, By Companies, 2025 |
10.2 Croatia Canned Salmon Market Competitive Benchmarking, By Operating and Technical Parameters |
11 Company Profiles |
12 Recommendations | 13 Disclaimer |
Global Go To Market Strategy - 2030
Export potential enables firms to identify high-growth global markets with greater confidence by combining advanced trade intelligence with a structured quantitative methodology. The framework analyzes emerging demand trends and country-level import patterns while integrating macroeconomic and trade datasets such as GDP and population forecasts, bilateral import–export flows, tariff structures, elasticity differentials between developed and developing economies, geographic distance, and import demand projections. Using weighted trade values from 2020–2024 as the base period to project country-to-country export potential for 2030, these inputs are operationalized through calculated drivers such as gravity model parameters, tariff impact factors, and projected GDP per-capita growth. Through an analysis of hidden potentials, demand hotspots, and market conditions that are most favorable to success, this method enables firms to focus on target countries, maximize returns, and global expansion with data, backed by accuracy.
By factoring in the projected importer demand gap that is currently unmet and could be potential opportunity, it identifies the potential for the Exporter (Country) among 190 countries, against the general trade analysis, which identifies the biggest importer or exporter.
To discover high-growth global markets and optimize your business strategy:
Click Here
Pricing
- Single User License$ 1,995
- Department License$ 2,400
- Site License$ 3,120
- Global License$ 3,795

Leadership Perspectives from Industry Events
Search
Thought Leadership and Analyst Meet


Our Clients
6WResearch In News
- India Air Conditioner Market Set for Strong Rebound in 2026 After Weather-Led Correction and GST-Driven Recovery: 6Wresearch
- ADAS in India: How Automatic Emergency Braking, Blind Spot Detection & Driver Monitoring are Transforming Road Safety
- Doha a strategic location for EV manufacturing hub: IPA Qatar
- Demand for luxury TVs surging in the GCC, says Samsung
- Empowering Growth: The Thriving Journey of Bangladesh’s Cable Industry
- Demand for luxury TVs surging in the GCC, says Samsung
Latest Reports
- Nicaragua RPG Gaming Market (2026-2032)
- New Zealand RPG Gaming Market (2026-2032)
- Netherlands RPG Gaming Market (2026-2032)
- Nauru RPG Gaming Market (2026-2032)
- Namibia RPG Gaming Market (2026-2032)
- Mozambique RPG Gaming Market (2026-2032)
- Montenegro RPG Gaming Market (2026-2032)
- Mongolia RPG Gaming Market (2026-2032)
- Monaco RPG Gaming Market (2026-2032)
- Micronesia RPG Gaming Market (2026-2032)
Industry Events and Analyst Meet

EV India Expo 2026

HIMTEX 2026

India Refining Summit 2026

India EV Show 2026

EV tech India Expo 2026
Whitepaper
- Middle East & Africa Commercial Security Market Click here to view more.
- Middle East & Africa Fire Safety Systems & Equipment Market Click here to view more.
- GCC Drone Market Click here to view more.
- Middle East Lighting Fixture Market Click here to view more.
- GCC Physical & Perimeter Security Market Click here to view more.