Croatia Check Valve Market (2026-2032) | Size, Forecast, Analysis, Trends, Share, Value, Segmentation, Growth, Revenue, Companies, Outlook & Industry
Market Forecast By Type (Swing Check Valves, Lift Check Valve, Other), By Application (Chemical, Power, Mining, Oil & Gas, Water & Wastewater, Other Applications) And Competitive Landscape
| Product Code: ETC5172525 | Publication Date: Nov 2023 | Updated Date: Apr 2026 | Product Type: Market Research Report | |
| Publisher: 6Wresearch | Author: Shubham Padhi | No. of Pages: 60 | No. of Figures: 30 | No. of Tables: 5 |
Croatia Check Valve Market Size (2020-2030)
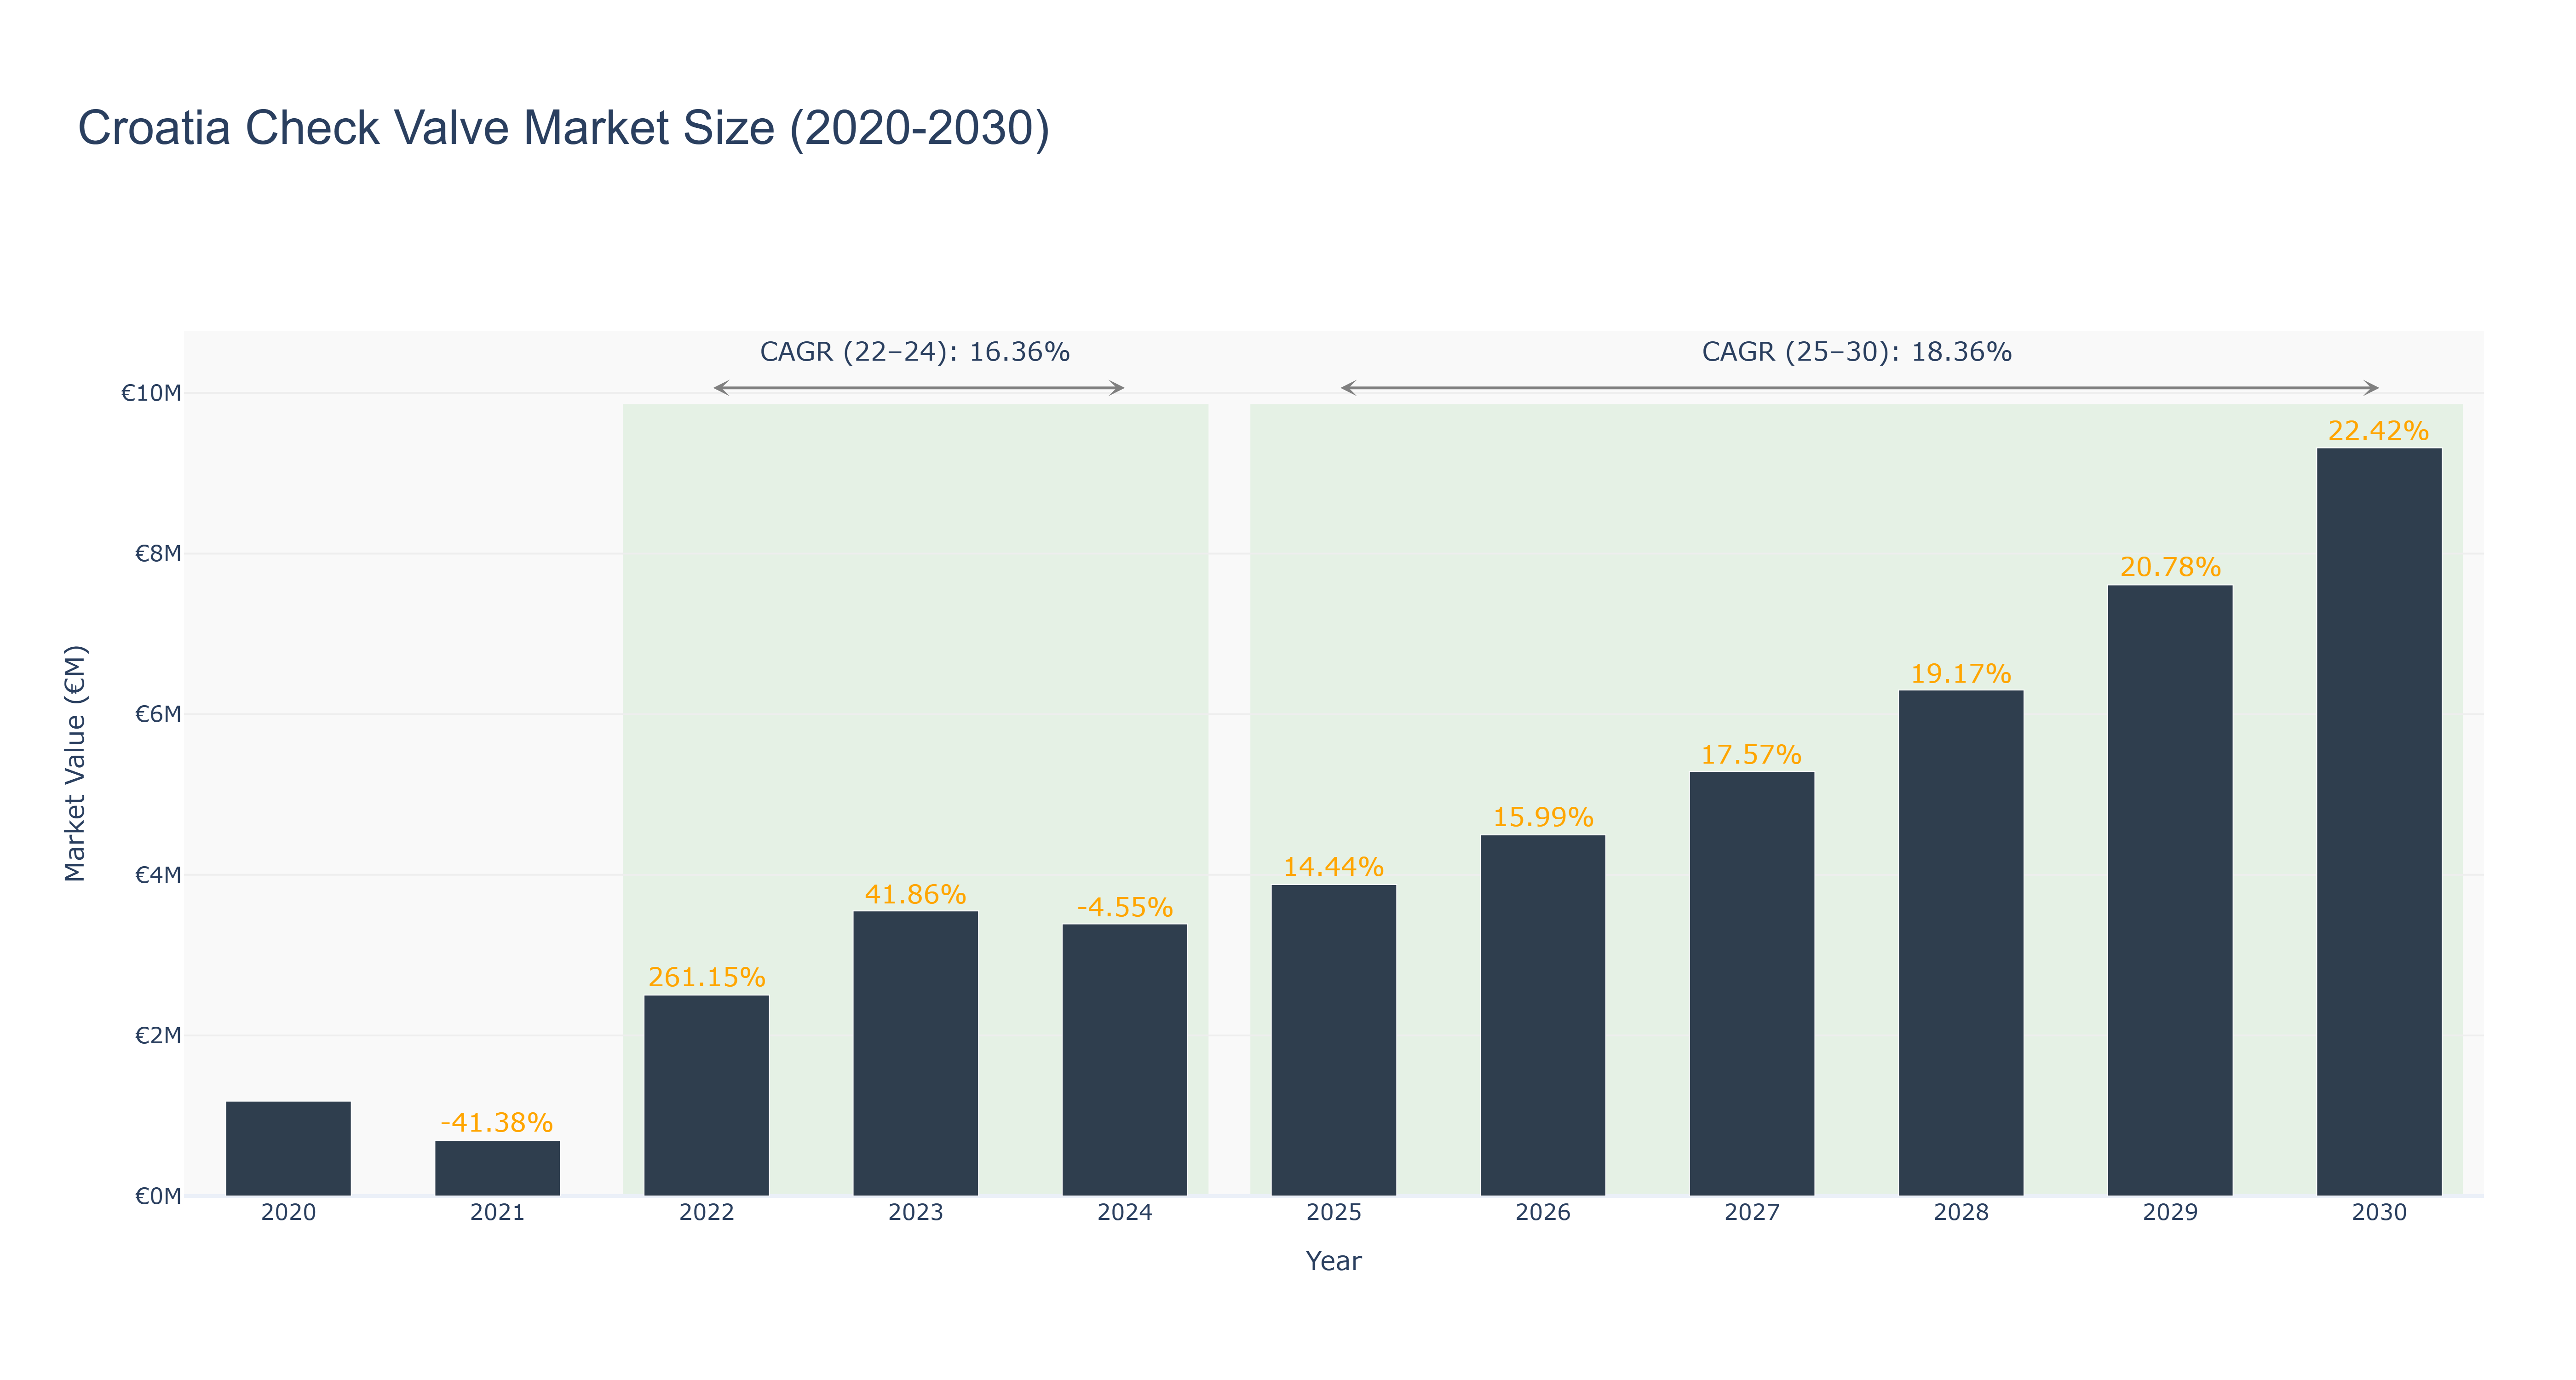
Croatia's Check Valve Market has shown a fluctuating trend over the past decade. The market peaked in 2030 at €9.32 million, with a steady growth rate. From 2020 to 2024, the market size ranged from €1.18 million to €3.39 million, experiencing both declines and growth spurts. The forecasted market size from 2025 to 2030 is promising, with an expected CAGR of 18.36%, indicating a positive trajectory for the industry. The CAGR from 2022 to 2024 was 16.36%, reflecting a period of moderate growth. The market's growth can be attributed to factors such as increasing industrialization, infrastructure development, and technological advancements in the valve industry. Looking ahead, Croatia is set to witness new infrastructure projects that will further drive the demand for check valves in various sectors, ensuring a bright future for the market.
Croatia Check Valve Market: Production & Trade Performance (2019-2025)
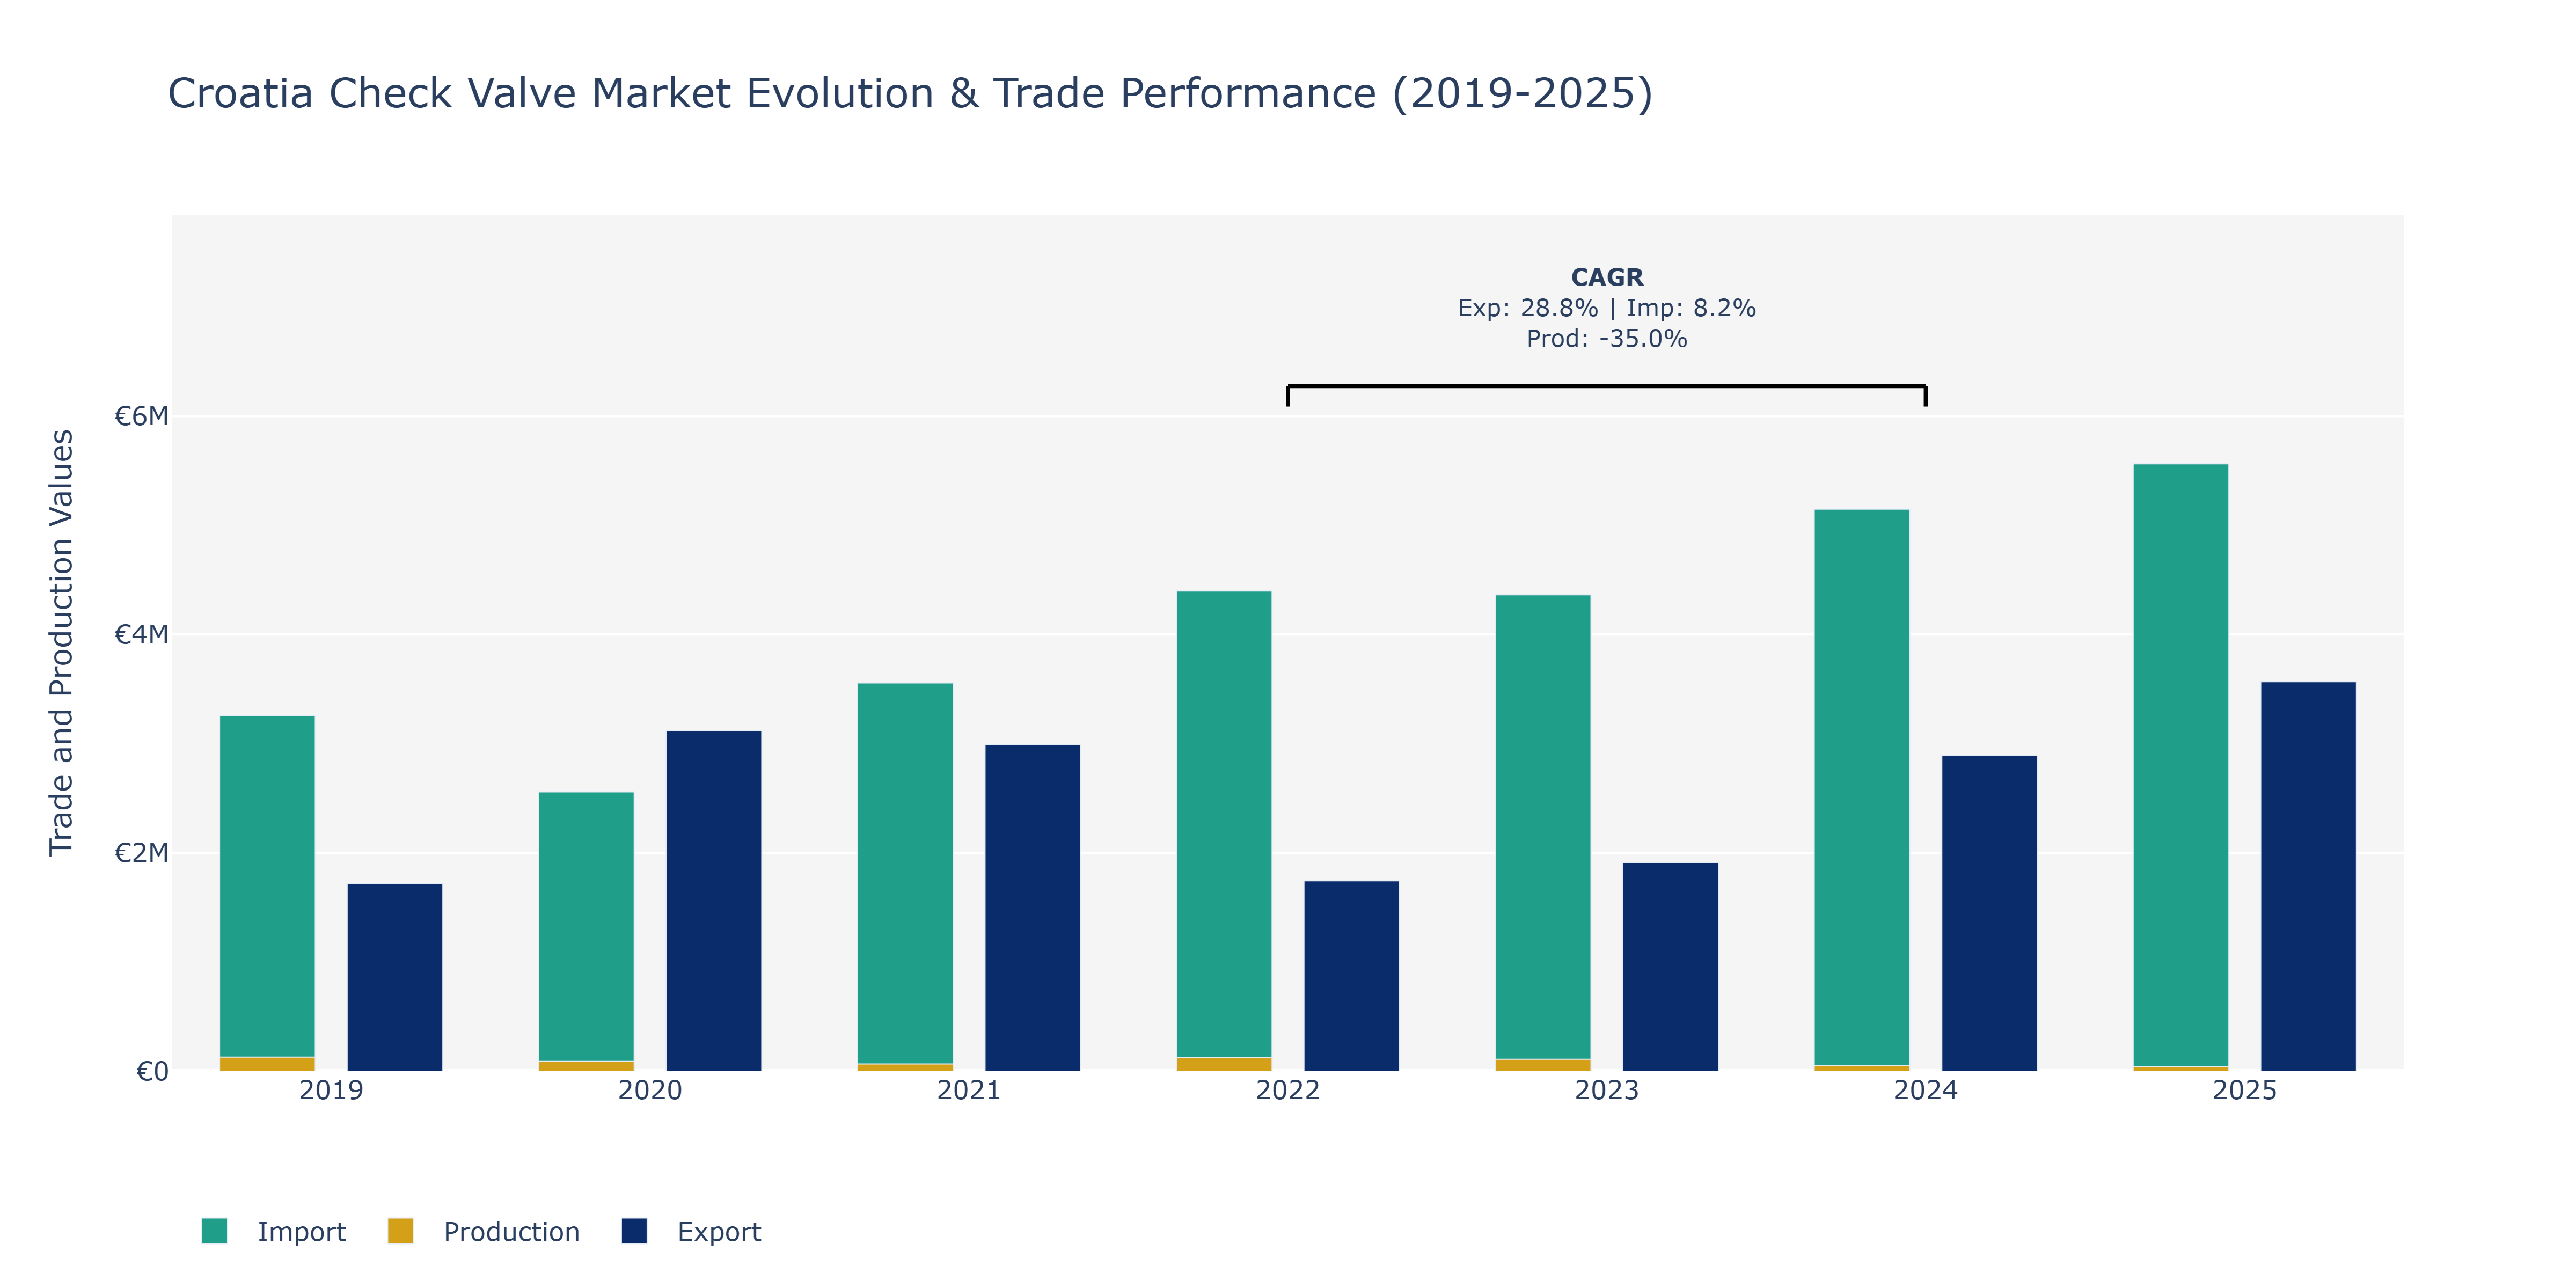
In the Croatia Check Valve Market, exports showcased fluctuating trends over the analyzed years, with a notable peak in 2025 at approximately €3.57 million. Conversely, imports demonstrated a steady increase, reaching around €5.56 million in 2025. Production, on the other hand, experienced a significant decline from €129.22 million in 2019 to around €40.59 million in 2025. The substantial increase in imports can be attributed to Croatia's growing demand for foreign goods and components, possibly indicating a shift towards higher-quality or specialized products. The decline in production may stem from various factors such as increased competition, changes in consumer preferences, or technological advancements leading to outsourcing. To adapt to these market dynamics, local manufacturers could focus on enhancing production efficiency, diversifying product offerings, or establishing strategic partnerships to boost exports and regain market share.
Key Highlights of the Report:
- Croatia Check Valve Market Outlook
- Market Size of Croatia Check Valve Market, 2025
- Forecast of Croatia Check Valve Market, 2032
- Historical Data and Forecast of Croatia Check Valve Revenues & Volume for the Period 2022 - 2032F
- Croatia Check Valve Market Trend Evolution
- Croatia Check Valve Market Drivers and Challenges
- Croatia Check Valve Price Trends
- Croatia Check Valve Porter`s Five Forces
- Croatia Check Valve Industry Life Cycle
- Historical Data and Forecast of Croatia Check Valve Market Revenues & Volume By Type for the Period 2022 - 2032F
- Historical Data and Forecast of Croatia Check Valve Market Revenues & Volume By Swing Check Valves for the Period 2022 - 2032F
- Historical Data and Forecast of Croatia Check Valve Market Revenues & Volume By Lift Check Valve for the Period 2022 - 2032F
- Historical Data and Forecast of Croatia Check Valve Market Revenues & Volume By Other for the Period 2022 - 2032F
- Historical Data and Forecast of Croatia Check Valve Market Revenues & Volume By Application for the Period 2022 - 2032F
- Historical Data and Forecast of Croatia Check Valve Market Revenues & Volume By Chemical for the Period 2022 - 2032F
- Historical Data and Forecast of Croatia Check Valve Market Revenues & Volume By Power for the Period 2022 - 2032F
- Historical Data and Forecast of Croatia Check Valve Market Revenues & Volume By Mining for the Period 2022 - 2032F
- Historical Data and Forecast of Croatia Check Valve Market Revenues & Volume By Oil & Gas for the Period 2022 - 2032F
- Historical Data and Forecast of Croatia Check Valve Market Revenues & Volume By Water & Wastewater for the Period 2022 - 2032F
- Historical Data and Forecast of Croatia Check Valve Market Revenues & Volume By Other Applications for the Period 2022 - 2032F
- Croatia Check Valve Import Export Trade Statistics
- Market Opportunity Assessment By Type
- Market Opportunity Assessment By Application
- Croatia Check Valve Top Companies Market Share
- Croatia Check Valve Competitive Benchmarking By Technical and Operational Parameters
- Croatia Check Valve Company Profiles
- Croatia Check Valve Key Strategic Recommendations
Frequently Asked Questions About the Market Study (FAQs):
6Wresearch actively monitors the Croatia Check Valve Market and publishes its comprehensive annual report, highlighting emerging trends, growth drivers, revenue analysis, and forecast outlook. Our insights help businesses to make data-backed strategic decisions with ongoing market dynamics. Our analysts track relevent industries related to the Croatia Check Valve Market, allowing our clients with actionable intelligence and reliable forecasts tailored to emerging regional needs.
Yes, we provide customisation as per your requirements. To learn more, feel free to contact us on sales@6wresearch.com
1 Executive Summary |
2 Introduction |
2.1 Key Highlights of the Report |
2.2 Report Description |
2.3 Market Scope & Segmentation |
2.4 Research Methodology |
2.5 Assumptions |
3 Croatia Check Valve Market Overview |
3.1 Croatia Country Macro Economic Indicators |
3.2 Croatia Check Valve Market Revenues & Volume, 2022 & 2032F |
3.3 Croatia Check Valve Market - Industry Life Cycle |
3.4 Croatia Check Valve Market - Porter's Five Forces |
3.5 Croatia Check Valve Market Revenues & Volume Share, By Type, 2022 & 2032F |
3.6 Croatia Check Valve Market Revenues & Volume Share, By Application, 2022 & 2032F |
4 Croatia Check Valve Market Dynamics |
4.1 Impact Analysis |
4.2 Market Drivers |
4.2.1 Increasing industrial activities and infrastructure development in Croatia leading to higher demand for check valves. |
4.2.2 Implementation of strict regulations and standards for safety in various industries, boosting the adoption of check valves. |
4.2.3 Rising focus on water and wastewater management projects, driving the demand for check valves in the market. |
4.3 Market Restraints |
4.3.1 Fluctuating raw material prices impacting the manufacturing cost of check valves. |
4.3.2 Intense competition among check valve manufacturers leading to pricing pressures. |
4.3.3 Economic instability and uncertainty affecting investment decisions in industries, thereby impacting the check valve market. |
5 Croatia Check Valve Market Trends |
6 Croatia Check Valve Market Segmentations |
6.1 Croatia Check Valve Market, By Type |
6.1.1 Overview and Analysis |
6.1.2 Croatia Check Valve Market Revenues & Volume, By Swing Check Valves, 2022 - 2032F |
6.1.3 Croatia Check Valve Market Revenues & Volume, By Lift Check Valve, 2022 - 2032F |
6.1.4 Croatia Check Valve Market Revenues & Volume, By Other, 2022 - 2032F |
6.2 Croatia Check Valve Market, By Application |
6.2.1 Overview and Analysis |
6.2.2 Croatia Check Valve Market Revenues & Volume, By Chemical, 2022 - 2032F |
6.2.3 Croatia Check Valve Market Revenues & Volume, By Power, 2022 - 2032F |
6.2.4 Croatia Check Valve Market Revenues & Volume, By Mining, 2022 - 2032F |
6.2.5 Croatia Check Valve Market Revenues & Volume, By Oil & Gas, 2022 - 2032F |
6.2.6 Croatia Check Valve Market Revenues & Volume, By Water & Wastewater, 2022 - 2032F |
6.2.7 Croatia Check Valve Market Revenues & Volume, By Other Applications, 2022 - 2032F |
7 Croatia Check Valve Market Import-Export Trade Statistics |
7.1 Croatia Check Valve Market Export to Major Countries |
7.2 Croatia Check Valve Market Imports from Major Countries |
8 Croatia Check Valve Market Key Performance Indicators |
8.1 Number of infrastructure projects in Croatia utilizing check valves. |
8.2 Compliance rate of industries with safety regulations related to check valve usage. |
8.3 Percentage of adoption of advanced check valve technologies in key industries. |
8.4 Rate of innovation in check valve designs and materials used. |
8.5 Level of customer satisfaction and retention among check valve buyers. |
9 Croatia Check Valve Market - Opportunity Assessment |
9.1 Croatia Check Valve Market Opportunity Assessment, By Type, 2022 & 2032F |
9.2 Croatia Check Valve Market Opportunity Assessment, By Application, 2022 & 2032F |
10 Croatia Check Valve Market - Competitive Landscape |
10.1 Croatia Check Valve Market Revenue Share, By Companies, 2025 |
10.2 Croatia Check Valve Market Competitive Benchmarking, By Operating and Technical Parameters |
11 Company Profiles |
12 Recommendations | 13 Disclaimer |
Global Go To Market Strategy - 2030
Export potential enables firms to identify high-growth global markets with greater confidence by combining advanced trade intelligence with a structured quantitative methodology. The framework analyzes emerging demand trends and country-level import patterns while integrating macroeconomic and trade datasets such as GDP and population forecasts, bilateral import–export flows, tariff structures, elasticity differentials between developed and developing economies, geographic distance, and import demand projections. Using weighted trade values from 2020–2024 as the base period to project country-to-country export potential for 2030, these inputs are operationalized through calculated drivers such as gravity model parameters, tariff impact factors, and projected GDP per-capita growth. Through an analysis of hidden potentials, demand hotspots, and market conditions that are most favorable to success, this method enables firms to focus on target countries, maximize returns, and global expansion with data, backed by accuracy.
By factoring in the projected importer demand gap that is currently unmet and could be potential opportunity, it identifies the potential for the Exporter (Country) among 190 countries, against the general trade analysis, which identifies the biggest importer or exporter.
To discover high-growth global markets and optimize your business strategy:
Click Here
Pricing
- Single User License$ 1,995
- Department License$ 2,400
- Site License$ 3,120
- Global License$ 3,795

Leadership Perspectives from Industry Events
Search
Thought Leadership and Analyst Meet


Our Clients
6WResearch In News
- India Export Attractiveness Tracker 2026
- India Air Conditioner Market Set for Strong Rebound in 2026 After Weather-Led Correction and GST-Driven Recovery: 6Wresearch
- ADAS in India: How Automatic Emergency Braking, Blind Spot Detection & Driver Monitoring are Transforming Road Safety
- Doha a strategic location for EV manufacturing hub: IPA Qatar
- Demand for luxury TVs surging in the GCC, says Samsung
- Empowering Growth: The Thriving Journey of Bangladesh’s Cable Industry
Latest Reports
- Rwanda Transmission Electron Microscope Market (2026-2032)
- Republic of Moldova Transmission Electron Microscope Market (2026-2032)
- Republic of Macedonia Transmission Electron Microscope Market (2026-2032)
- Portugal Transmission Electron Microscope Market (2026-2032)
- Paraguay Transmission Electron Microscope Market (2026-2032)
- Papua New Guinea Transmission Electron Microscope Market (2026-2032)
- Panama Transmission Electron Microscope Market (2026-2032)
- Palau Transmission Electron Microscope Market (2026-2032)
- Norway Transmission Electron Microscope Market (2026-2032)
- North Korea Transmission Electron Microscope Market (2026-2032)
Industry Events and Analyst Meet

EV India Expo 2026

HIMTEX 2026

India Refining Summit 2026

India EV Show 2026

EV tech India Expo 2026
Whitepaper
- Middle East & Africa Commercial Security Market Click here to view more.
- Middle East & Africa Fire Safety Systems & Equipment Market Click here to view more.
- GCC Drone Market Click here to view more.
- Middle East Lighting Fixture Market Click here to view more.
- GCC Physical & Perimeter Security Market Click here to view more.