Croatia Food Cans Market (2026-2032) | Growth, Competitive Landscape, Industry, Outlook, Companies, Analysis, Forecast, Segmentation, Value, Share, Trends, Size & Revenue
Market Forecast By Product (2 Piece Cans, 3 Piece Cans), By Material (Metal, Paperboard, Plastic), By Capacity (Less than 100 gm, 100 gm300 gm, 301 gm500 gm, More than 500 gm), By End-use (Meat and Poultry & Seafood, Pet Food, Bakery & Confectionery, Sauces and Jams & Pickles, Fruits & Vegetables, Tea & Coffee, Others (Baby Food, Ready Meals, Nutrition Food, Dairy, etc.)) And Competitive Landscape
| Product Code: ETC6851605 | Publication Date: Sep 2024 | Updated Date: Apr 2026 | Product Type: Market Research Report | |
| Publisher: 6Wresearch | Author: Summon Dutta | No. of Pages: 75 | No. of Figures: 35 | No. of Tables: 20 |
Croatia Food Cans Market Size (2020-2030)
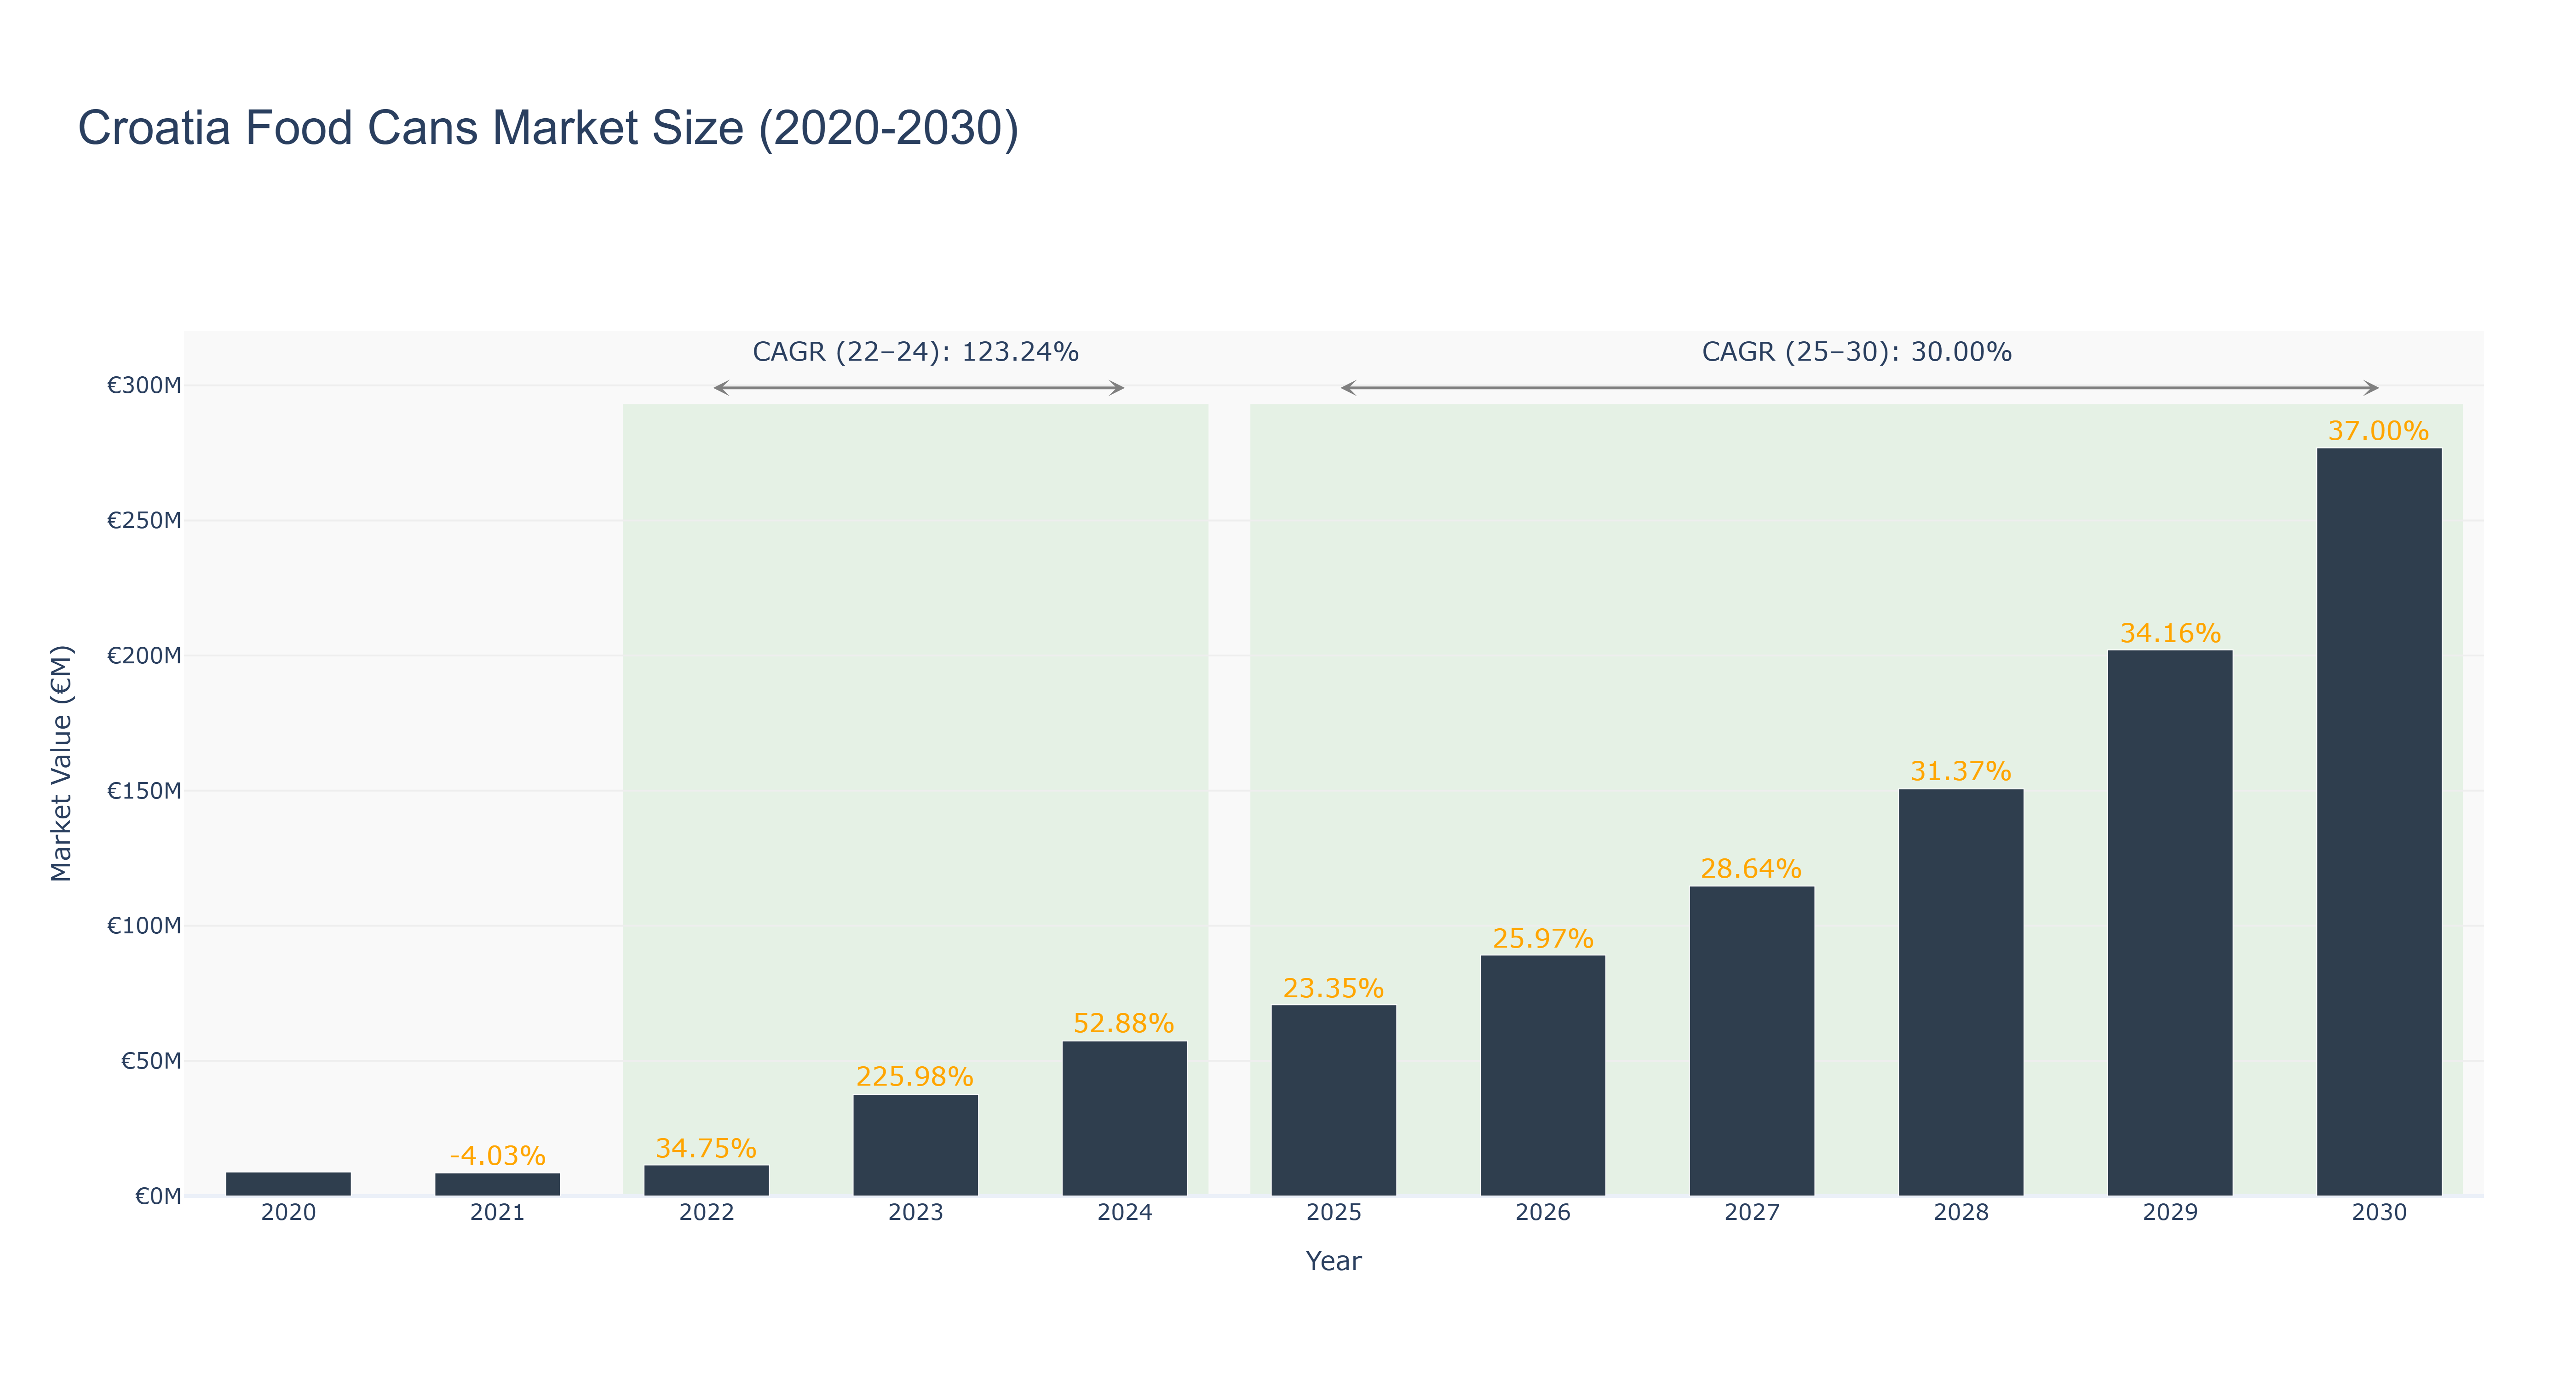
Croatia Food Cans Market has shown a remarkable growth trajectory over the years. The market size peaked at €276.89 million in 2030, with a steady increase from €8.90 million in 2020. The CAGR from 2022 to 2024 was an impressive 123.24%, driven by factors such as increasing demand for canned food products and technological advancements in packaging. The forecasted CAGR from 2025 to 2030 is projected at 30.0%, indicating sustained growth potential. The market's exponential expansion can be attributed to changing consumer preferences towards convenience foods and the market's ability to adapt to evolving packaging trends. Looking ahead, Croatia Food Cans Market is expected to witness further growth with upcoming initiatives focusing on sustainable packaging solutions and innovative product offerings to meet consumer demands.
Croatia Food Cans Market: Production & Trade Performance (2019-2025)
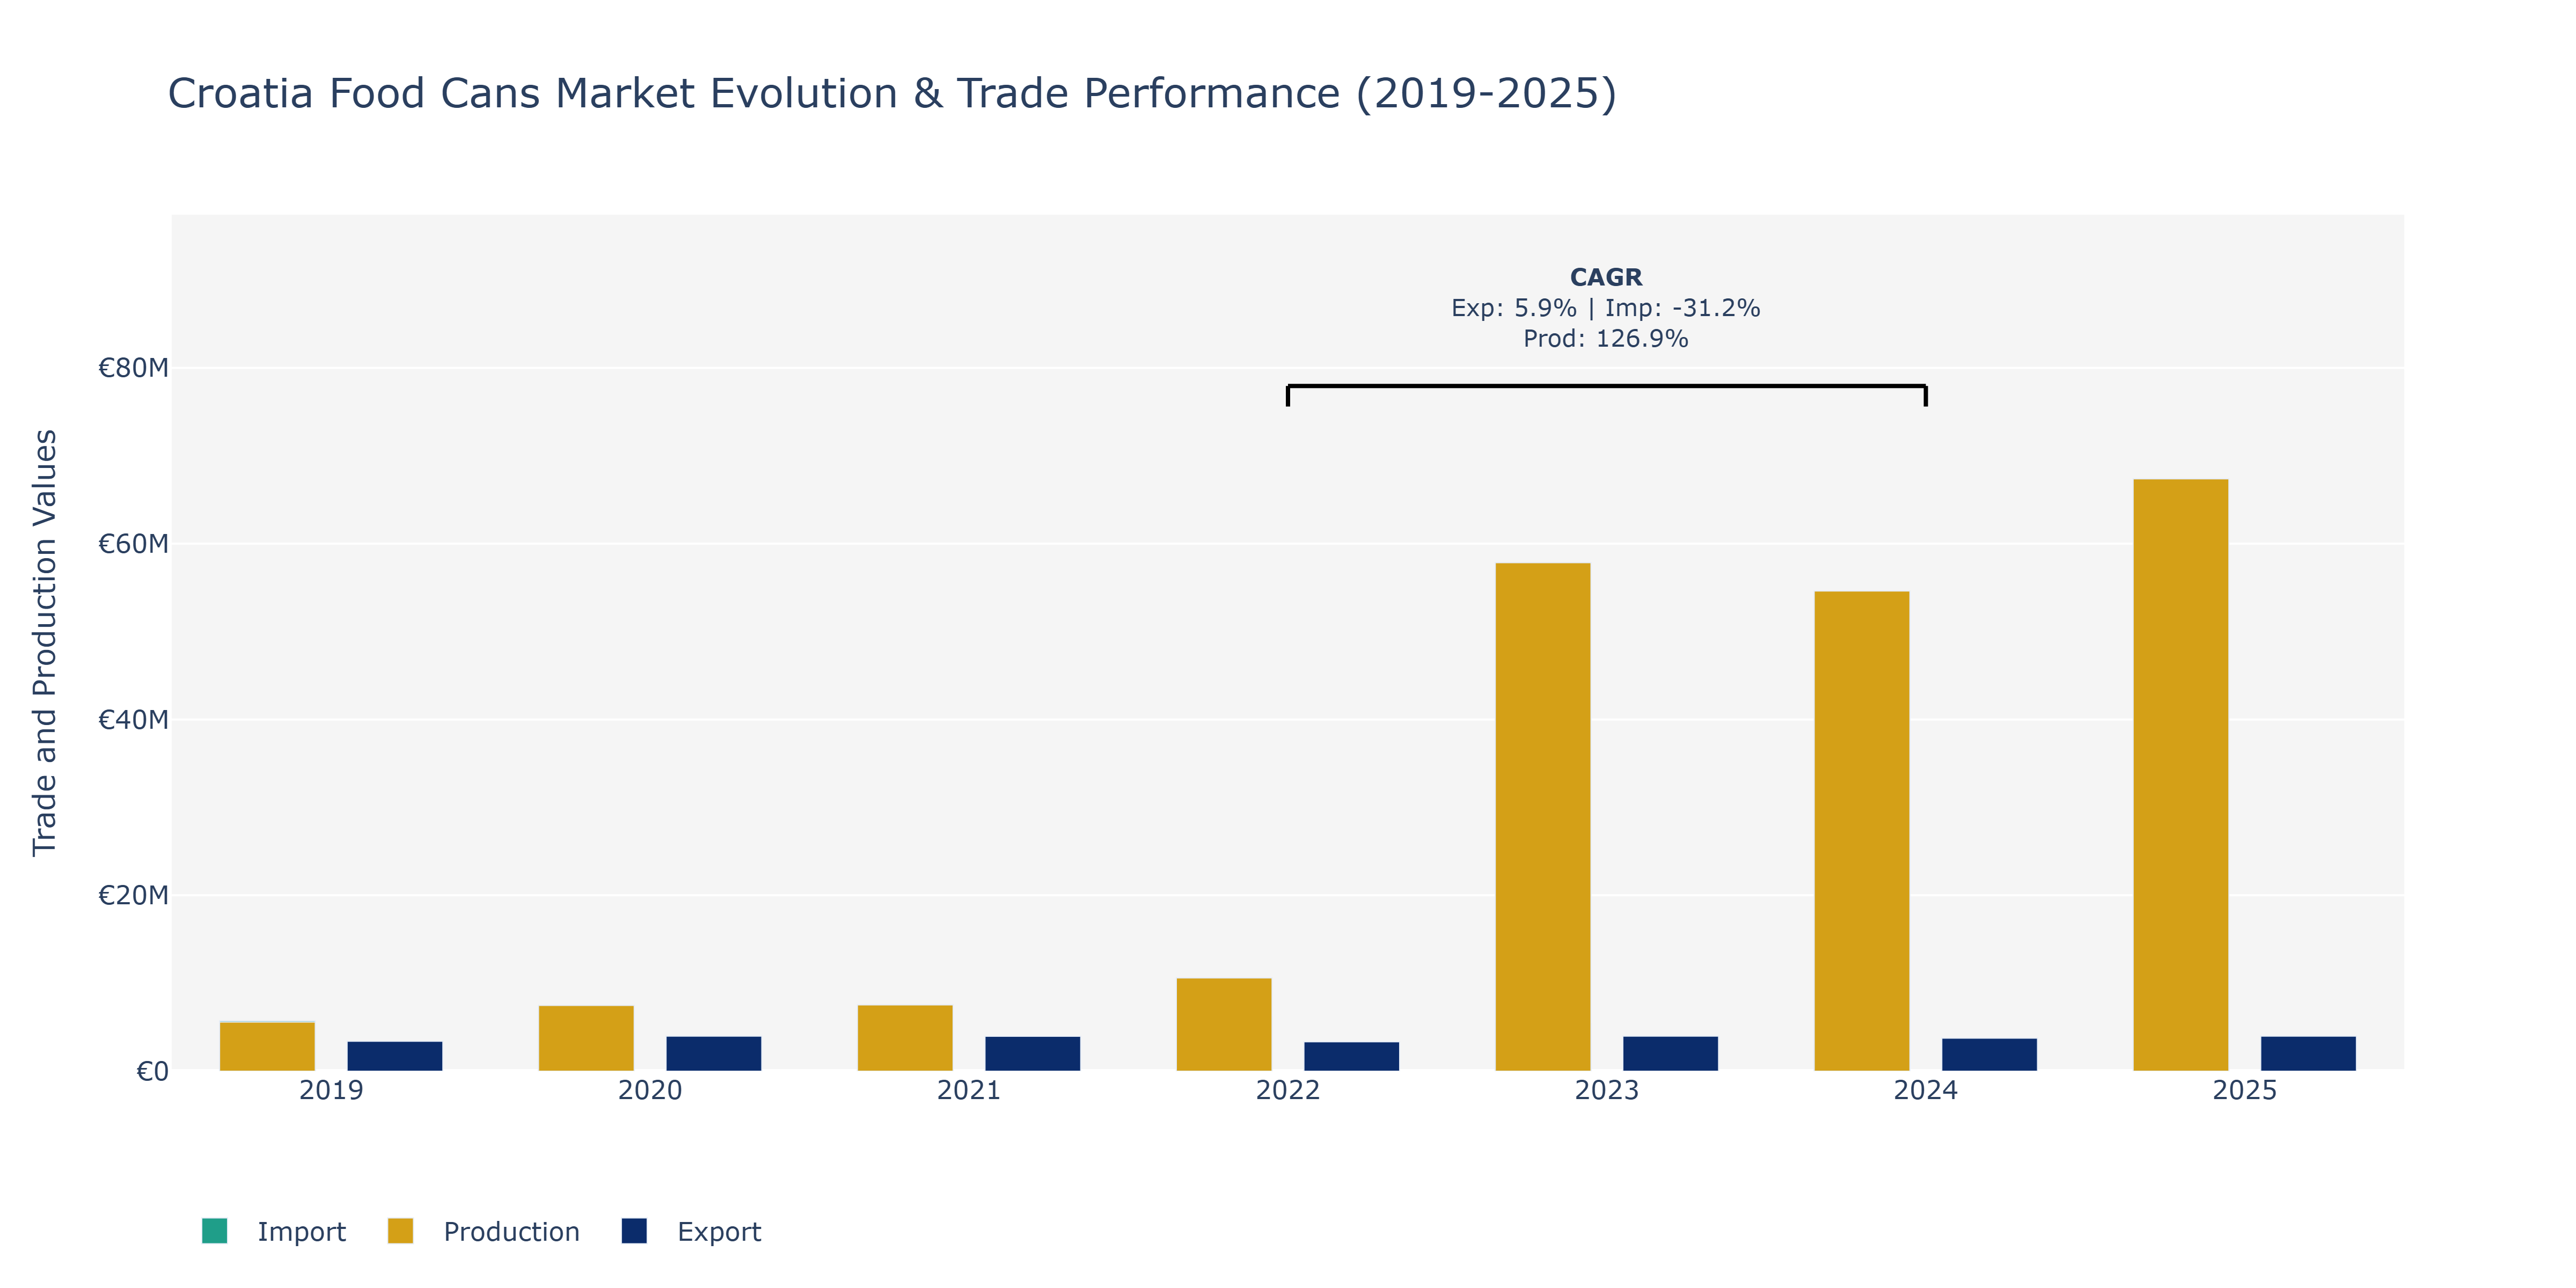
In the Croatia Food Cans Market, from 2019 to 2025, exports experienced fluctuations. In 2020, exports saw a notable increase to approximately €3.99 million before declining in 2022 to around €3.35 million. There was a slight recovery in 2023, reaching about €3.98 million. Imports followed a different trend, spiking in 2022 to almost €6.19 million but dropping significantly to about €2.92 million in 2024. Production showcased a remarkable growth trajectory, soaring from €5.59 million in 2019 to approximately €67.37 million in 2025. The substantial surge in production can be attributed to increased demand for canned food due to its convenience, longer shelf life, and sustainability. The fluctuations in exports and imports could be influenced by global trade dynamics, domestic consumption patterns, and economic conditions impacting market competitiveness and consumer preferences.
Key Highlights of the Report:
- Croatia Food Cans Market Outlook
- Market Size of Croatia Food Cans Market, 2025
- Forecast of Croatia Food Cans Market, 2032
- Historical Data and Forecast of Croatia Food Cans Revenues & Volume for the Period 2022 - 2032
- Croatia Food Cans Market Trend Evolution
- Croatia Food Cans Market Drivers and Challenges
- Croatia Food Cans Price Trends
- Croatia Food Cans Porter's Five Forces
- Croatia Food Cans Industry Life Cycle
- Historical Data and Forecast of Croatia Food Cans Market Revenues & Volume By Product for the Period 2022 - 2032
- Historical Data and Forecast of Croatia Food Cans Market Revenues & Volume By 2 Piece Cans for the Period 2022 - 2032
- Historical Data and Forecast of Croatia Food Cans Market Revenues & Volume By 3 Piece Cans for the Period 2022 - 2032
- Historical Data and Forecast of Croatia Food Cans Market Revenues & Volume By Material for the Period 2022 - 2032
- Historical Data and Forecast of Croatia Food Cans Market Revenues & Volume By Metal for the Period 2022 - 2032
- Historical Data and Forecast of Croatia Food Cans Market Revenues & Volume By Paperboard for the Period 2022 - 2032
- Historical Data and Forecast of Croatia Food Cans Market Revenues & Volume By Plastic for the Period 2022 - 2032
- Historical Data and Forecast of Croatia Food Cans Market Revenues & Volume By Capacity for the Period 2022 - 2032
- Historical Data and Forecast of Croatia Food Cans Market Revenues & Volume By Less than 100 gm for the Period 2022 - 2032
- Historical Data and Forecast of Croatia Food Cans Market Revenues & Volume By 100 gm300 gm for the Period 2022 - 2032
- Historical Data and Forecast of Croatia Food Cans Market Revenues & Volume By 301 gm500 gm for the Period 2022 - 2032
- Historical Data and Forecast of Croatia Food Cans Market Revenues & Volume By More than 500 gm for the Period 2022 - 2032
- Historical Data and Forecast of Croatia Food Cans Market Revenues & Volume By End-use for the Period 2022 - 2032
- Historical Data and Forecast of Croatia Food Cans Market Revenues & Volume By Meat and Poultry & Seafood for the Period 2022 - 2032
- Historical Data and Forecast of Croatia Food Cans Market Revenues & Volume By Pet Food for the Period 2022 - 2032
- Historical Data and Forecast of Croatia Food Cans Market Revenues & Volume By Bakery & Confectionery for the Period 2022 - 2032
- Historical Data and Forecast of Croatia Food Cans Market Revenues & Volume By Sauces and Jams & Pickles for the Period 2022 - 2032
- Historical Data and Forecast of Croatia Food Cans Market Revenues & Volume By Fruits & Vegetables for the Period 2022 - 2032
- Historical Data and Forecast of Croatia Food Cans Market Revenues & Volume By Tea & Coffee for the Period 2022 - 2032
- Historical Data and Forecast of Croatia Food Cans Market Revenues & Volume By Others (Baby Food, Ready Meals, Nutrition Food, Dairy, etc.) for the Period 2022 - 2032
- Croatia Food Cans Import Export Trade Statistics
- Market Opportunity Assessment By Product
- Market Opportunity Assessment By Material
- Market Opportunity Assessment By Capacity
- Market Opportunity Assessment By End-use
- Croatia Food Cans Top Companies Market Share
- Croatia Food Cans Competitive Benchmarking By Technical and Operational Parameters
- Croatia Food Cans Company Profiles
- Croatia Food Cans Key Strategic Recommendations
Frequently Asked Questions About the Market Study (FAQs):
6Wresearch actively monitors the Croatia Food Cans Market and publishes its comprehensive annual report, highlighting emerging trends, growth drivers, revenue analysis, and forecast outlook. Our insights help businesses to make data-backed strategic decisions with ongoing market dynamics. Our analysts track relevent industries related to the Croatia Food Cans Market, allowing our clients with actionable intelligence and reliable forecasts tailored to emerging regional needs.
Yes, we provide customisation as per your requirements. To learn more, feel free to contact us on sales@6wresearch.com
1 Executive Summary |
2 Introduction |
2.1 Key Highlights of the Report |
2.2 Report Description |
2.3 Market Scope & Segmentation |
2.4 Research Methodology |
2.5 Assumptions |
3 Croatia Food Cans Market Overview |
3.1 Croatia Country Macro Economic Indicators |
3.2 Croatia Food Cans Market Revenues & Volume, 2022 & 2032F |
3.3 Croatia Food Cans Market - Industry Life Cycle |
3.4 Croatia Food Cans Market - Porter's Five Forces |
3.5 Croatia Food Cans Market Revenues & Volume Share, By Product, 2022 & 2032F |
3.6 Croatia Food Cans Market Revenues & Volume Share, By Material, 2022 & 2032F |
3.7 Croatia Food Cans Market Revenues & Volume Share, By Capacity, 2022 & 2032F |
3.8 Croatia Food Cans Market Revenues & Volume Share, By End-use, 2022 & 2032F |
4 Croatia Food Cans Market Dynamics |
4.1 Impact Analysis |
4.2 Market Drivers |
4.3 Market Restraints |
5 Croatia Food Cans Market Trends |
6 Croatia Food Cans Market, By Types |
6.1 Croatia Food Cans Market, By Product |
6.1.1 Overview and Analysis |
6.1.2 Croatia Food Cans Market Revenues & Volume, By Product, 2022 - 2032F |
6.1.3 Croatia Food Cans Market Revenues & Volume, By 2 Piece Cans, 2022 - 2032F |
6.1.4 Croatia Food Cans Market Revenues & Volume, By 3 Piece Cans, 2022 - 2032F |
6.2 Croatia Food Cans Market, By Material |
6.2.1 Overview and Analysis |
6.2.2 Croatia Food Cans Market Revenues & Volume, By Metal, 2022 - 2032F |
6.2.3 Croatia Food Cans Market Revenues & Volume, By Paperboard, 2022 - 2032F |
6.2.4 Croatia Food Cans Market Revenues & Volume, By Plastic, 2022 - 2032F |
6.3 Croatia Food Cans Market, By Capacity |
6.3.1 Overview and Analysis |
6.3.2 Croatia Food Cans Market Revenues & Volume, By Less than 100 gm, 2022 - 2032F |
6.3.3 Croatia Food Cans Market Revenues & Volume, By 100 gm300 gm, 2022 - 2032F |
6.3.4 Croatia Food Cans Market Revenues & Volume, By 301 gm500 gm, 2022 - 2032F |
6.3.5 Croatia Food Cans Market Revenues & Volume, By More than 500 gm, 2022 - 2032F |
6.4 Croatia Food Cans Market, By End-use |
6.4.1 Overview and Analysis |
6.4.2 Croatia Food Cans Market Revenues & Volume, By Meat and Poultry & Seafood, 2022 - 2032F |
6.4.3 Croatia Food Cans Market Revenues & Volume, By Pet Food, 2022 - 2032F |
6.4.4 Croatia Food Cans Market Revenues & Volume, By Bakery & Confectionery, 2022 - 2032F |
6.4.5 Croatia Food Cans Market Revenues & Volume, By Sauces and Jams & Pickles, 2022 - 2032F |
6.4.6 Croatia Food Cans Market Revenues & Volume, By Fruits & Vegetables, 2022 - 2032F |
6.4.7 Croatia Food Cans Market Revenues & Volume, By Tea & Coffee, 2022 - 2032F |
7 Croatia Food Cans Market Import-Export Trade Statistics |
7.1 Croatia Food Cans Market Export to Major Countries |
7.2 Croatia Food Cans Market Imports from Major Countries |
8 Croatia Food Cans Market Key Performance Indicators |
9 Croatia Food Cans Market - Opportunity Assessment |
9.1 Croatia Food Cans Market Opportunity Assessment, By Product, 2022 & 2032F |
9.2 Croatia Food Cans Market Opportunity Assessment, By Material, 2022 & 2032F |
9.3 Croatia Food Cans Market Opportunity Assessment, By Capacity, 2022 & 2032F |
9.4 Croatia Food Cans Market Opportunity Assessment, By End-use, 2022 & 2032F |
10 Croatia Food Cans Market - Competitive Landscape |
10.1 Croatia Food Cans Market Revenue Share, By Companies, 2025 |
10.2 Croatia Food Cans Market Competitive Benchmarking, By Operating and Technical Parameters |
11 Company Profiles |
12 Recommendations |
13 Disclaimer |
Global Go To Market Strategy - 2030
Export potential enables firms to identify high-growth global markets with greater confidence by combining advanced trade intelligence with a structured quantitative methodology. The framework analyzes emerging demand trends and country-level import patterns while integrating macroeconomic and trade datasets such as GDP and population forecasts, bilateral import–export flows, tariff structures, elasticity differentials between developed and developing economies, geographic distance, and import demand projections. Using weighted trade values from 2020–2024 as the base period to project country-to-country export potential for 2030, these inputs are operationalized through calculated drivers such as gravity model parameters, tariff impact factors, and projected GDP per-capita growth. Through an analysis of hidden potentials, demand hotspots, and market conditions that are most favorable to success, this method enables firms to focus on target countries, maximize returns, and global expansion with data, backed by accuracy.
By factoring in the projected importer demand gap that is currently unmet and could be potential opportunity, it identifies the potential for the Exporter (Country) among 190 countries, against the general trade analysis, which identifies the biggest importer or exporter.
To discover high-growth global markets and optimize your business strategy:
Click Here
Pricing
- Single User License$ 1,995
- Department License$ 2,400
- Site License$ 3,120
- Global License$ 3,795

Leadership Perspectives from Industry Events
Search
Thought Leadership and Analyst Meet


Our Clients
6WResearch In News
- Doha a strategic location for EV manufacturing hub: IPA Qatar
- Demand for luxury TVs surging in the GCC, says Samsung
- Empowering Growth: The Thriving Journey of Bangladesh’s Cable Industry
- Demand for luxury TVs surging in the GCC, says Samsung
- Video call with a traditional healer? Once unthinkable, it’s now common in South Africa
- Intelligent Buildings To Smooth GCC’s Path To Net Zero
Latest Reports
- New Zealand Aseptic Manufacturing Market (2026-2032)
- Netherlands Aseptic Manufacturing Market (2026-2032)
- Nauru Aseptic Manufacturing Market (2026-2032)
- Namibia Aseptic Manufacturing Market (2026-2032)
- Mozambique Aseptic Manufacturing Market (2026-2032)
- Montenegro Aseptic Manufacturing Market (2026-2032)
- Mongolia Aseptic Manufacturing Market (2026-2032)
- Monaco Aseptic Manufacturing Market (2026-2032)
- Micronesia Aseptic Manufacturing Market (2026-2032)
- Mauritius Aseptic Manufacturing Market (2026-2032)
Industry Events and Analyst Meet

HIMTEX 2026

India Refining Summit 2026

India EV Show 2026

EV tech India Expo 2026

Auto Tech Asia 2026
Whitepaper
- Middle East & Africa Commercial Security Market Click here to view more.
- Middle East & Africa Fire Safety Systems & Equipment Market Click here to view more.
- GCC Drone Market Click here to view more.
- Middle East Lighting Fixture Market Click here to view more.
- GCC Physical & Perimeter Security Market Click here to view more.