Croatia Herbicides Market (2026-2032) | Industry, Value, Trends, Segmentation, Growth, Outlook, Revenue, Size, Companies, Share, Analysis & Forecast
Market Forecast By Type (Glyphosate, 2, 4-D, Diquat, Others), By Mode of Action (Non-Selective, Selective), By Crop Type (Cereals & Grains, Oilseeds & Pulses, Fruits & Vegetables, Others) And Competitive Landscape
| Product Code: ETC5680433 | Publication Date: Nov 2023 | Updated Date: Apr 2026 | Product Type: Market Research Report | |
| Publisher: 6Wresearch | Author: Ravi Bhandari | No. of Pages: 60 | No. of Figures: 30 | No. of Tables: 5 |
Croatia Herbicides Market Size (2020-2030)
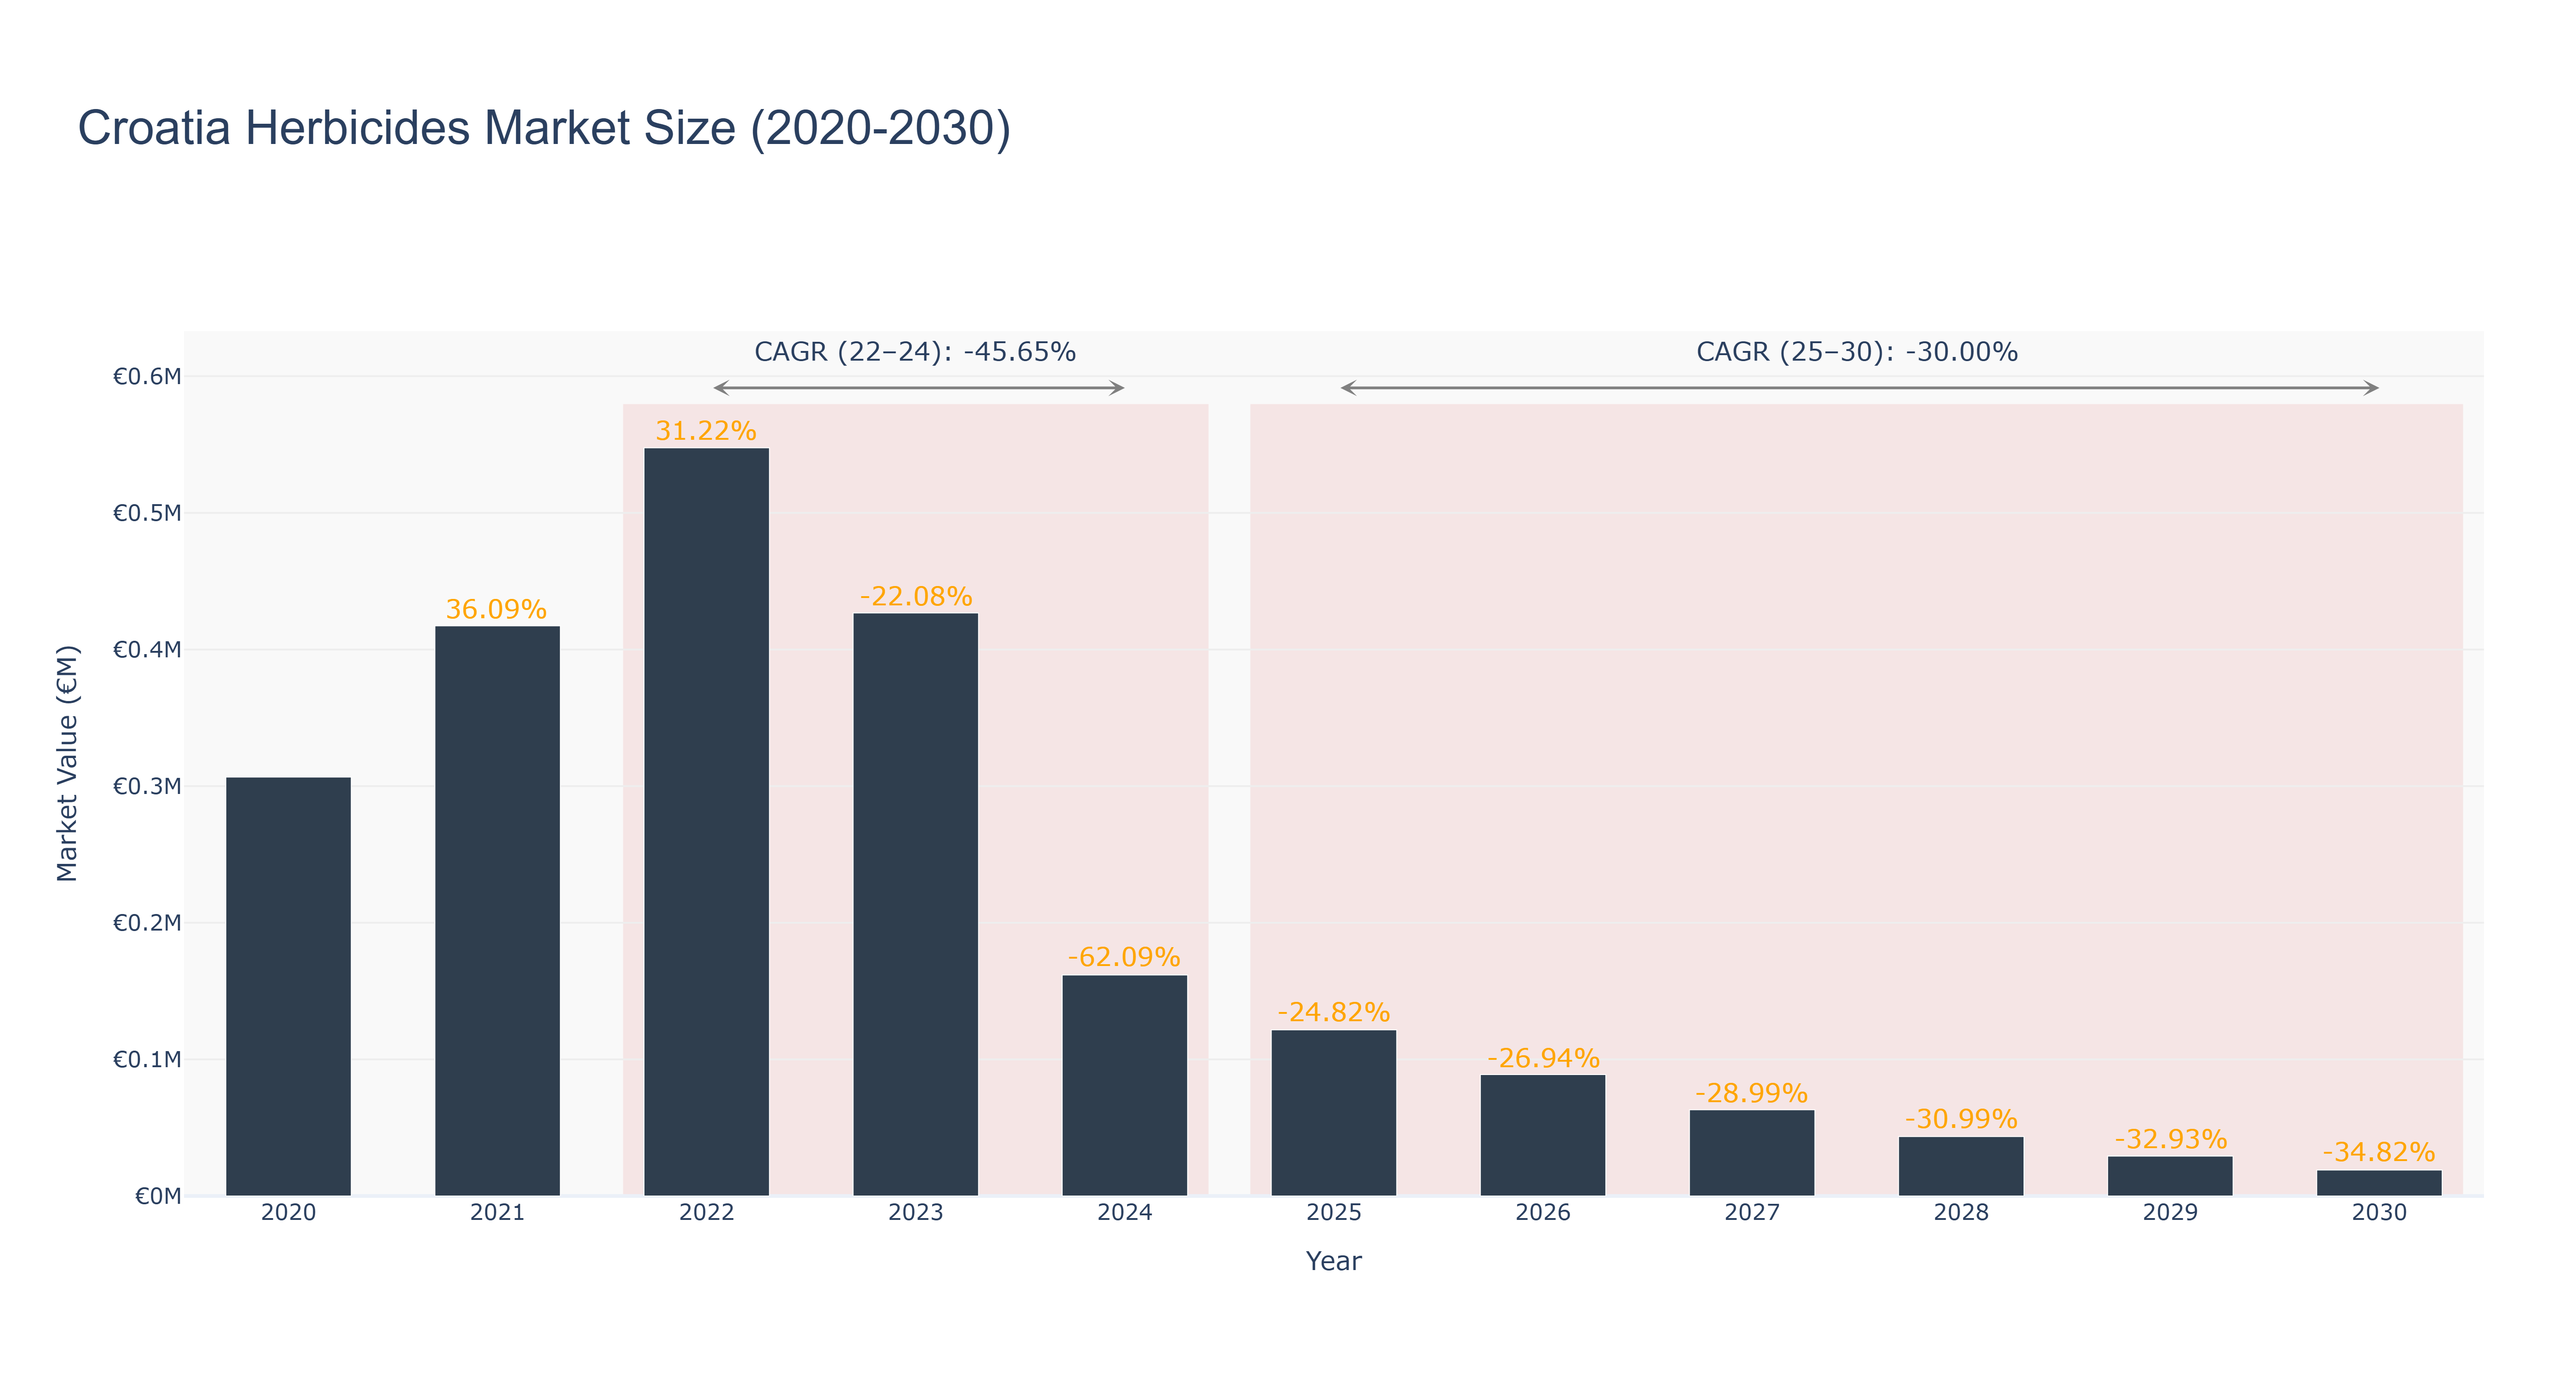
The Croatia Herbicides Market experienced a peak market size of €0.55 million in 2022, followed by a steady decline in subsequent years. The actual market size decreased from €0.55 million in 2022 to €0.16 million in 2024, with a negative compound annual growth rate (CAGR) of -45.65% during 2022-2024. The forecasted market size is expected to continue decreasing from €0.12 million in 2025 to €0.02 million in 2030, with a CAGR of -30.0% during 2025-2030. The downward trend can be attributed to factors such as changing agricultural practices, regulatory challenges, and increased competition. Looking ahead, Croatia is set to implement new sustainability initiatives in the agriculture sector, focusing on organic herbicides and environmentally-friendly farming practices to revitalize the herbicides market in the coming years. Industry drivers include evolving consumer preferences towards organic products, stringent regulations on chemical herbicides, and the growing awareness of environmental sustainability in agriculture. In conclusion, the Croatia Herbicides Market is facing challenges but has opportunities for growth through sustainable practices and innovation in the near future.
Croatia Herbicides Market: Production & Trade Performance (2019-2025)
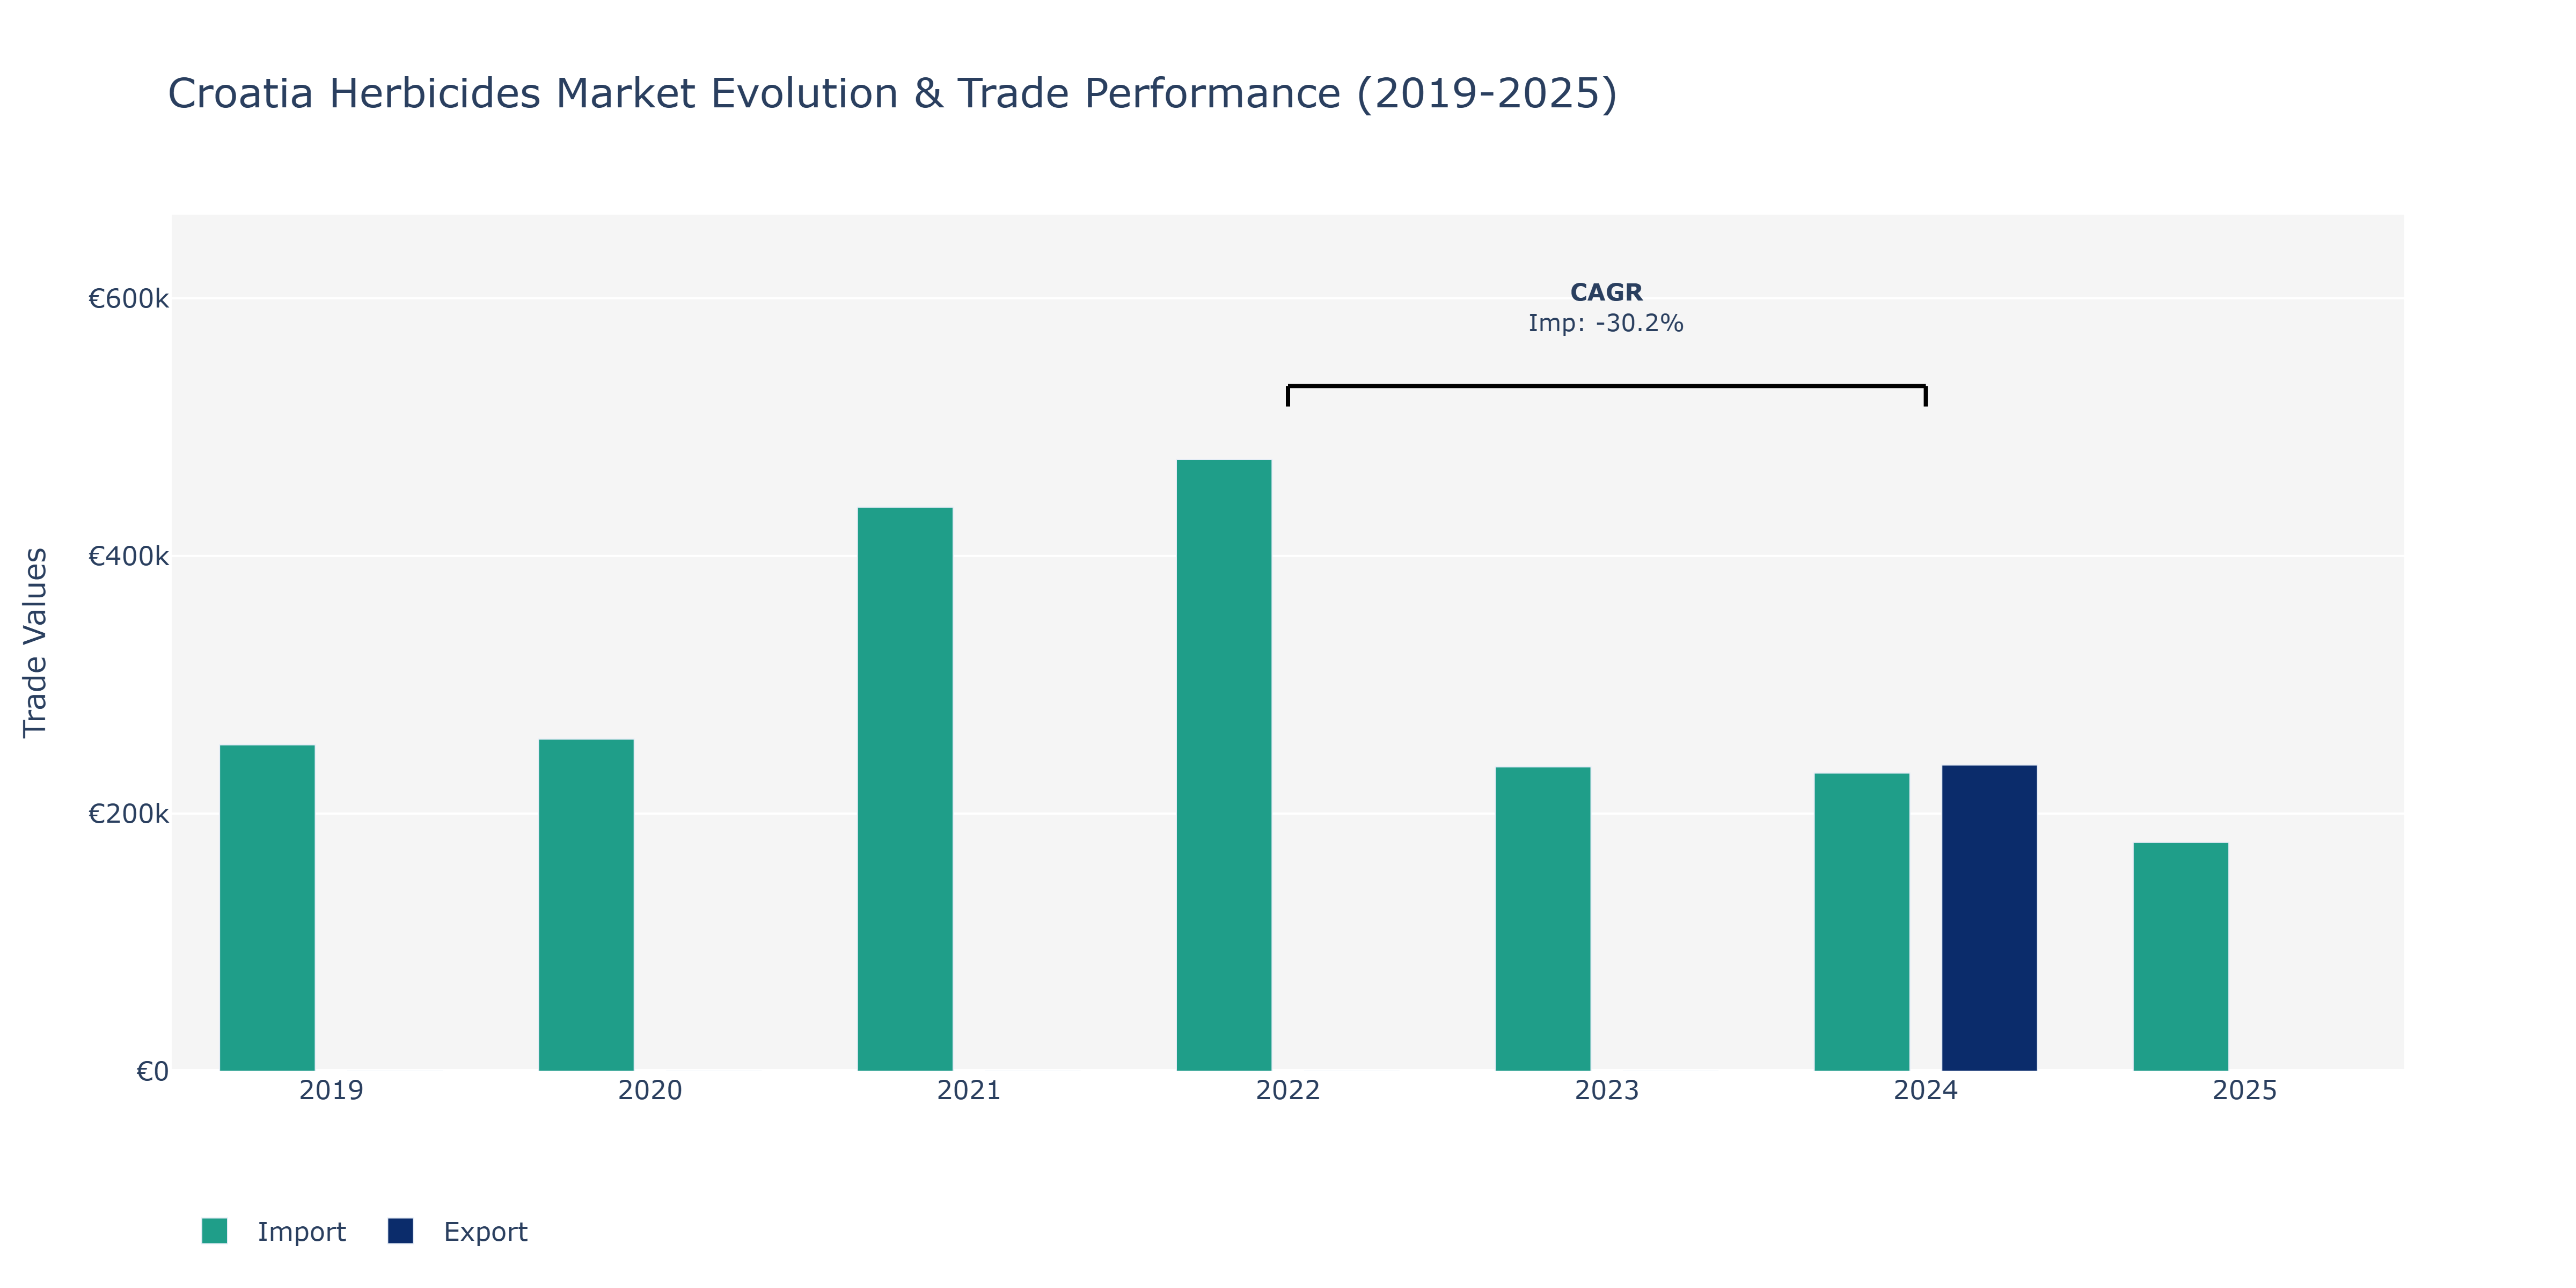
Between 2019 and 2025, Croatia's Herbicides Market witnessed varying trends in imports and exports. Import value fluctuated notably, starting at €253.31 thousand in 2019 and reaching a peak of €474.91 thousand in 2022, followed by a significant decline to €236.25 thousand in 2023, and a further drop to €177.56 thousand in 2025. Conversely, exports stood at €237.69 thousand in 2024. The surge in imports until 2022 could be attributed to increased demand for herbicides, potentially driven by agricultural activities and pest management needs. The subsequent drops in imports may reflect market stabilization, inventory adjustments, or shifts in agricultural practices. The dip in exports in 2024 might indicate a focus on meeting domestic demand or changes in international trade dynamics for herbicides. These fluctuations underline the market's sensitivity to factors like agricultural policies, environmental regulations, and industry competition, shaping Croatia's herbicides landscape.
Key Highlights of the Report:
- Croatia Herbicides Market Outlook
- Market Size of Croatia Herbicides Market, 2025
- Forecast of Croatia Herbicides Market, 2032
- Historical Data and Forecast of Croatia Herbicides Revenues & Volume for the Period 2022 - 2032F
- Croatia Herbicides Market Trend Evolution
- Croatia Herbicides Market Drivers and Challenges
- Croatia Herbicides Price Trends
- Croatia Herbicides Porter`s Five Forces
- Croatia Herbicides Industry Life Cycle
- Historical Data and Forecast of Croatia Herbicides Market Revenues & Volume By Type for the Period 2022 - 2032F
- Historical Data and Forecast of Croatia Herbicides Market Revenues & Volume By Glyphosate for the Period 2022 - 2032F
- Historical Data and Forecast of Croatia Herbicides Market Revenues & Volume By 2, 4-D for the Period 2022 - 2032F
- Historical Data and Forecast of Croatia Herbicides Market Revenues & Volume By Diquat for the Period 2022 - 2032F
- Historical Data and Forecast of Croatia Herbicides Market Revenues & Volume By Others for the Period 2022 - 2032F
- Historical Data and Forecast of Croatia Herbicides Market Revenues & Volume By Mode of Action for the Period 2022 - 2032F
- Historical Data and Forecast of Croatia Herbicides Market Revenues & Volume By Non-Selective for the Period 2022 - 2032F
- Historical Data and Forecast of Croatia Herbicides Market Revenues & Volume By Selective for the Period 2022 - 2032F
- Historical Data and Forecast of Croatia Herbicides Market Revenues & Volume By Crop Type for the Period 2022 - 2032F
- Historical Data and Forecast of Croatia Herbicides Market Revenues & Volume By Cereals & Grains for the Period 2022 - 2032F
- Historical Data and Forecast of Croatia Herbicides Market Revenues & Volume By Oilseeds & Pulses for the Period 2022 - 2032F
- Historical Data and Forecast of Croatia Herbicides Market Revenues & Volume By Fruits & Vegetables for the Period 2022 - 2032F
- Historical Data and Forecast of Croatia Herbicides Market Revenues & Volume By Others for the Period 2022 - 2032F
- Croatia Herbicides Import Export Trade Statistics
- Market Opportunity Assessment By Type
- Market Opportunity Assessment By Mode of Action
- Market Opportunity Assessment By Crop Type
- Croatia Herbicides Top Companies Market Share
- Croatia Herbicides Competitive Benchmarking By Technical and Operational Parameters
- Croatia Herbicides Company Profiles
- Croatia Herbicides Key Strategic Recommendations
Frequently Asked Questions About the Market Study (FAQs):
6Wresearch actively monitors the Croatia Herbicides Market and publishes its comprehensive annual report, highlighting emerging trends, growth drivers, revenue analysis, and forecast outlook. Our insights help businesses to make data-backed strategic decisions with ongoing market dynamics. Our analysts track relevent industries related to the Croatia Herbicides Market, allowing our clients with actionable intelligence and reliable forecasts tailored to emerging regional needs.
Yes, we provide customisation as per your requirements. To learn more, feel free to contact us on sales@6wresearch.com
1 Executive Summary |
2 Introduction |
2.1 Key Highlights of the Report |
2.2 Report Description |
2.3 Market Scope & Segmentation |
2.4 Research Methodology |
2.5 Assumptions |
3 Croatia Herbicides? Market Overview |
3.1 Croatia Country Macro Economic Indicators |
3.2 Croatia Herbicides? Market Revenues & Volume, 2022 & 2032F |
3.3 Croatia Herbicides? Market - Industry Life Cycle |
3.4 Croatia Herbicides? Market - Porter's Five Forces |
3.5 Croatia Herbicides? Market Revenues & Volume Share, By Type, 2022 & 2032F |
3.6 Croatia Herbicides? Market Revenues & Volume Share, By Mode of Action, 2022 & 2032F |
3.7 Croatia Herbicides? Market Revenues & Volume Share, By Crop Type, 2022 & 2032F |
4 Croatia Herbicides? Market Dynamics |
4.1 Impact Analysis |
4.2 Market Drivers |
4.2.1 Increasing demand for herbicides due to growing agriculture sector in Croatia |
4.2.2 Adoption of advanced herbicide technologies for effective weed control |
4.2.3 Government support and initiatives to promote sustainable agriculture practices |
4.3 Market Restraints |
4.3.1 Stringent regulations on herbicide usage and environmental concerns |
4.3.2 Competition from alternative weed control methods such as organic farming |
4.3.3 Fluctuating prices of raw materials used in herbicide production |
5 Croatia Herbicides? Market Trends |
6 Croatia Herbicides? Market Segmentations |
6.1 Croatia Herbicides? Market, By Type |
6.1.1 Overview and Analysis |
6.1.2 Croatia Herbicides? Market Revenues & Volume, By Glyphosate, 2022 - 2032F |
6.1.3 Croatia Herbicides? Market Revenues & Volume, By 2, 4-D, 2022 - 2032F |
6.1.4 Croatia Herbicides? Market Revenues & Volume, By Diquat, 2022 - 2032F |
6.1.5 Croatia Herbicides? Market Revenues & Volume, By Others, 2022 - 2032F |
6.2 Croatia Herbicides? Market, By Mode of Action |
6.2.1 Overview and Analysis |
6.2.2 Croatia Herbicides? Market Revenues & Volume, By Non-Selective, 2022 - 2032F |
6.2.3 Croatia Herbicides? Market Revenues & Volume, By Selective, 2022 - 2032F |
6.3 Croatia Herbicides? Market, By Crop Type |
6.3.1 Overview and Analysis |
6.3.2 Croatia Herbicides? Market Revenues & Volume, By Cereals & Grains, 2022 - 2032F |
6.3.3 Croatia Herbicides? Market Revenues & Volume, By Oilseeds & Pulses, 2022 - 2032F | 6.3.4 Croatia Herbicides? Market Revenues & Volume, By Fruits & Vegetables, 2022 - 2032F |
6.3.5 Croatia Herbicides? Market Revenues & Volume, By Others, 2022 - 2032F |
7 Croatia Herbicides? Market Import-Export Trade Statistics |
7.1 Croatia Herbicides? Market Export to Major Countries |
7.2 Croatia Herbicides? Market Imports from Major Countries |
8 Croatia Herbicides? Market Key Performance Indicators |
8.1 Adoption rate of advanced herbicide technologies in Croatia |
8.2 Percentage of agricultural land using herbicides for weed control |
8.3 Research and development investments in herbicide innovations |
9 Croatia Herbicides? Market - Opportunity Assessment |
9.1 Croatia Herbicides? Market Opportunity Assessment, By Type, 2022 & 2032F |
9.2 Croatia Herbicides? Market Opportunity Assessment, By Mode of Action, 2022 & 2032F |
9.3 Croatia Herbicides? Market Opportunity Assessment, By Crop Type, 2022 & 2032F |
10 Croatia Herbicides? Market - Competitive Landscape |
10.1 Croatia Herbicides? Market Revenue Share, By Companies, 2025 |
10.2 Croatia Herbicides? Market Competitive Benchmarking, By Operating and Technical Parameters |
11 Company Profiles |
12 Recommendations | 13 Disclaimer |
Export potential assessment - trade Analytics for 2030
Export potential enables firms to identify high-growth global markets with greater confidence by combining advanced trade intelligence with a structured quantitative methodology. The framework analyzes emerging demand trends and country-level import patterns while integrating macroeconomic and trade datasets such as GDP and population forecasts, bilateral import–export flows, tariff structures, elasticity differentials between developed and developing economies, geographic distance, and import demand projections. Using weighted trade values from 2020–2024 as the base period to project country-to-country export potential for 2030, these inputs are operationalized through calculated drivers such as gravity model parameters, tariff impact factors, and projected GDP per-capita growth. Through an analysis of hidden potentials, demand hotspots, and market conditions that are most favorable to success, this method enables firms to focus on target countries, maximize returns, and global expansion with data, backed by accuracy.
By factoring in the projected importer demand gap that is currently unmet and could be potential opportunity, it identifies the potential for the Exporter (Country) among 190 countries, against the general trade analysis, which identifies the biggest importer or exporter.
To discover high-growth global markets and optimize your business strategy:
Click Here
Pricing
- Single User License$ 1,995
- Department License$ 2,400
- Site License$ 3,120
- Global License$ 3,795

Search
Thought Leadership and Analyst Meet


Our Clients
Latest Reports
- India Ultrasonic Smart Water Meter Market (2026-2032) | Outlook, Competition, Drivers, Trends, Demand, Competitive, Strategic Insights, Companies, Challenges, Strategy, Consumer Insights, Analysis, Opportunities, Growth, Size, Share, Industry, Revenue, Segments, Value, Segmentation, Supply, Forecast, Restraints,
- India Electromagnetic Bulk Flow Meter Market (2026-2032) | Analysis, Challenges, Strategic Insights, Supply, Forecast, Growth, Share, Consumer Insights, Competitive, Value, Outlook, Size & Demand,
- India Battery Powered Bulk Flow Meter Market (2026-2032) | Outlook, Analysis, Competitive Landscape, Growth, Size, Trends, Value, Revenue, Companies, Segmentation, Share & Forecast
- Bosnia and Herzegovina Fuel-Efficient Winglets Market (2026-2032) | Growth, Competition, Strategy, Restraints, Trends, Challenges, segmentation, Value, Outlook, Investment Opportunities, Analysis, Revenue, Companies, Insights, Pricing, Size, Drivers, Demand, Share, Forecast
- Canada Cloud CFD Market (2026-2032) | Size & Revenue, Industry, Growth, Competitive Landscape, Forecast, Segmentation, Value, Outlook, Trends, Share, Analysis, Companies
- Taiwan Food Delivery Platform Market (2026-2032) | Companies, Outlook, Analysis, Trends, Value, Revenue, Segmentation, Share, Forecast, Competitive Landscape, Growth, Size & Forecast
- United Kingdom (UK) Long-term Care Insurance Market (2026-2032) | Growth, Share, Consumer Insights, Drivers, Opportunities, Competition, Pricing Analysis, Segments, Restraints, Companies, Competitive, Value, Outlook, Size, Demand, Analysis, Challenges, Strategic Insights, Investment Trends, Revenue, Trends, Supply, Forecast
- United Kingdom (UK) Long Term Care Market (2026-2032) | Companies, Outlook, Analysis, Trends, Value, Revenue, Segmentation, Share, Forecast, Competitive Landscape, Growth, Size & Forecast
- Iraq Insulation and Waterproofing Market (2026-2032) | Outlook, Drivers, Growth, Size, Share, Industry, Revenue, Trends, Demand, Competitive, Strategic Insights, Opportunities, Segments, Companies, Challenges, Strategy, Consumer Insights, Analysis, Investment Trends, Value, Segmentation, Forecast, Restraints
- India Switchgear Market Outlook (2026-2032) | Size, Share, Trends, Growth, Revenue, Forecast, Analysis, Value, Outlook
Industry Events and Analyst Meet

India EV Show 2026

EV tech India Expo 2026

Auto Tech Asia 2026

Battery Tech India 2026

Smart Production Solutions Guangzhou 2026
Whitepaper
- Middle East & Africa Commercial Security Market Click here to view more.
- Middle East & Africa Fire Safety Systems & Equipment Market Click here to view more.
- GCC Drone Market Click here to view more.
- Middle East Lighting Fixture Market Click here to view more.
- GCC Physical & Perimeter Security Market Click here to view more.
6WResearch In News
- Doha a strategic location for EV manufacturing hub: IPA Qatar
- Demand for luxury TVs surging in the GCC, says Samsung
- Empowering Growth: The Thriving Journey of Bangladesh’s Cable Industry
- Demand for luxury TVs surging in the GCC, says Samsung
- Video call with a traditional healer? Once unthinkable, it’s now common in South Africa
- Intelligent Buildings To Smooth GCC’s Path To Net Zero