Croatia Mobility Aid Devices Market (2025-2031) | Size, Value, Trends, Revenue, Industry, Growth, Forecast, Share, Analysis, Companies, Segmentation & Outlook
Market Forecast By Product (Wheelchairs, Mobility Scooters, Walking Aids, Mobility Lifts), By End-User (Home Care Settings, Hospitals & Nursing Homes, Assisted Living Facilities, Others) And Competitive Landscape
| Product Code: ETC5130231 | Publication Date: Nov 2023 | Updated Date: Oct 2025 | Product Type: Market Research Report | |
| Publisher: 6Wresearch | Author: Bhawna Singh | No. of Pages: 60 | No. of Figures: 30 | No. of Tables: 5 |
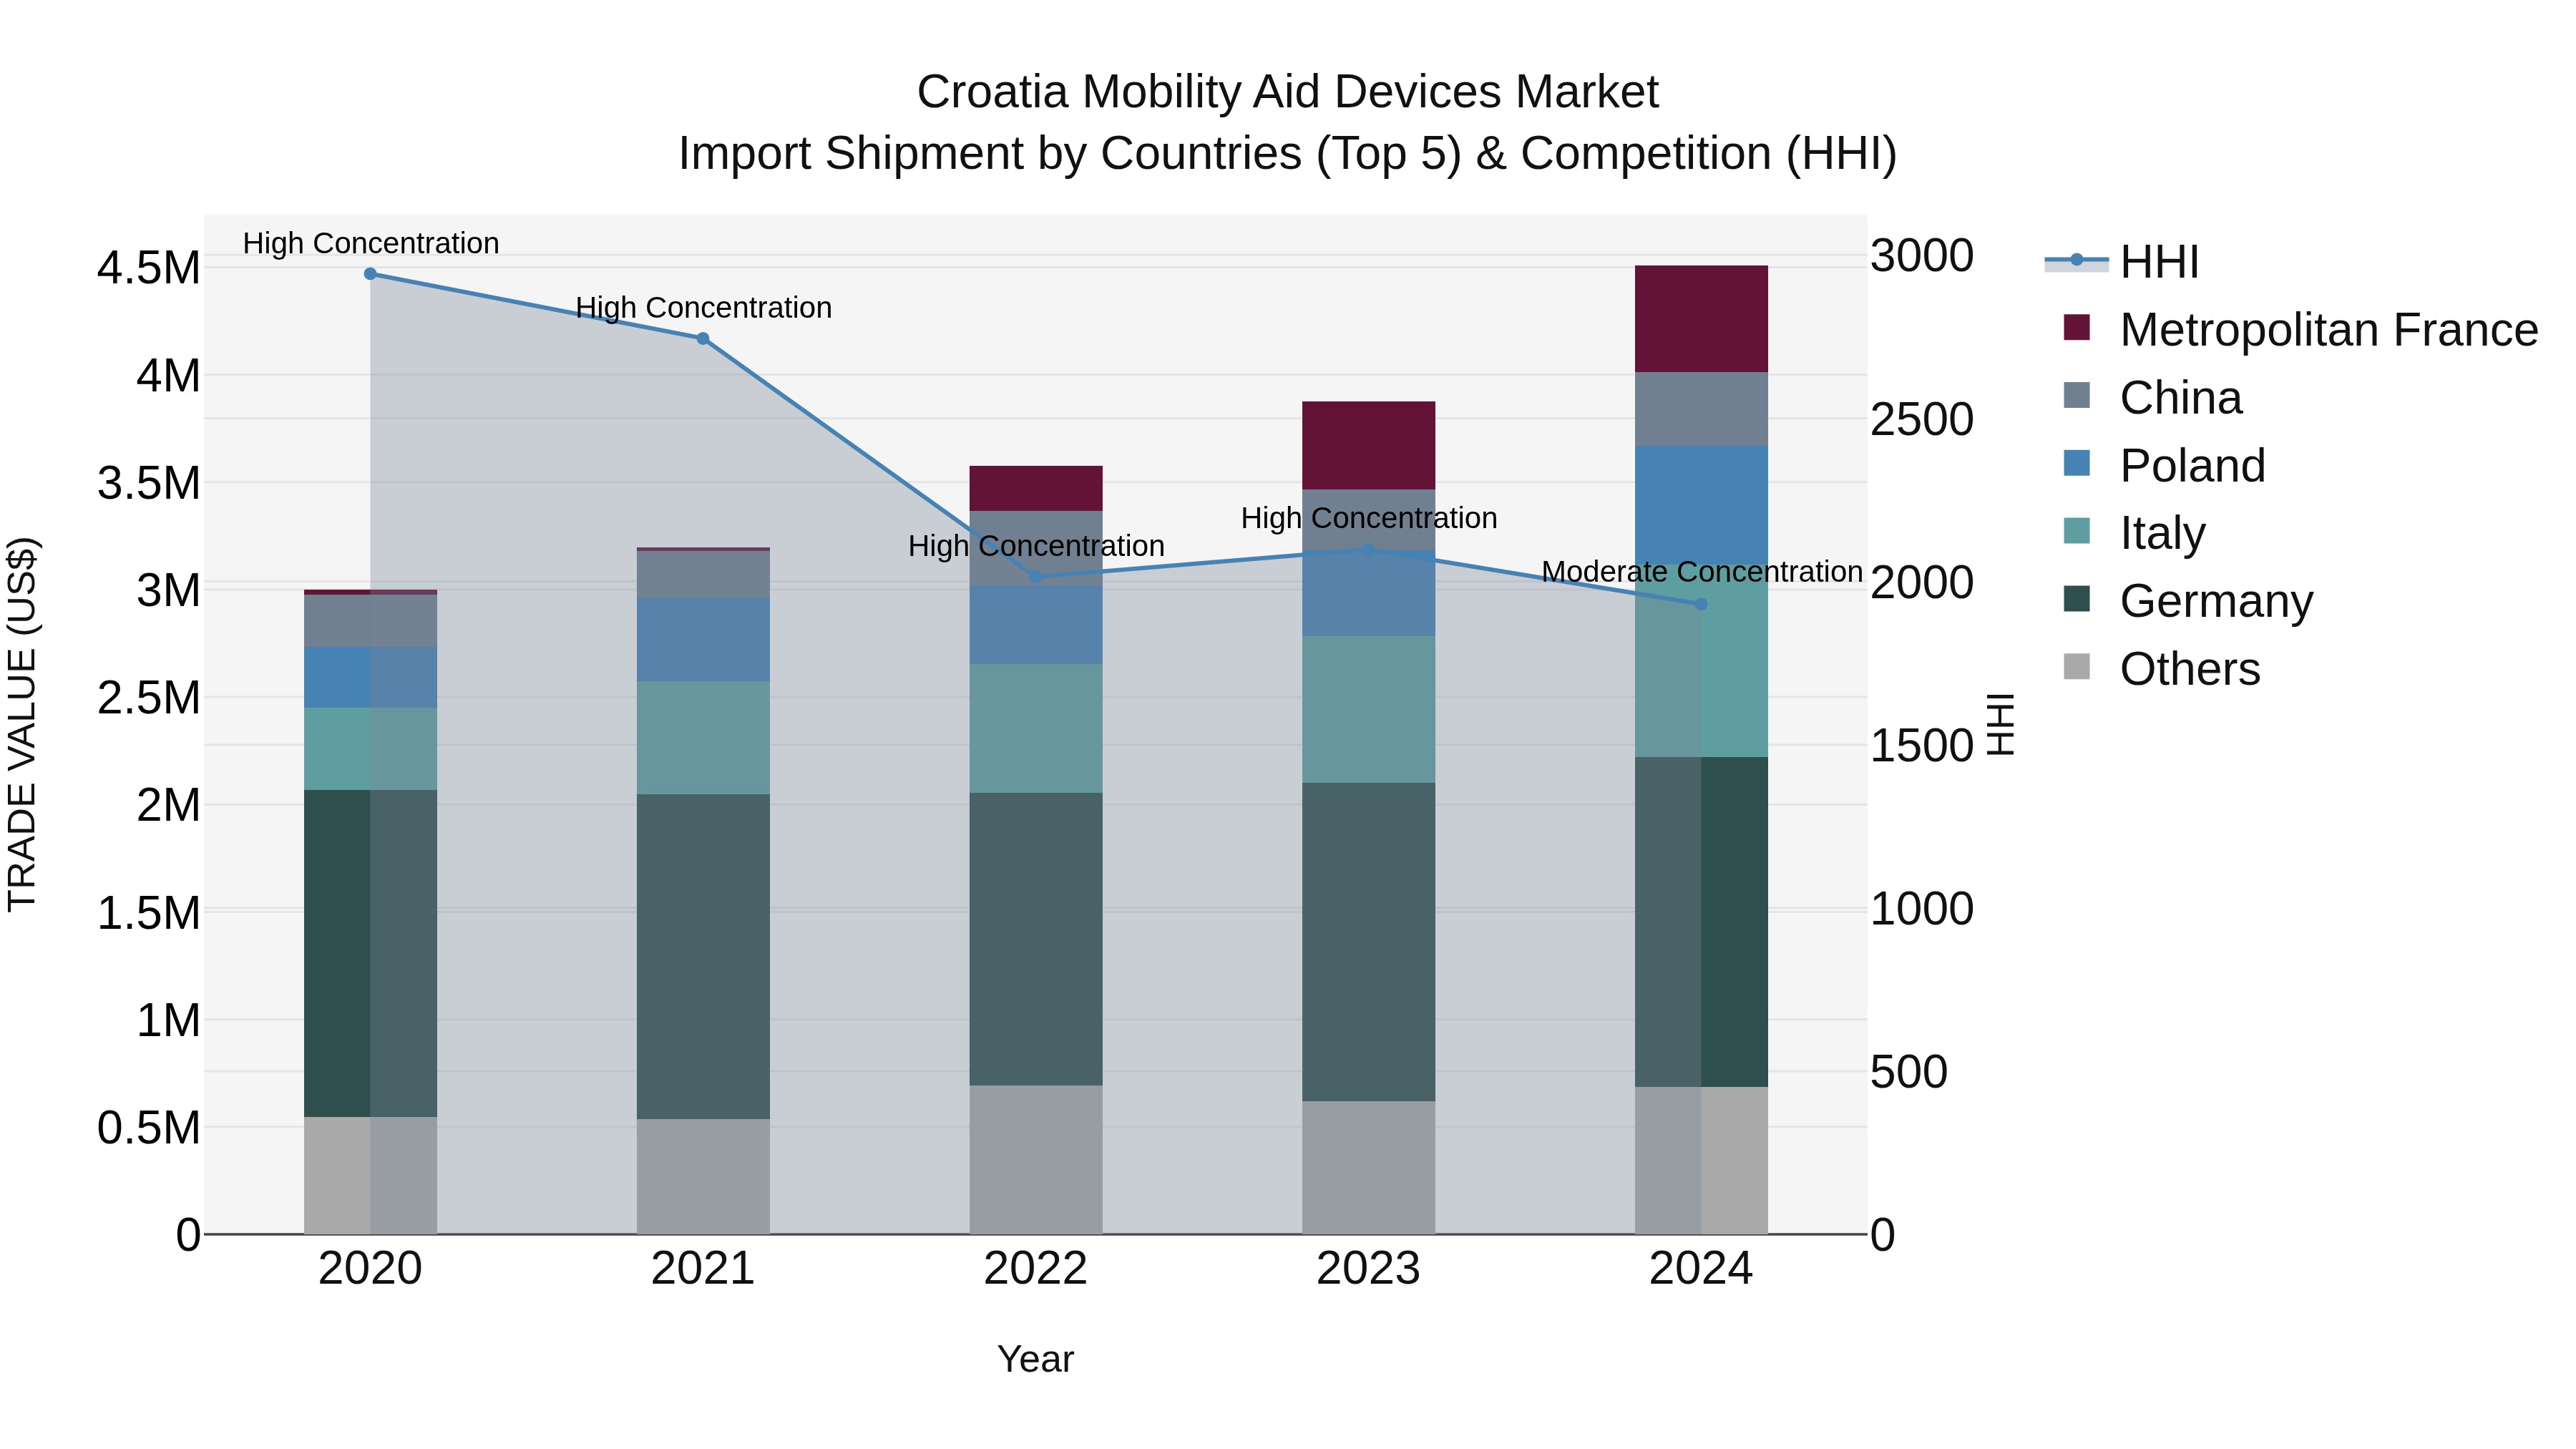
Croatia Mobility Aid Devices Market Top 5 Importing Countries and Market Competition (HHI) Analysis
The import shipments of mobility aid devices to Croatia in 2024 saw a notable increase in diversity, with top exporters being Germany, Italy, Poland, Metropolitan France, and China. The market concentration, as measured by the Herfindahl-Hirschman Index (HHI), decreased from high to moderate in 2024, indicating a more balanced market landscape. With a strong compound annual growth rate (CAGR) of 10.71% from 2020 to 2024 and a rapid growth rate of 16.34% from 2023 to 2024, the mobility aid devices market in Croatia is showing promising growth opportunities for global exporters.
Croatia Mobility Aid Devices Market Overview
Mobility aid devices help individuals with physical disabilities or limitations move more easily. In Croatia, this market includes products such as wheelchairs, walkers, and mobility scooters, driven by an aging population and increasing awareness of accessibility needs.
Drivers of the market
The mobility aid devices market benefits from the growing demand for products that assist individuals with mobility challenges. Mobility aids such as wheelchairs, walkers, and scooters improve independence and quality of life for users. The aging population, advancements in mobility technology, and the focus on enhancing accessibility drive market expansion.
Challenges of the market
The mobility aid devices market in Croatia faces challenges related to ensuring the affordability and accessibility of mobility aids for various user needs. Companies must address issues related to product innovation, regulatory compliance, and providing personalized solutions for users with diverse mobility challenges. Additionally, competition from other mobility aid providers and the need for continuous improvements impact the market.
Government Policy of the market
In Croatia, government policies related to the mobility aid devices market emphasize improving accessibility and quality of life for individuals with mobility challenges. Regulations include standards for device safety and effectiveness. The government supports research into advanced mobility aids and provides incentives for their adoption to enhance mobility and independence for users.
Key Highlights of the Report:
- Croatia Mobility Aid Devices Market Outlook
- Market Size of Croatia Mobility Aid Devices Market, 2024
- Forecast of Croatia Mobility Aid Devices Market, 2031
- Historical Data and Forecast of Croatia Mobility Aid Devices Revenues & Volume for the Period 2021-2031
- Croatia Mobility Aid Devices Market Trend Evolution
- Croatia Mobility Aid Devices Market Drivers and Challenges
- Croatia Mobility Aid Devices Price Trends
- Croatia Mobility Aid Devices Porter`s Five Forces
- Croatia Mobility Aid Devices Industry Life Cycle
- Historical Data and Forecast of Croatia Mobility Aid Devices Market Revenues & Volume By Product for the Period 2021-2031
- Historical Data and Forecast of Croatia Mobility Aid Devices Market Revenues & Volume By Wheelchairs for the Period 2021-2031
- Historical Data and Forecast of Croatia Mobility Aid Devices Market Revenues & Volume By Mobility Scooters for the Period 2021-2031
- Historical Data and Forecast of Croatia Mobility Aid Devices Market Revenues & Volume By Walking Aids for the Period 2021-2031
- Historical Data and Forecast of Croatia Mobility Aid Devices Market Revenues & Volume By Mobility Lifts for the Period 2021-2031
- Historical Data and Forecast of Croatia Mobility Aid Devices Market Revenues & Volume By End-User for the Period 2021-2031
- Historical Data and Forecast of Croatia Mobility Aid Devices Market Revenues & Volume By Home Care Settings for the Period 2021-2031
- Historical Data and Forecast of Croatia Mobility Aid Devices Market Revenues & Volume By Hospitals & Nursing Homes for the Period 2021-2031
- Historical Data and Forecast of Croatia Mobility Aid Devices Market Revenues & Volume By Assisted Living Facilities for the Period 2021-2031
- Historical Data and Forecast of Croatia Mobility Aid Devices Market Revenues & Volume By Others for the Period 2021-2031
- Croatia Mobility Aid Devices Import Export Trade Statistics
- Market Opportunity Assessment By Product
- Market Opportunity Assessment By End-User
- Croatia Mobility Aid Devices Top Companies Market Share
- Croatia Mobility Aid Devices Competitive Benchmarking By Technical and Operational Parameters
- Croatia Mobility Aid Devices Company Profiles
- Croatia Mobility Aid Devices Key Strategic Recommendations
Frequently Asked Questions About the Market Study (FAQs):
6Wresearch actively monitors the Croatia Mobility Aid Devices Market and publishes its comprehensive annual report, highlighting emerging trends, growth drivers, revenue analysis, and forecast outlook. Our insights help businesses to make data-backed strategic decisions with ongoing market dynamics. Our analysts track relevent industries related to the Croatia Mobility Aid Devices Market, allowing our clients with actionable intelligence and reliable forecasts tailored to emerging regional needs.
Yes, we provide customisation as per your requirements. To learn more, feel free to contact us on sales@6wresearch.com
1 Executive Summary |
2 Introduction |
2.1 Key Highlights of the Report |
2.2 Report Description |
2.3 Market Scope & Segmentation |
2.4 Research Methodology |
2.5 Assumptions |
3 Croatia Mobility Aid Devices Market Overview |
3.1 Croatia Country Macro Economic Indicators |
3.2 Croatia Mobility Aid Devices Market Revenues & Volume, 2021 & 2031F |
3.3 Croatia Mobility Aid Devices Market - Industry Life Cycle |
3.4 Croatia Mobility Aid Devices Market - Porter's Five Forces |
3.5 Croatia Mobility Aid Devices Market Revenues & Volume Share, By Product, 2021 & 2031F |
3.6 Croatia Mobility Aid Devices Market Revenues & Volume Share, By End-User, 2021 & 2031F |
4 Croatia Mobility Aid Devices Market Dynamics |
4.1 Impact Analysis |
4.2 Market Drivers |
4.2.1 Increasing aging population in Croatia leading to higher demand for mobility aid devices. |
4.2.2 Growing awareness and acceptance of mobility aid devices among the elderly and disabled population. |
4.2.3 Technological advancements in mobility aid devices improving functionality and usability. |
4.3 Market Restraints |
4.3.1 High cost of mobility aid devices limiting affordability for some individuals. |
4.3.2 Lack of reimbursement or insurance coverage for mobility aid devices. |
4.3.3 Limited awareness and education about the benefits and availability of mobility aid devices. |
5 Croatia Mobility Aid Devices Market Trends |
6 Croatia Mobility Aid Devices Market Segmentations |
6.1 Croatia Mobility Aid Devices Market, By Product |
6.1.1 Overview and Analysis |
6.1.2 Croatia Mobility Aid Devices Market Revenues & Volume, By Wheelchairs, 2021-2031F |
6.1.3 Croatia Mobility Aid Devices Market Revenues & Volume, By Mobility Scooters, 2021-2031F |
6.1.4 Croatia Mobility Aid Devices Market Revenues & Volume, By Walking Aids, 2021-2031F |
6.1.5 Croatia Mobility Aid Devices Market Revenues & Volume, By Mobility Lifts, 2021-2031F |
6.2 Croatia Mobility Aid Devices Market, By End-User |
6.2.1 Overview and Analysis |
6.2.2 Croatia Mobility Aid Devices Market Revenues & Volume, By Home Care Settings, 2021-2031F |
6.2.3 Croatia Mobility Aid Devices Market Revenues & Volume, By Hospitals & Nursing Homes, 2021-2031F |
6.2.4 Croatia Mobility Aid Devices Market Revenues & Volume, By Assisted Living Facilities, 2021-2031F |
6.2.5 Croatia Mobility Aid Devices Market Revenues & Volume, By Others, 2021-2031F |
7 Croatia Mobility Aid Devices Market Import-Export Trade Statistics |
7.1 Croatia Mobility Aid Devices Market Export to Major Countries |
7.2 Croatia Mobility Aid Devices Market Imports from Major Countries |
8 Croatia Mobility Aid Devices Market Key Performance Indicators |
8.1 Number of healthcare facilities offering mobility aid devices. |
8.2 Percentage of elderly population using mobility aid devices. |
8.3 Number of government initiatives supporting accessibility and affordability of mobility aid devices. |
9 Croatia Mobility Aid Devices Market - Opportunity Assessment |
9.1 Croatia Mobility Aid Devices Market Opportunity Assessment, By Product, 2021 & 2031F |
9.2 Croatia Mobility Aid Devices Market Opportunity Assessment, By End-User, 2021 & 2031F |
10 Croatia Mobility Aid Devices Market - Competitive Landscape |
10.1 Croatia Mobility Aid Devices Market Revenue Share, By Companies, 2024 |
10.2 Croatia Mobility Aid Devices Market Competitive Benchmarking, By Operating and Technical Parameters |
11 Company Profiles |
12 Recommendations | 13 Disclaimer |
Global Go To Market Strategy - 2030
Export potential enables firms to identify high-growth global markets with greater confidence by combining advanced trade intelligence with a structured quantitative methodology. The framework analyzes emerging demand trends and country-level import patterns while integrating macroeconomic and trade datasets such as GDP and population forecasts, bilateral import–export flows, tariff structures, elasticity differentials between developed and developing economies, geographic distance, and import demand projections. Using weighted trade values from 2020–2024 as the base period to project country-to-country export potential for 2030, these inputs are operationalized through calculated drivers such as gravity model parameters, tariff impact factors, and projected GDP per-capita growth. Through an analysis of hidden potentials, demand hotspots, and market conditions that are most favorable to success, this method enables firms to focus on target countries, maximize returns, and global expansion with data, backed by accuracy.
By factoring in the projected importer demand gap that is currently unmet and could be potential opportunity, it identifies the potential for the Exporter (Country) among 190 countries, against the general trade analysis, which identifies the biggest importer or exporter.
To discover high-growth global markets and optimize your business strategy:
Click Here
Pricing
- Single User License$ 1,995
- Department License$ 2,400
- Site License$ 3,120
- Global License$ 3,795

Leadership Perspectives from Industry Events
Search
Thought Leadership and Analyst Meet


Our Clients
6WResearch In News
- Doha a strategic location for EV manufacturing hub: IPA Qatar
- Demand for luxury TVs surging in the GCC, says Samsung
- Empowering Growth: The Thriving Journey of Bangladesh’s Cable Industry
- Demand for luxury TVs surging in the GCC, says Samsung
- Video call with a traditional healer? Once unthinkable, it’s now common in South Africa
- Intelligent Buildings To Smooth GCC’s Path To Net Zero
Latest Reports
- Taiwan Airport Wireless Infrastructure Market (2026-2032)
- Vietnam Airport Wireless Infrastructure Market (2026-2032)
- Thailand Airport Wireless Infrastructure Market (2026-2032)
- South Korea Airport Wireless Infrastructure Market (2026-2032)
- Romania Airport Wireless Infrastructure Market (2026-2032)
- Qatar Airport Wireless Infrastructure Market (2026-2032)
- Philippines Airport Wireless Infrastructure Market (2026-2032)
- Japan Airport Wireless Infrastructure Market (2026-2032)
- Taiwan Airport Winter Services Market (2026-2032)
- Vietnam Airport Winter Services Market (2026-2032)
Industry Events and Analyst Meet

HIMTEX 2026

India Refining Summit 2026

India EV Show 2026

EV tech India Expo 2026

Auto Tech Asia 2026
Whitepaper
- Middle East & Africa Commercial Security Market Click here to view more.
- Middle East & Africa Fire Safety Systems & Equipment Market Click here to view more.
- GCC Drone Market Click here to view more.
- Middle East Lighting Fixture Market Click here to view more.
- GCC Physical & Perimeter Security Market Click here to view more.