Croatia Para Menthane 3 8 Diol PMD Market (2026-2032) | Segmentation, Outlook, Revenue, Companies, Strategy, Size, Competitive, Competition, Drivers, Challenges, Restraints, Demand, Supply, Pricing Analysis, Analysis, Value, Strategic Insights, Growth, Consumer Insights, Forecast, Opportunities, Investment Trends, Industry, Share, Trends, Segments
Market Forecast By Type (Natural PMD, Synthetic PMD, High-Purity PMD, Blended PMD), By Source (Eucalyptus Oil, Lab-Derived, Processed Extract, Mixed Compounds), By Application (Insect Repellents, Agricultural Pest Control, Pharmaceuticals, Fragrances & Perfumes), By End User (Personal Care, Agriculture, Pharmaceutical Industry, Cosmetics Industry) And Competitive Landscape
| Product Code: ETC13069781 | Publication Date: Apr 2025 | Updated Date: Apr 2026 | Product Type: Market Research Report | |
| Publisher: 6Wresearch | Author: Sachin Kumar Rai | No. of Pages: 65 | No. of Figures: 34 | No. of Tables: 19 |
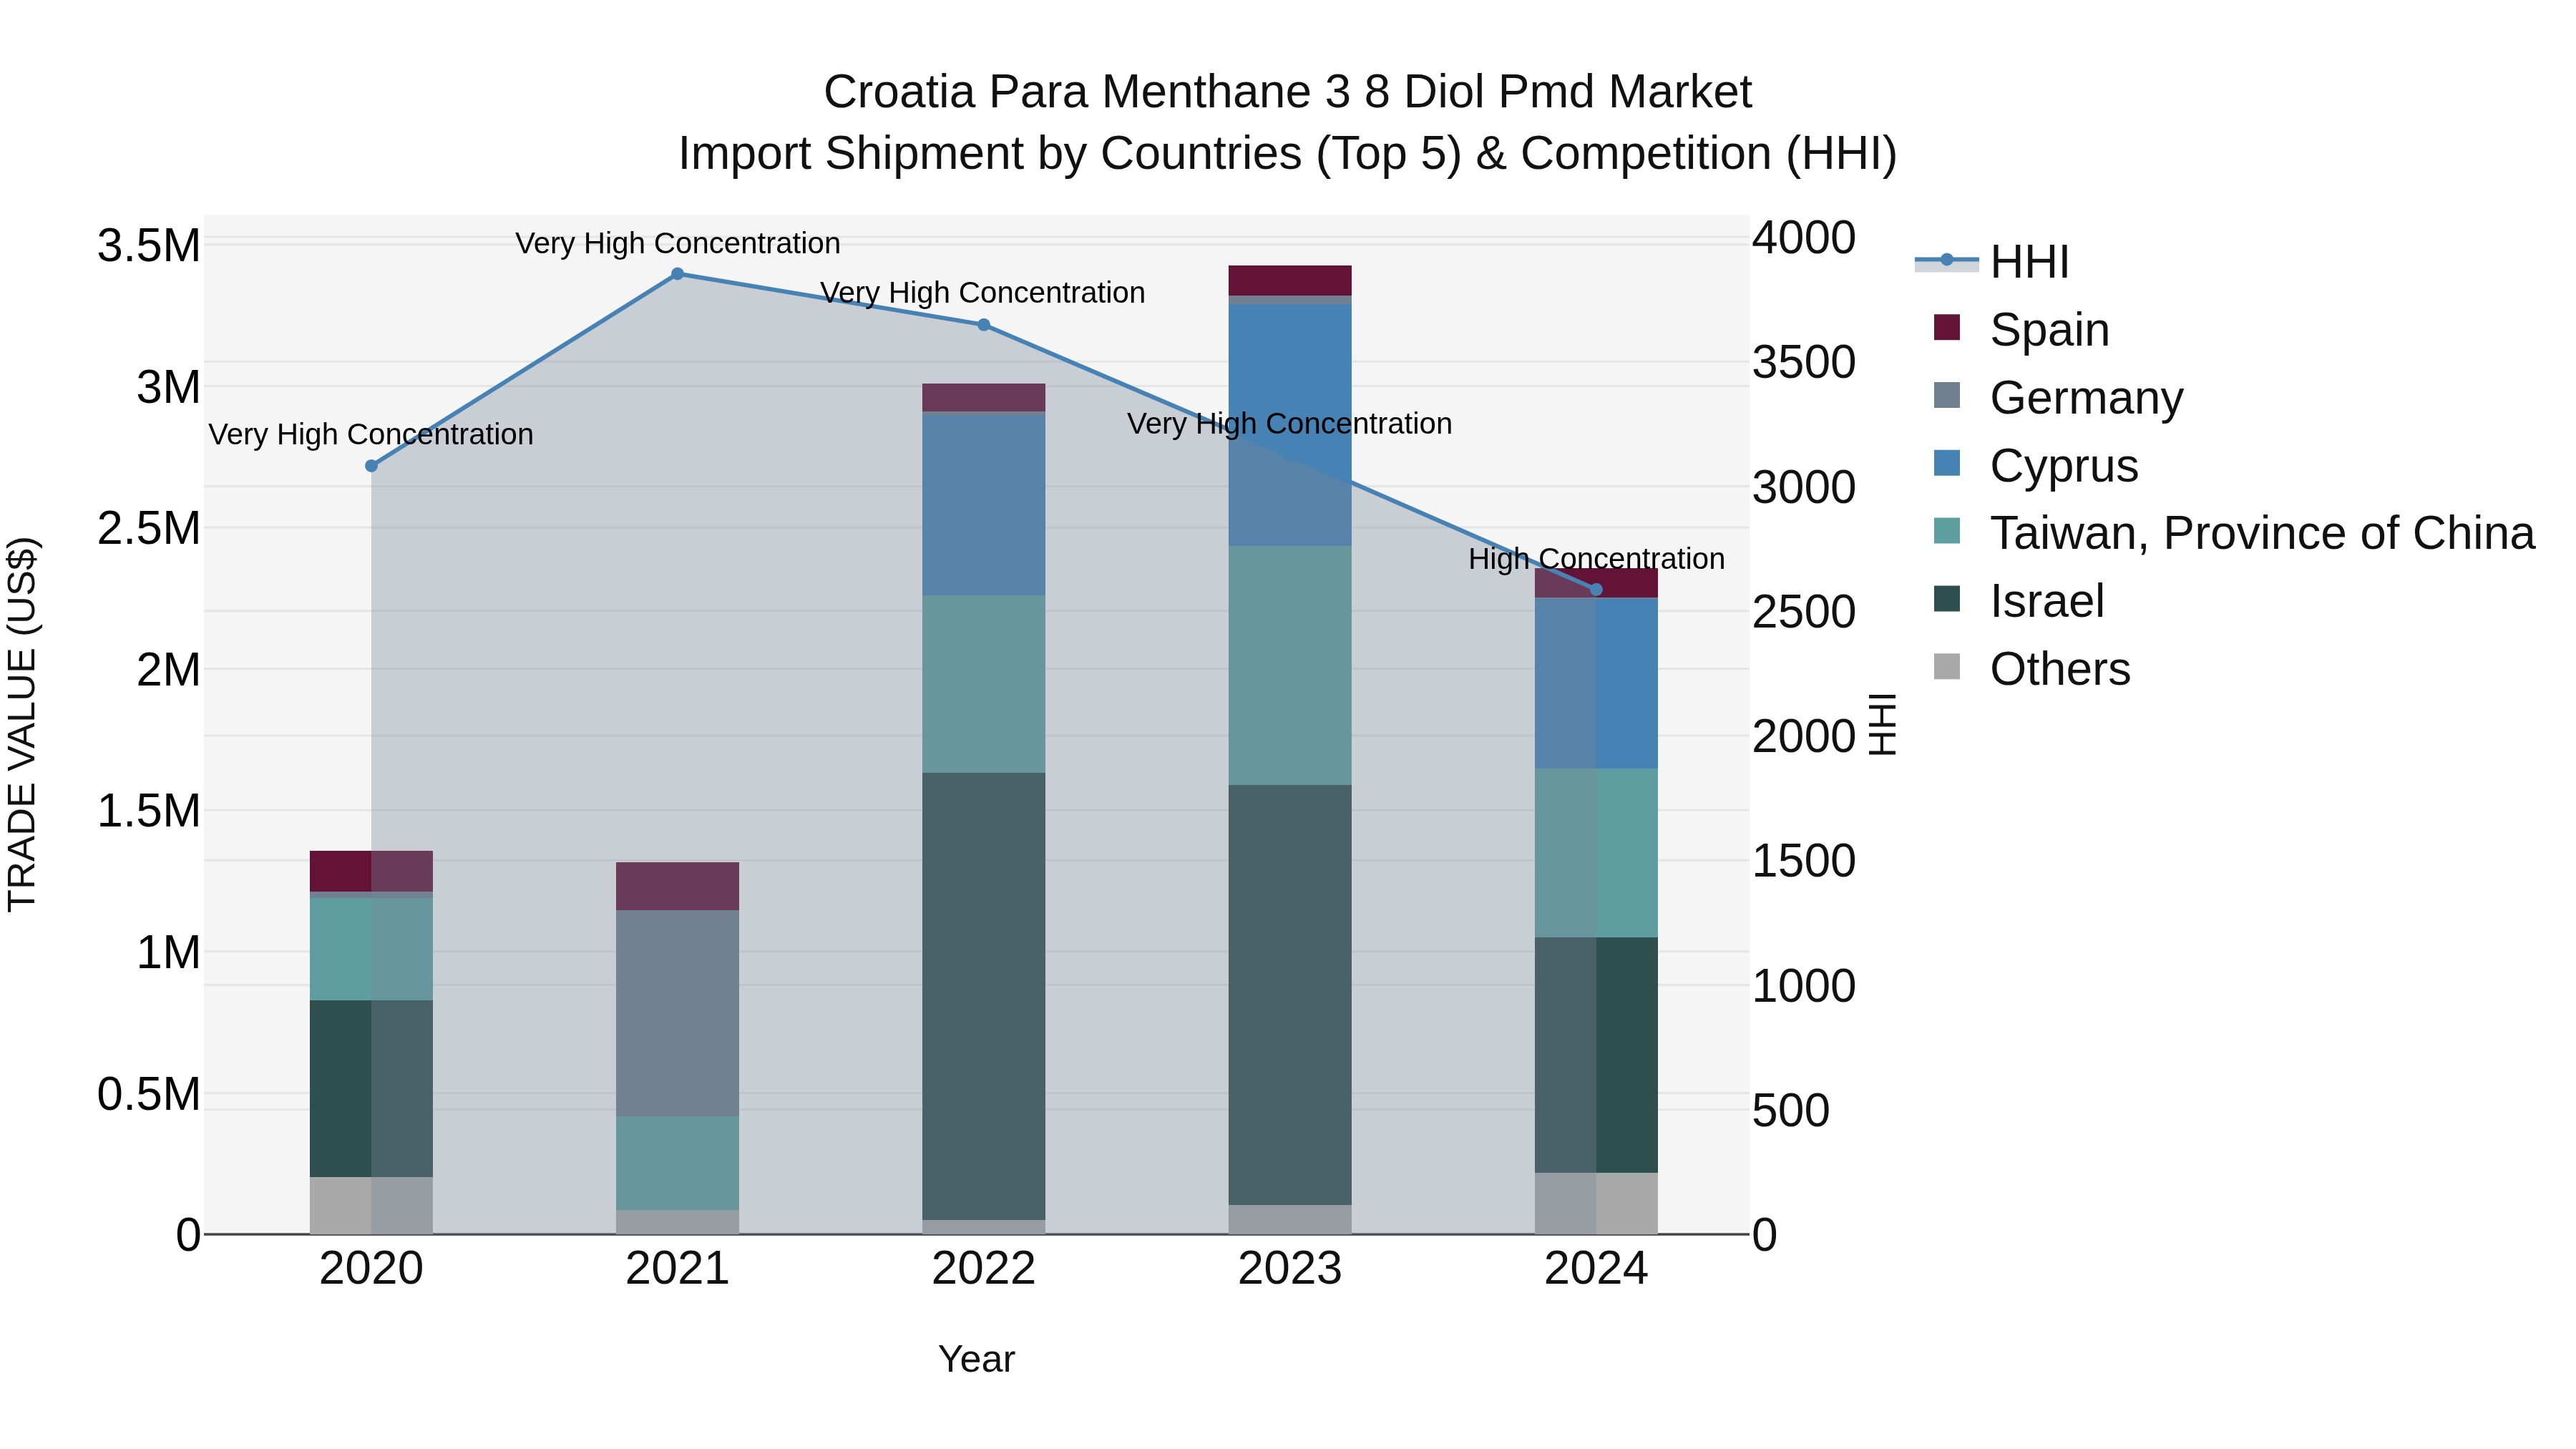
Croatia Para Menthane 3 8 Diol Pmd Market Top 5 Importing Countries and Market Competition (HHI) Analysis
Croatia import of para-menthane 3 8 diol (PMD) saw a significant shift in concentration levels, with a high Herfindahl-Hirschman Index (HHI) in 2023 becoming even higher in 2024. Despite a negative growth rate in 2024, the compound annual growth rate (CAGR) from 2020 to 2024 stands at an impressive 14.79%. Key exporting countries to Croatia in 2024 include Israel, Cyprus, Taiwan, Spain, and India, indicating a diverse source base for this product. The market dynamics suggest a continued interest in PMD imports in Croatia, with potential opportunities for market players to explore.
Key Highlights of the Report:
- Croatia Para Menthane 3 8 Diol PMD Market Outlook
- Market Size of Croatia Para Menthane 3 8 Diol PMD Market, 2025
- Forecast of Croatia Para Menthane 3 8 Diol PMD Market, 2032
- Historical Data and Forecast of Croatia Para Menthane 3 8 Diol PMD Revenues & Volume for the Period 2022 - 2032F
- Croatia Para Menthane 3 8 Diol PMD Market Trend Evolution
- Croatia Para Menthane 3 8 Diol PMD Market Drivers and Challenges
- Croatia Para Menthane 3 8 Diol PMD Price Trends
- Croatia Para Menthane 3 8 Diol PMD Porter's Five Forces
- Croatia Para Menthane 3 8 Diol PMD Industry Life Cycle
- Historical Data and Forecast of Croatia Para Menthane 3 8 Diol PMD Market Revenues & Volume By Type for the Period 2022 - 2032F
- Historical Data and Forecast of Croatia Para Menthane 3 8 Diol PMD Market Revenues & Volume By Natural PMD for the Period 2022 - 2032F
- Historical Data and Forecast of Croatia Para Menthane 3 8 Diol PMD Market Revenues & Volume By Synthetic PMD for the Period 2022 - 2032F
- Historical Data and Forecast of Croatia Para Menthane 3 8 Diol PMD Market Revenues & Volume By High-Purity PMD for the Period 2022 - 2032F
- Historical Data and Forecast of Croatia Para Menthane 3 8 Diol PMD Market Revenues & Volume By Blended PMD for the Period 2022 - 2032F
- Historical Data and Forecast of Croatia Para Menthane 3 8 Diol PMD Market Revenues & Volume By Source for the Period 2022 - 2032F
- Historical Data and Forecast of Croatia Para Menthane 3 8 Diol PMD Market Revenues & Volume By Eucalyptus Oil for the Period 2022 - 2032F
- Historical Data and Forecast of Croatia Para Menthane 3 8 Diol PMD Market Revenues & Volume By Lab-Derived for the Period 2022 - 2032F
- Historical Data and Forecast of Croatia Para Menthane 3 8 Diol PMD Market Revenues & Volume By Processed Extract for the Period 2022 - 2032F
- Historical Data and Forecast of Croatia Para Menthane 3 8 Diol PMD Market Revenues & Volume By Mixed Compounds for the Period 2022 - 2032F
- Historical Data and Forecast of Croatia Para Menthane 3 8 Diol PMD Market Revenues & Volume By Application for the Period 2022 - 2032F
- Historical Data and Forecast of Croatia Para Menthane 3 8 Diol PMD Market Revenues & Volume By Insect Repellents for the Period 2022 - 2032F
- Historical Data and Forecast of Croatia Para Menthane 3 8 Diol PMD Market Revenues & Volume By Agricultural Pest Control for the Period 2022 - 2032F
- Historical Data and Forecast of Croatia Para Menthane 3 8 Diol PMD Market Revenues & Volume By Pharmaceuticals for the Period 2022 - 2032F
- Historical Data and Forecast of Croatia Para Menthane 3 8 Diol PMD Market Revenues & Volume By Fragrances & Perfumes for the Period 2022 - 2032F
- Historical Data and Forecast of Croatia Para Menthane 3 8 Diol PMD Market Revenues & Volume By End User for the Period 2022 - 2032F
- Historical Data and Forecast of Croatia Para Menthane 3 8 Diol PMD Market Revenues & Volume By Personal Care for the Period 2022 - 2032F
- Historical Data and Forecast of Croatia Para Menthane 3 8 Diol PMD Market Revenues & Volume By Agriculture for the Period 2022 - 2032F
- Historical Data and Forecast of Croatia Para Menthane 3 8 Diol PMD Market Revenues & Volume By Pharmaceutical Industry for the Period 2022 - 2032F
- Historical Data and Forecast of Croatia Para Menthane 3 8 Diol PMD Market Revenues & Volume By Cosmetics Industry for the Period 2022 - 2032F
- Croatia Para Menthane 3 8 Diol PMD Import Export Trade Statistics
- Market Opportunity Assessment By Type
- Market Opportunity Assessment By Source
- Market Opportunity Assessment By Application
- Market Opportunity Assessment By End User
- Croatia Para Menthane 3 8 Diol PMD Top Companies Market Share
- Croatia Para Menthane 3 8 Diol PMD Competitive Benchmarking By Technical and Operational Parameters
- Croatia Para Menthane 3 8 Diol PMD Company Profiles
- Croatia Para Menthane 3 8 Diol PMD Key Strategic Recommendations
Frequently Asked Questions About the Market Study (FAQs):
6Wresearch actively monitors the Croatia Para Menthane 3 8 Diol PMD Market and publishes its comprehensive annual report, highlighting emerging trends, growth drivers, revenue analysis, and forecast outlook. Our insights help businesses to make data-backed strategic decisions with ongoing market dynamics. Our analysts track relevent industries related to the Croatia Para Menthane 3 8 Diol PMD Market, allowing our clients with actionable intelligence and reliable forecasts tailored to emerging regional needs.
Yes, we provide customisation as per your requirements. To learn more, feel free to contact us on sales@6wresearch.com
1 Executive Summary |
2 Introduction |
2.1 Key Highlights of the Report |
2.2 Report Description |
2.3 Market Scope & Segmentation |
2.4 Research Methodology |
2.5 Assumptions |
3 Croatia Para Menthane 3 8 Diol PMD Market Overview |
3.1 Croatia Country Macro Economic Indicators |
3.2 Croatia Para Menthane 3 8 Diol PMD Market Revenues & Volume, 2022 & 2032F |
3.3 Croatia Para Menthane 3 8 Diol PMD Market - Industry Life Cycle |
3.4 Croatia Para Menthane 3 8 Diol PMD Market - Porter's Five Forces |
3.5 Croatia Para Menthane 3 8 Diol PMD Market Revenues & Volume Share, By Type, 2022 & 2032F |
3.6 Croatia Para Menthane 3 8 Diol PMD Market Revenues & Volume Share, By Source, 2022 & 2032F |
3.7 Croatia Para Menthane 3 8 Diol PMD Market Revenues & Volume Share, By Application, 2022 & 2032F |
3.8 Croatia Para Menthane 3 8 Diol PMD Market Revenues & Volume Share, By End User, 2022 & 2032F |
4 Croatia Para Menthane 3 8 Diol PMD Market Dynamics |
4.1 Impact Analysis |
4.2 Market Drivers |
4.2.1 Increasing demand for natural and sustainable insect repellents |
4.2.2 Growth in the personal care and pharmaceutical industries |
4.2.3 Rising awareness about the benefits of para-menthane-3,8-diol (PMD) as an effective mosquito repellent |
4.3 Market Restraints |
4.3.1 Regulatory hurdles and compliance requirements in the production and sale of PMD products |
4.3.2 Fluctuating raw material prices impacting production costs |
5 Croatia Para Menthane 3 8 Diol PMD Market Trends |
6 Croatia Para Menthane 3 8 Diol PMD Market, By Types |
6.1 Croatia Para Menthane 3 8 Diol PMD Market, By Type |
6.1.1 Overview and Analysis |
6.1.2 Croatia Para Menthane 3 8 Diol PMD Market Revenues & Volume, By Type, 2022 - 2032F |
6.1.3 Croatia Para Menthane 3 8 Diol PMD Market Revenues & Volume, By Natural PMD, 2022 - 2032F |
6.1.4 Croatia Para Menthane 3 8 Diol PMD Market Revenues & Volume, By Synthetic PMD, 2022 - 2032F |
6.1.5 Croatia Para Menthane 3 8 Diol PMD Market Revenues & Volume, By High-Purity PMD, 2022 - 2032F |
6.1.6 Croatia Para Menthane 3 8 Diol PMD Market Revenues & Volume, By Blended PMD, 2022 - 2032F |
6.2 Croatia Para Menthane 3 8 Diol PMD Market, By Source |
6.2.1 Overview and Analysis |
6.2.2 Croatia Para Menthane 3 8 Diol PMD Market Revenues & Volume, By Eucalyptus Oil, 2022 - 2032F |
6.2.3 Croatia Para Menthane 3 8 Diol PMD Market Revenues & Volume, By Lab-Derived, 2022 - 2032F |
6.2.4 Croatia Para Menthane 3 8 Diol PMD Market Revenues & Volume, By Processed Extract, 2022 - 2032F |
6.2.5 Croatia Para Menthane 3 8 Diol PMD Market Revenues & Volume, By Mixed Compounds, 2022 - 2032F |
6.3 Croatia Para Menthane 3 8 Diol PMD Market, By Application |
6.3.1 Overview and Analysis |
6.3.2 Croatia Para Menthane 3 8 Diol PMD Market Revenues & Volume, By Insect Repellents, 2022 - 2032F |
6.3.3 Croatia Para Menthane 3 8 Diol PMD Market Revenues & Volume, By Agricultural Pest Control, 2022 - 2032F |
6.3.4 Croatia Para Menthane 3 8 Diol PMD Market Revenues & Volume, By Pharmaceuticals, 2022 - 2032F |
6.3.5 Croatia Para Menthane 3 8 Diol PMD Market Revenues & Volume, By Fragrances & Perfumes, 2022 - 2032F |
6.4 Croatia Para Menthane 3 8 Diol PMD Market, By End User |
6.4.1 Overview and Analysis |
6.4.2 Croatia Para Menthane 3 8 Diol PMD Market Revenues & Volume, By Personal Care, 2022 - 2032F |
6.4.3 Croatia Para Menthane 3 8 Diol PMD Market Revenues & Volume, By Agriculture, 2022 - 2032F |
6.4.4 Croatia Para Menthane 3 8 Diol PMD Market Revenues & Volume, By Pharmaceutical Industry, 2022 - 2032F |
6.4.5 Croatia Para Menthane 3 8 Diol PMD Market Revenues & Volume, By Cosmetics Industry, 2022 - 2032F |
7 Croatia Para Menthane 3 8 Diol PMD Market Import-Export Trade Statistics |
7.1 Croatia Para Menthane 3 8 Diol PMD Market Export to Major Countries |
7.2 Croatia Para Menthane 3 8 Diol PMD Market Imports from Major Countries |
8 Croatia Para Menthane 3 8 Diol PMD Market Key Performance Indicators |
8.1 Research and development investments in PMD-based product innovation |
8.2 Number of new product launches containing PMD |
8.3 Expansion of distribution channels for PMD products |
8.4 Adoption rate of PMD products in different end-user industries |
8.5 Investment in marketing and promotional activities for PMD-based products |
9 Croatia Para Menthane 3 8 Diol PMD Market - Opportunity Assessment |
9.1 Croatia Para Menthane 3 8 Diol PMD Market Opportunity Assessment, By Type, 2022 & 2032F |
9.2 Croatia Para Menthane 3 8 Diol PMD Market Opportunity Assessment, By Source, 2022 & 2032F |
9.3 Croatia Para Menthane 3 8 Diol PMD Market Opportunity Assessment, By Application, 2022 & 2032F |
9.4 Croatia Para Menthane 3 8 Diol PMD Market Opportunity Assessment, By End User, 2022 & 2032F |
10 Croatia Para Menthane 3 8 Diol PMD Market - Competitive Landscape |
10.1 Croatia Para Menthane 3 8 Diol PMD Market Revenue Share, By Companies, 2025 |
10.2 Croatia Para Menthane 3 8 Diol PMD Market Competitive Benchmarking, By Operating and Technical Parameters |
11 Company Profiles |
12 Recommendations |
13 Disclaimer |
Export potential assessment - trade Analytics for 2030
Export potential enables firms to identify high-growth global markets with greater confidence by combining advanced trade intelligence with a structured quantitative methodology. The framework analyzes emerging demand trends and country-level import patterns while integrating macroeconomic and trade datasets such as GDP and population forecasts, bilateral import–export flows, tariff structures, elasticity differentials between developed and developing economies, geographic distance, and import demand projections. Using weighted trade values from 2020–2024 as the base period to project country-to-country export potential for 2030, these inputs are operationalized through calculated drivers such as gravity model parameters, tariff impact factors, and projected GDP per-capita growth. Through an analysis of hidden potentials, demand hotspots, and market conditions that are most favorable to success, this method enables firms to focus on target countries, maximize returns, and global expansion with data, backed by accuracy.
By factoring in the projected importer demand gap that is currently unmet and could be potential opportunity, it identifies the potential for the Exporter (Country) among 190 countries, against the general trade analysis, which identifies the biggest importer or exporter.
To discover high-growth global markets and optimize your business strategy:
Click Here
Pricing
- Single User License$ 1,995
- Department License$ 2,400
- Site License$ 3,120
- Global License$ 3,795

Search
Thought Leadership and Analyst Meet


Our Clients
Latest Reports
- United Kingdom (UK) Outdoor Cooking Equipment Market (2026-2032) | Investment Opportunities, Outlook, Growth, Competition, Trends, Pricing, Demand, Insights, Challenges, Drivers, Size, Restraints, segmentation, Value, Share, Forecast, Companies, Analysis, Revenue, Strategy
- United Arab Emirates (UAE) Outdoor Cooking Equipment Market (2026-2032) | Challenges, Value, Restraints, Growth, Competition, Revenue, Trends, Outlook, Analysis, Drivers, Share, Investment Opportunities, Strategy, Demand, Companies, Forecast, Pricing, segmentation, Size, Insights
- Vietnam Outdoor Cooking Equipment Market (2026-2032) | Demand, Investment Opportunities, Growth, Pricing, Trends, Restraints, Competition, Outlook, Drivers, Strategy, Challenges, Revenue, Analysis, segmentation, Value, Size, Share, Insights, Companies, Forecast
- Venezuela Outdoor Cooking Equipment Market (2026-2032) | Challenges, Revenue, Demand, Value, Pricing, Strategy, Competition, Analysis, Companies, Insights, Growth, Outlook, Forecast, Size, Restraints, segmentation, Drivers, Trends, Investment Opportunities, Share
- Uganda Outdoor Cooking Equipment Market (2026-2032) | Drivers, Pricing, Challenges, Value, Growth, Companies, segmentation, Strategy, Analysis, Demand, Outlook, Size, Competition, Restraints, Revenue, Forecast, Investment Opportunities, Insights, Trends, Share
- Turkey Outdoor Cooking Equipment Market (2026-2032) | Size, Competition, Outlook, Strategy, Forecast, Drivers, Trends, Companies, Revenue, Growth, Analysis, segmentation, Insights, Pricing, Restraints, Demand, Investment Opportunities, Value, Share, Challenges
- Tunisia Outdoor Cooking Equipment Market (2026-2032) | Analysis, Share, Pricing, Trends, Size, Outlook, Revenue, segmentation, Demand, Insights, Investment Opportunities, Restraints, Growth, Forecast, Competition, Drivers, Challenges, Companies, Strategy, Value
- Thailand Outdoor Cooking Equipment Market (2026-2032) | Growth, Revenue, Insights, Companies, Drivers, Strategy, Forecast, Size, Analysis, segmentation, Trends, Challenges, Competition, Share, Investment Opportunities, Demand, Pricing, Value, Restraints, Outlook
- Tanzania Outdoor Cooking Equipment Market (2026-2032) | Share, Drivers, Forecast, Revenue, Growth, Outlook, Analysis, Investment Opportunities, Restraints, segmentation, Demand, Pricing, Size, Insights, Challenges, Competition, Companies, Value, Trends, Strategy
- Tajikistan Outdoor Cooking Equipment Market (2026-2032) | Value, Pricing, Companies, Share, Strategy, Revenue, Investment Opportunities, Demand, Forecast, Size, Competition, Challenges, Growth, Insights, Restraints, segmentation, Analysis, Trends, Drivers, Outlook
Industry Events and Analyst Meet

HIMTEX 2026

India Refining Summit 2026

India EV Show 2026

EV tech India Expo 2026

Auto Tech Asia 2026
Whitepaper
- Middle East & Africa Commercial Security Market Click here to view more.
- Middle East & Africa Fire Safety Systems & Equipment Market Click here to view more.
- GCC Drone Market Click here to view more.
- Middle East Lighting Fixture Market Click here to view more.
- GCC Physical & Perimeter Security Market Click here to view more.
6WResearch In News
- Doha a strategic location for EV manufacturing hub: IPA Qatar
- Demand for luxury TVs surging in the GCC, says Samsung
- Empowering Growth: The Thriving Journey of Bangladesh’s Cable Industry
- Demand for luxury TVs surging in the GCC, says Samsung
- Video call with a traditional healer? Once unthinkable, it’s now common in South Africa
- Intelligent Buildings To Smooth GCC’s Path To Net Zero