Croatia Potassium Fluorosilicate Market (2026-2032) | Value, Industry, Companies, Share, Growth, Analysis, Trends, Revenue, Segmentation, Size, Forecast & Outlook
Market Forecast By Type (0.98, Other), By Application (Metal industry (fluxing agents)., Glass industry (opacifying agent)., Construction industry (additive for concrete)) And Competitive Landscape
| Product Code: ETC4893757 | Publication Date: Nov 2023 | Updated Date: Apr 2026 | Product Type: Market Research Report | |
| Publisher: 6Wresearch | Author: Shubham Padhi | No. of Pages: 60 | No. of Figures: 30 | No. of Tables: 5 |
Croatia Potassium Fluorosilicate Market Size (2020-2030)
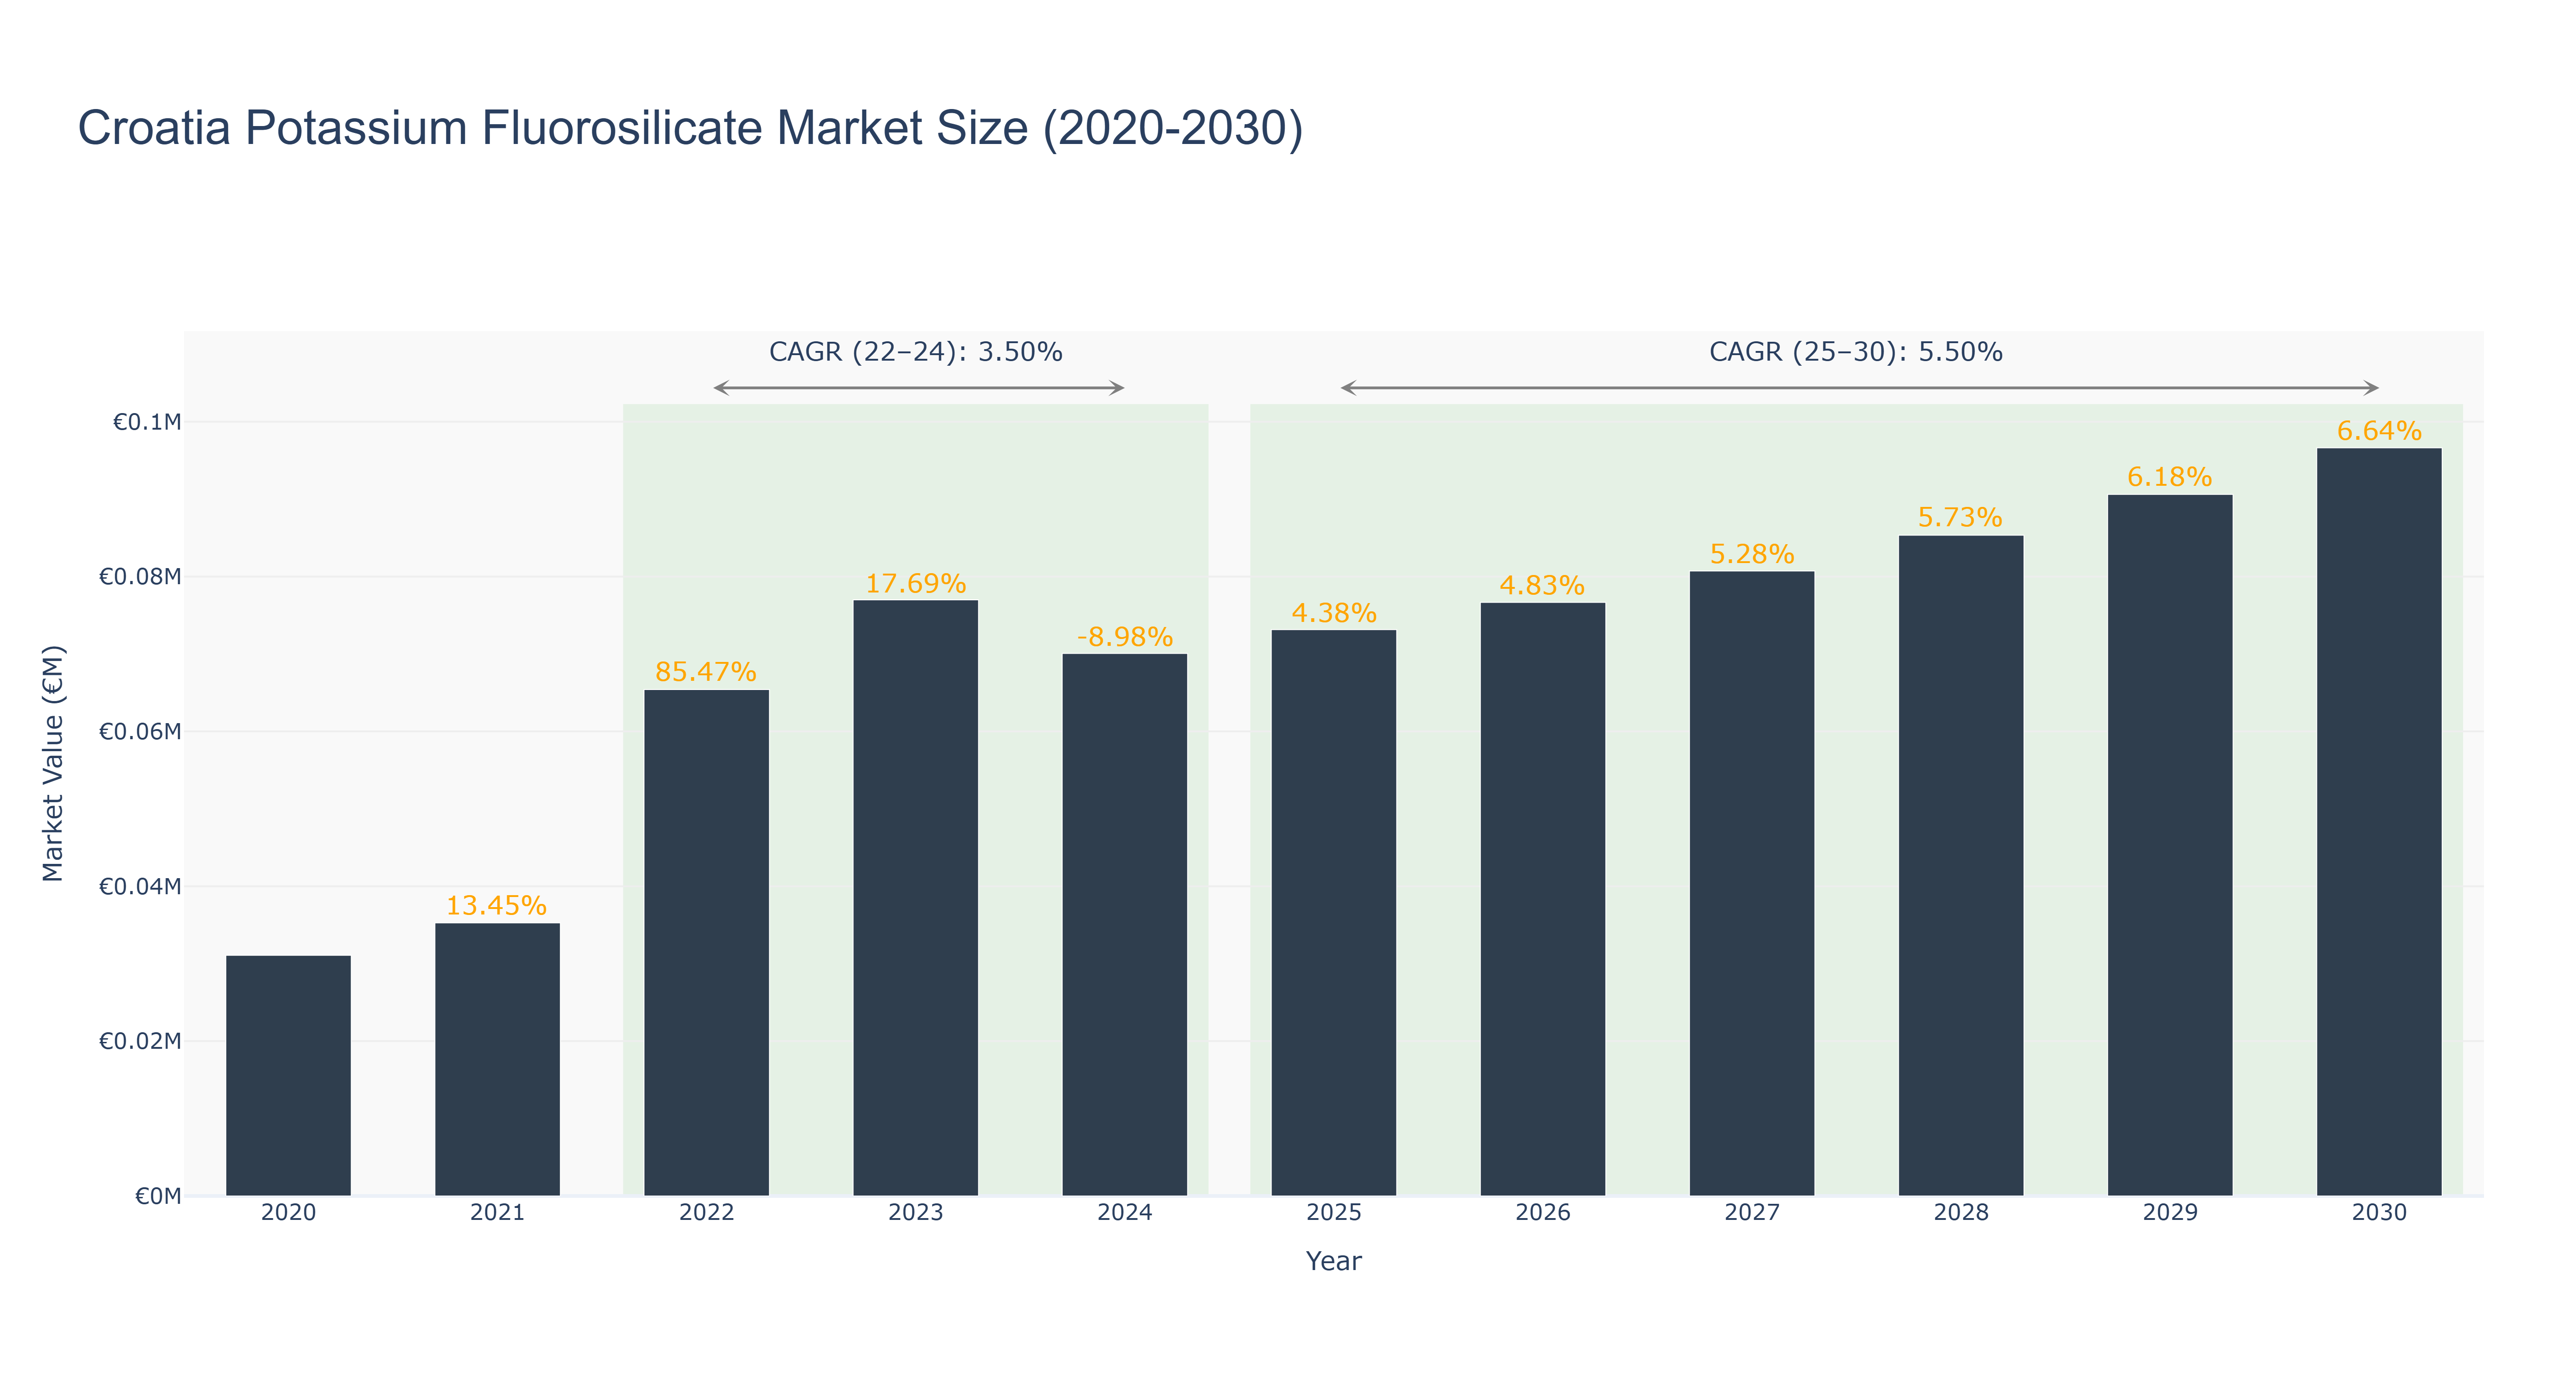
Croatia's Potassium Fluorosilicate Market witnessed a gradual rise in market size from €0.03 million in 2020 to €0.08 million in 2026, with a steady growth rate. The market is forecasted to continue its positive trajectory, reaching €0.10 million by 2030, supported by a Compound Annual Growth Rate (CAGR) of 5.50% from 2025 to 2030. Notably, the market experienced a slight decline in 2024, attributed to external economic factors affecting demand. The upward trend can be attributed to increasing industrial applications and the growing demand for specialty chemicals in the region. Looking ahead, Croatia is set to introduce new regulations promoting sustainable practices in chemical production, which is expected to further boost market growth and innovation in the coming years.
Croatia Potassium Fluorosilicate Market: Production & Trade Performance (2019-2025)
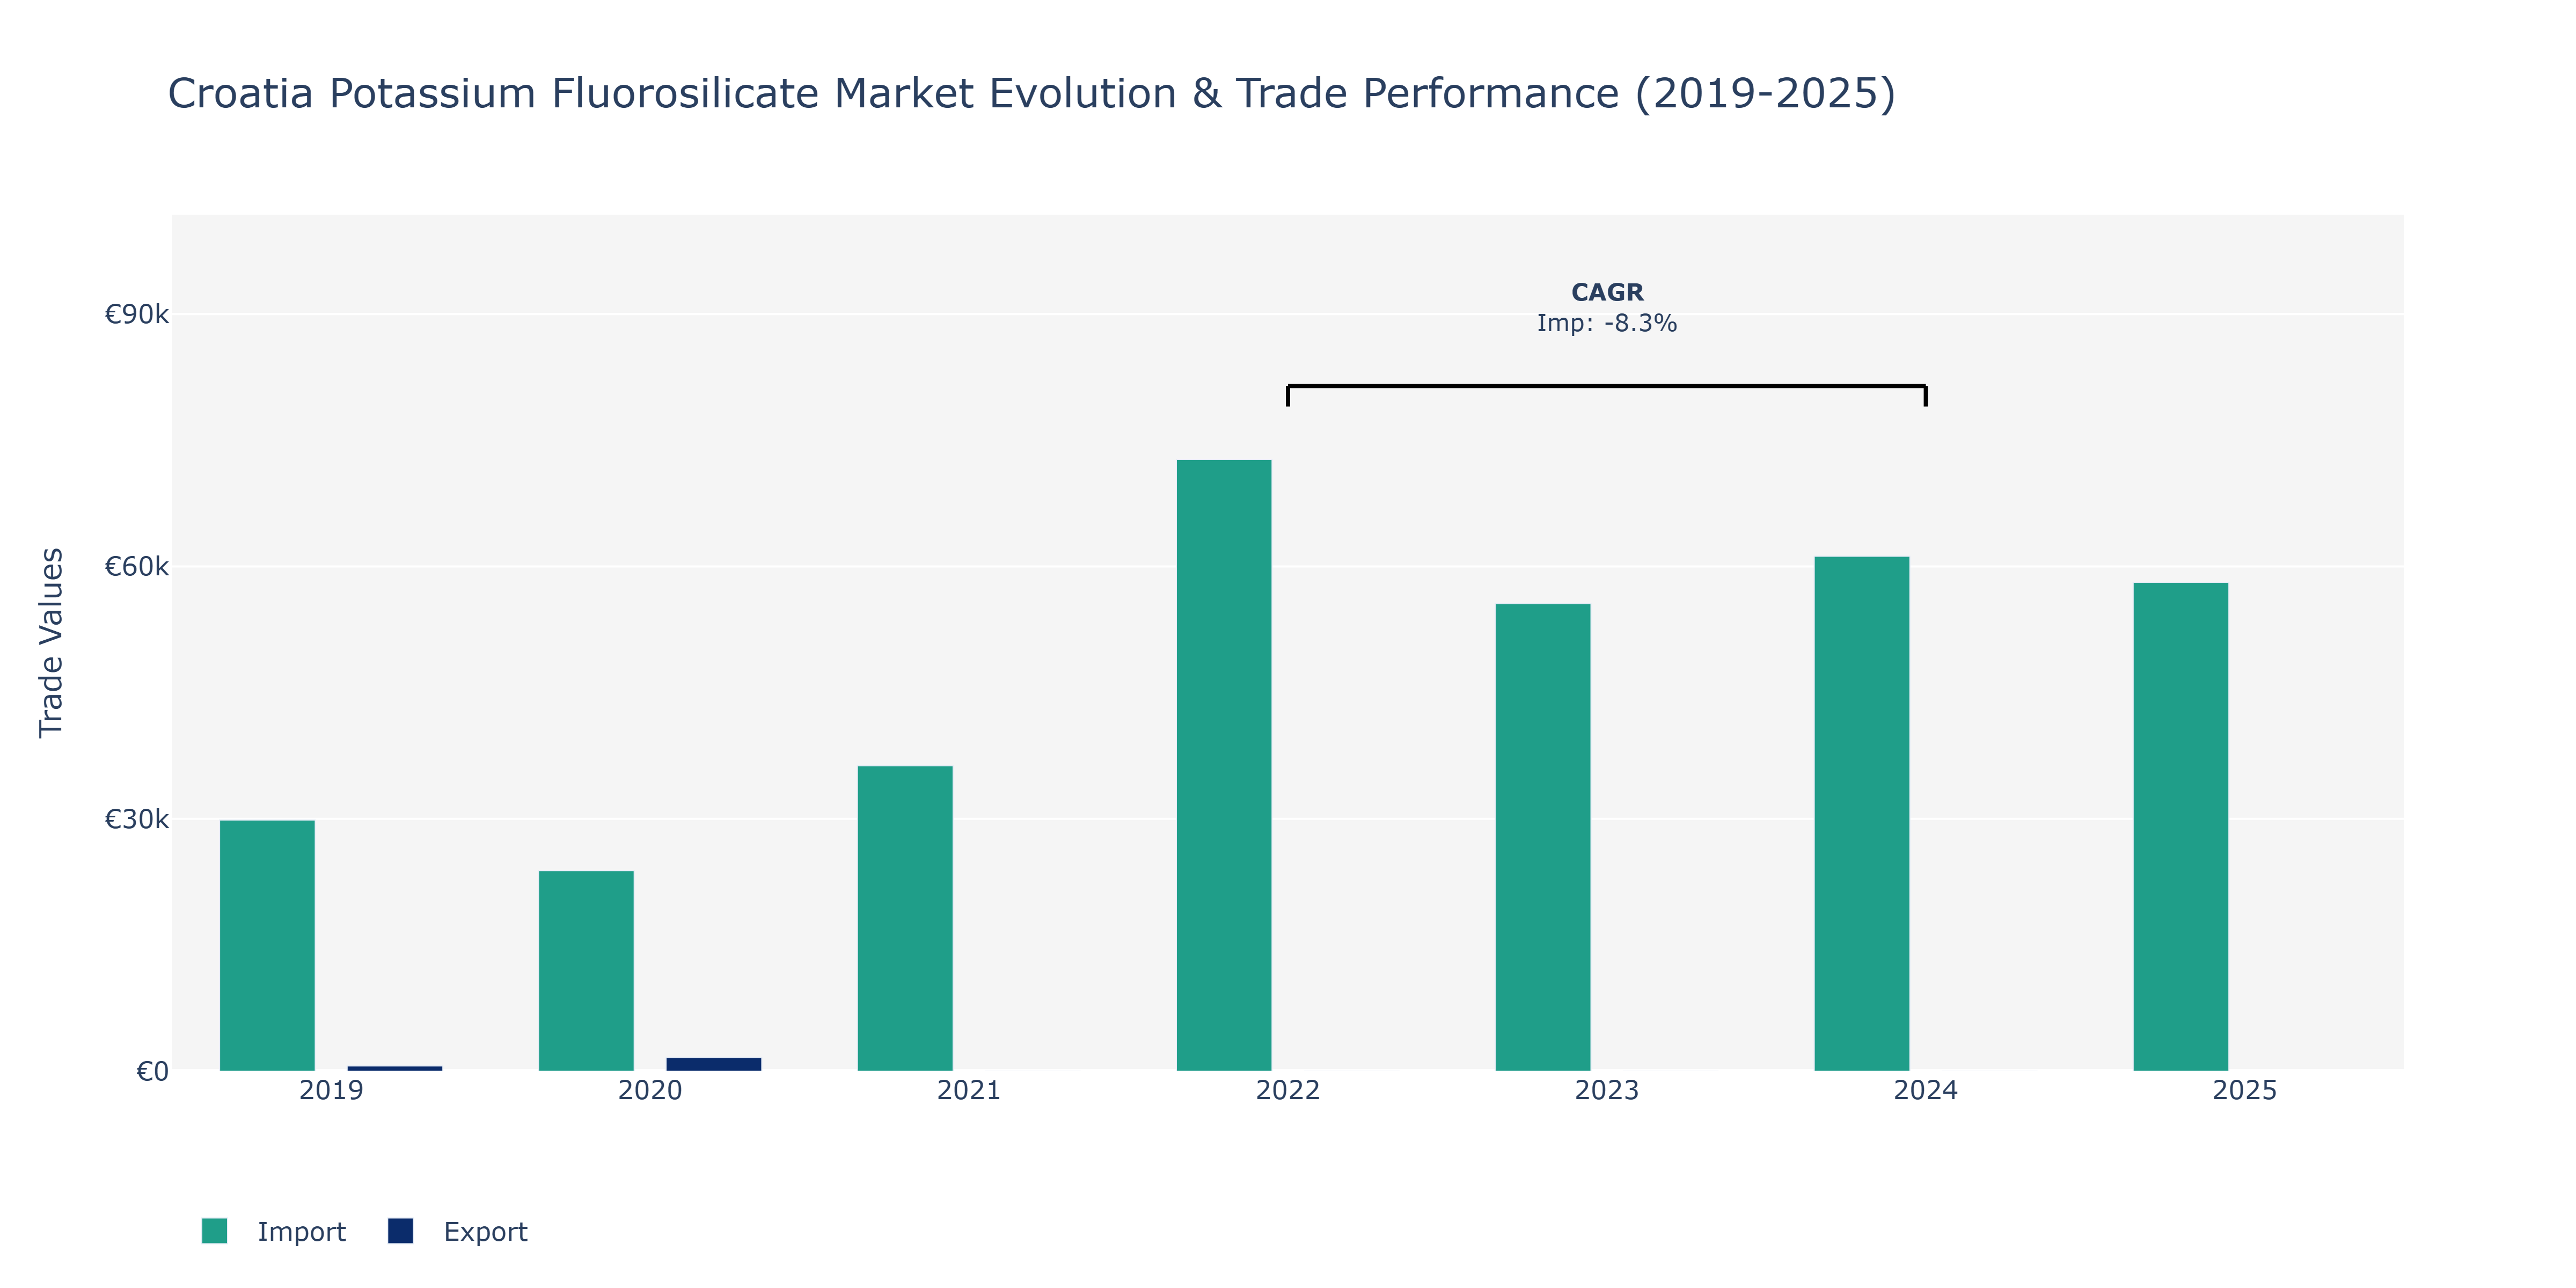
The Croatia Potassium Fluorosilicate Market witnessed notable fluctuations in both Exports and Imports from 2019 to 2025. In 2019, Exports stood at €620 million and Imports at €29.85 thousand, with Imports experiencing a sharp decrease in 2020 to €23.84 thousand while Exports increased substantially to €1.64 thousand. The year 2021 saw a significant rise in Imports to €36.3 thousand, continuing to surge in 2022 to €72.73 thousand. However, Imports then declined in the following years, reaching €55.59 thousand in 2023, €61.21 thousand in 2024, and €58.12 thousand in 2025. Such fluctuations can be attributed to various factors, including changes in global demand for potassium fluorosilicate, shifts in pricing dynamics, and regulatory developments impacting trade patterns. The rise in Exports in 2020 may reflect increased international demand for Croatian potassium fluorosilicate products, while the subsequent fluctuations in Imports could be influenced by evolving market conditions and competitive forces within the industry.
Key Highlights of the Report:
- Croatia Potassium Fluorosilicate Market Outlook
- Market Size of Croatia Potassium Fluorosilicate Market, 2025
- Forecast of Croatia Potassium Fluorosilicate Market, 2032
- Historical Data and Forecast of Croatia Potassium Fluorosilicate Revenues & Volume for the Period 2022 - 2032F
- Croatia Potassium Fluorosilicate Market Trend Evolution
- Croatia Potassium Fluorosilicate Market Drivers and Challenges
- Croatia Potassium Fluorosilicate Price Trends
- Croatia Potassium Fluorosilicate Porter`s Five Forces
- Croatia Potassium Fluorosilicate Industry Life Cycle
- Historical Data and Forecast of Croatia Potassium Fluorosilicate Market Revenues & Volume By Type for the Period 2022 - 2032F
- Historical Data and Forecast of Croatia Potassium Fluorosilicate Market Revenues & Volume By 0.98 for the Period 2022 - 2032F
- Historical Data and Forecast of Croatia Potassium Fluorosilicate Market Revenues & Volume By Other for the Period 2022 - 2032F
- Historical Data and Forecast of Croatia Potassium Fluorosilicate Market Revenues & Volume By Application for the Period 2022 - 2032F
- Historical Data and Forecast of Croatia Potassium Fluorosilicate Market Revenues & Volume By Metal industry (fluxing agents). for the Period 2022 - 2032F
- Historical Data and Forecast of Croatia Potassium Fluorosilicate Market Revenues & Volume By Glass industry (opacifying agent). for the Period 2022 - 2032F
- Historical Data and Forecast of Croatia Potassium Fluorosilicate Market Revenues & Volume By Construction industry (additive for concrete) for the Period 2022 - 2032F
- Croatia Potassium Fluorosilicate Import Export Trade Statistics
- Market Opportunity Assessment By Type
- Market Opportunity Assessment By Application
- Croatia Potassium Fluorosilicate Top Companies Market Share
- Croatia Potassium Fluorosilicate Competitive Benchmarking By Technical and Operational Parameters
- Croatia Potassium Fluorosilicate Company Profiles
- Croatia Potassium Fluorosilicate Key Strategic Recommendations
Frequently Asked Questions About the Market Study (FAQs):
6Wresearch actively monitors the Croatia Potassium Fluorosilicate Market and publishes its comprehensive annual report, highlighting emerging trends, growth drivers, revenue analysis, and forecast outlook. Our insights help businesses to make data-backed strategic decisions with ongoing market dynamics. Our analysts track relevent industries related to the Croatia Potassium Fluorosilicate Market, allowing our clients with actionable intelligence and reliable forecasts tailored to emerging regional needs.
Yes, we provide customisation as per your requirements. To learn more, feel free to contact us on sales@6wresearch.com
1 Executive Summary |
2 Introduction |
2.1 Key Highlights of the Report |
2.2 Report Description |
2.3 Market Scope & Segmentation |
2.4 Research Methodology |
2.5 Assumptions |
3 Croatia Potassium Fluorosilicate Market Overview |
3.1 Croatia Country Macro Economic Indicators |
3.2 Croatia Potassium Fluorosilicate Market Revenues & Volume, 2022 & 2032F |
3.3 Croatia Potassium Fluorosilicate Market - Industry Life Cycle |
3.4 Croatia Potassium Fluorosilicate Market - Porter's Five Forces |
3.5 Croatia Potassium Fluorosilicate Market Revenues & Volume Share, By Type, 2022 & 2032F |
3.6 Croatia Potassium Fluorosilicate Market Revenues & Volume Share, By Application, 2022 & 2032F |
4 Croatia Potassium Fluorosilicate Market Dynamics |
4.1 Impact Analysis |
4.2 Market Drivers |
4.2.1 Increasing demand for potassium fluorosilicate in the glass and ceramics industry |
4.2.2 Growth in the agriculture sector leading to higher demand for fertilizers containing potassium fluorosilicate |
4.2.3 Rising investments in research and development for innovative applications of potassium fluorosilicate |
4.3 Market Restraints |
4.3.1 Fluctuating prices of raw materials used in the production of potassium fluorosilicate |
4.3.2 Stringent regulations pertaining to environmental and occupational health and safety |
4.3.3 Competition from alternative products in the market |
5 Croatia Potassium Fluorosilicate Market Trends |
6 Croatia Potassium Fluorosilicate Market Segmentations |
6.1 Croatia Potassium Fluorosilicate Market, By Type |
6.1.1 Overview and Analysis |
6.1.2 Croatia Potassium Fluorosilicate Market Revenues & Volume, By 0.98, 2022 - 2032F |
6.1.3 Croatia Potassium Fluorosilicate Market Revenues & Volume, By Other, 2022 - 2032F |
6.2 Croatia Potassium Fluorosilicate Market, By Application |
6.2.1 Overview and Analysis |
6.2.2 Croatia Potassium Fluorosilicate Market Revenues & Volume, By Metal industry (fluxing agents)., 2022 - 2032F |
6.2.3 Croatia Potassium Fluorosilicate Market Revenues & Volume, By Glass industry (opacifying agent)., 2022 - 2032F |
6.2.4 Croatia Potassium Fluorosilicate Market Revenues & Volume, By Construction industry (additive for concrete), 2022 - 2032F |
7 Croatia Potassium Fluorosilicate Market Import-Export Trade Statistics |
7.1 Croatia Potassium Fluorosilicate Market Export to Major Countries |
7.2 Croatia Potassium Fluorosilicate Market Imports from Major Countries |
8 Croatia Potassium Fluorosilicate Market Key Performance Indicators |
8.1 Research and development investment in new potassium fluorosilicate applications |
8.2 Percentage of market share of potassium fluorosilicate in the glass and ceramics industry |
8.3 Number of patents filed for potassium fluorosilicate applications |
8.4 Adoption rate of potassium fluorosilicate-based fertilizers in the agriculture sector |
8.5 Environmental compliance metrics related to potassium fluorosilicate production |
9 Croatia Potassium Fluorosilicate Market - Opportunity Assessment |
9.1 Croatia Potassium Fluorosilicate Market Opportunity Assessment, By Type, 2022 & 2032F |
9.2 Croatia Potassium Fluorosilicate Market Opportunity Assessment, By Application, 2022 & 2032F |
10 Croatia Potassium Fluorosilicate Market - Competitive Landscape |
10.1 Croatia Potassium Fluorosilicate Market Revenue Share, By Companies, 2025 |
10.2 Croatia Potassium Fluorosilicate Market Competitive Benchmarking, By Operating and Technical Parameters |
11 Company Profiles |
12 Recommendations | 13 Disclaimer |
Global Go To Market Strategy - 2030
Export potential enables firms to identify high-growth global markets with greater confidence by combining advanced trade intelligence with a structured quantitative methodology. The framework analyzes emerging demand trends and country-level import patterns while integrating macroeconomic and trade datasets such as GDP and population forecasts, bilateral import–export flows, tariff structures, elasticity differentials between developed and developing economies, geographic distance, and import demand projections. Using weighted trade values from 2020–2024 as the base period to project country-to-country export potential for 2030, these inputs are operationalized through calculated drivers such as gravity model parameters, tariff impact factors, and projected GDP per-capita growth. Through an analysis of hidden potentials, demand hotspots, and market conditions that are most favorable to success, this method enables firms to focus on target countries, maximize returns, and global expansion with data, backed by accuracy.
By factoring in the projected importer demand gap that is currently unmet and could be potential opportunity, it identifies the potential for the Exporter (Country) among 190 countries, against the general trade analysis, which identifies the biggest importer or exporter.
To discover high-growth global markets and optimize your business strategy:
Click Here
Pricing
- Single User License$ 1,995
- Department License$ 2,400
- Site License$ 3,120
- Global License$ 3,795

Leadership Perspectives from Industry Events
Search
Thought Leadership and Analyst Meet


Our Clients
6WResearch In News
- Doha a strategic location for EV manufacturing hub: IPA Qatar
- Demand for luxury TVs surging in the GCC, says Samsung
- Empowering Growth: The Thriving Journey of Bangladesh’s Cable Industry
- Demand for luxury TVs surging in the GCC, says Samsung
- Video call with a traditional healer? Once unthinkable, it’s now common in South Africa
- Intelligent Buildings To Smooth GCC’s Path To Net Zero
Latest Reports
- New Zealand Aseptic Manufacturing Market (2026-2032)
- Netherlands Aseptic Manufacturing Market (2026-2032)
- Nauru Aseptic Manufacturing Market (2026-2032)
- Namibia Aseptic Manufacturing Market (2026-2032)
- Mozambique Aseptic Manufacturing Market (2026-2032)
- Montenegro Aseptic Manufacturing Market (2026-2032)
- Mongolia Aseptic Manufacturing Market (2026-2032)
- Monaco Aseptic Manufacturing Market (2026-2032)
- Micronesia Aseptic Manufacturing Market (2026-2032)
- Mauritius Aseptic Manufacturing Market (2026-2032)
Industry Events and Analyst Meet

HIMTEX 2026

India Refining Summit 2026

India EV Show 2026

EV tech India Expo 2026

Auto Tech Asia 2026
Whitepaper
- Middle East & Africa Commercial Security Market Click here to view more.
- Middle East & Africa Fire Safety Systems & Equipment Market Click here to view more.
- GCC Drone Market Click here to view more.
- Middle East Lighting Fixture Market Click here to view more.
- GCC Physical & Perimeter Security Market Click here to view more.