Croatia Syrups and Spread Market (2026-2032) | Industry, Share, Competitive, Size, Drivers, Forecast, Segments, Analysis, Competition, Consumer Insights, Segmentation, Growth, Revenue, Companies, Trends, Pricing Analysis, Strategic Insights, Strategy, Challenges, Supply, Demand, Value, Opportunities, Investment Trends, Restraints, Outlook
Market Forecast By Product Type (Fruit Syrups, Chocolate Spread), By Application (Beverages, Food & Beverages), By Ingredient (SugarBased, Cocoa), By Use (Flavoring, Baking) And Competitive Landscape
| Product Code: ETC10892309 | Publication Date: Apr 2025 | Updated Date: Apr 2026 | Product Type: Market Research Report | |
| Publisher: 6Wresearch | Author: Bhawna Singh | No. of Pages: 65 | No. of Figures: 34 | No. of Tables: 19 |
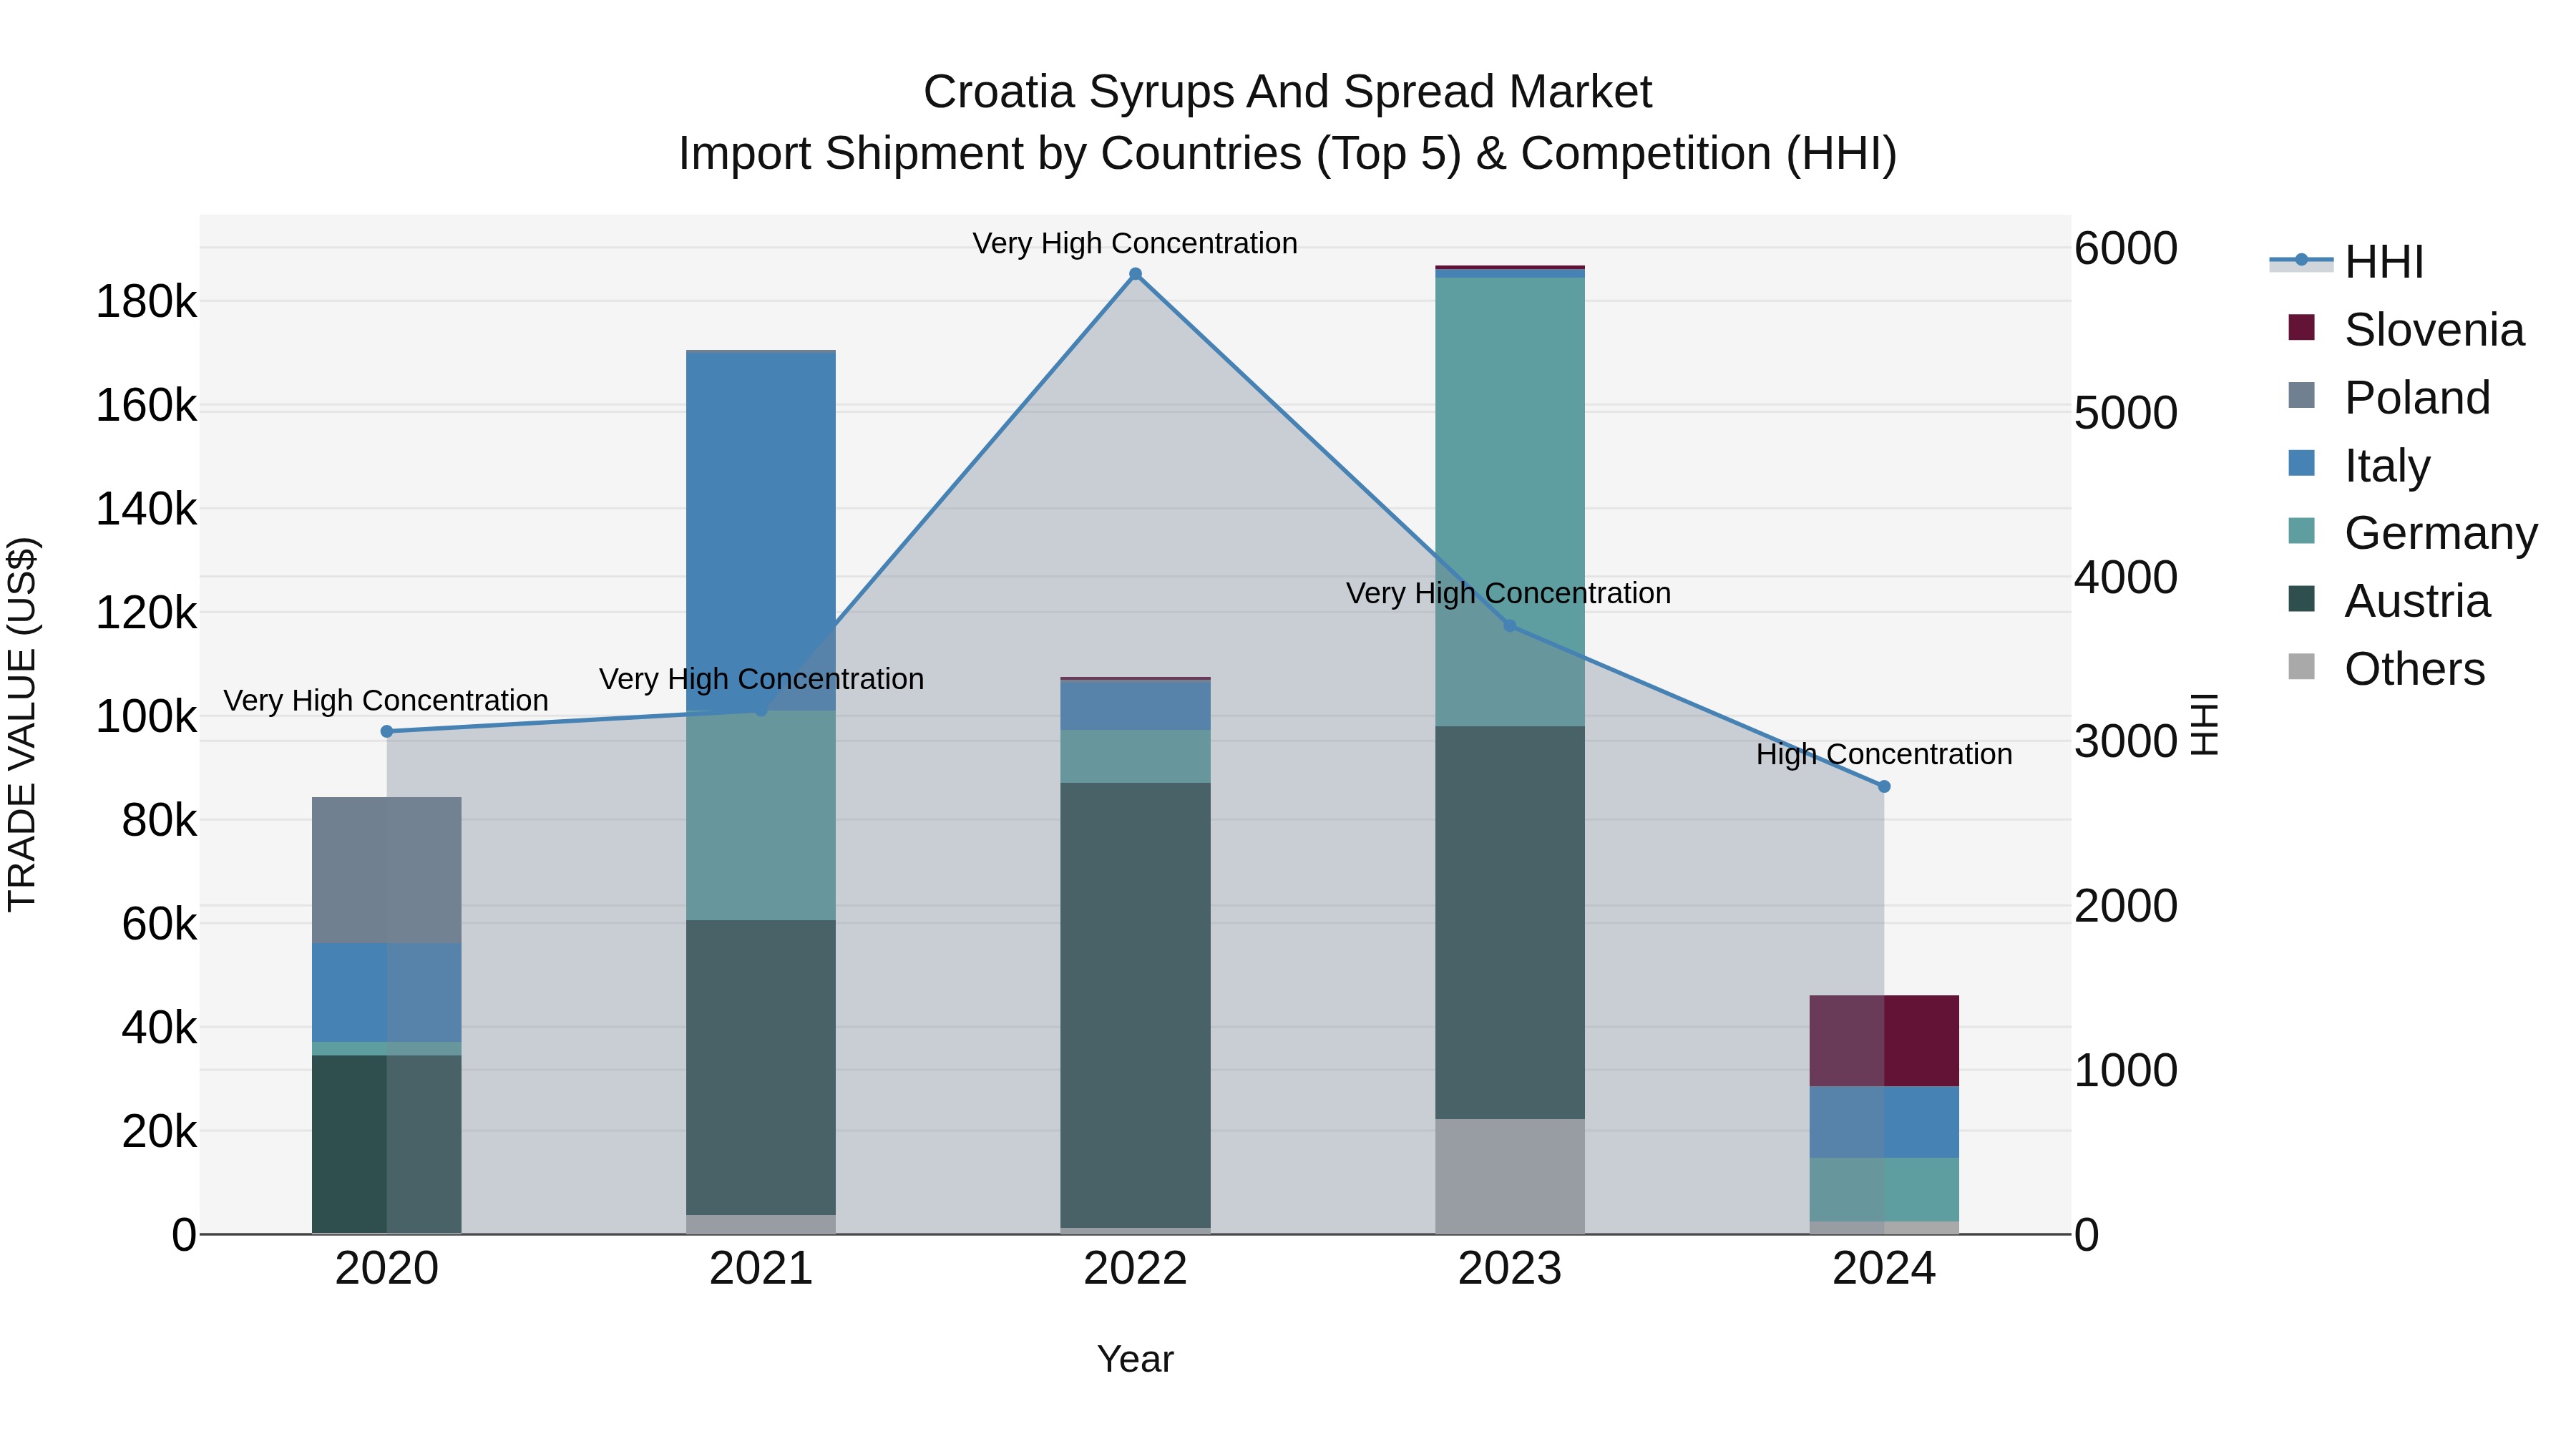
Croatia Syrups and Spread Market Top 5 Importing Countries and Market Competition (HHI) Analysis
In 2024, Croatia continued to see high concentration in syrup and spread imports, with top suppliers being Slovenia, Italy, Germany, Slovakia, and the Netherlands. Despite a concerning -14.01% CAGR from 2020 to 2024 and a sharp -75.33% growth rate in 2023-24, the market remains competitive with diverse sources. The consistent presence of key exporting countries indicates a strong market demand for quality syrups and spreads in Croatia. Monitoring trends in import shipments and exploring new market opportunities could be essential for stakeholders looking to navigate the challenging market conditions.
Key Highlights of the Report:
- Croatia Syrups and Spread Market Outlook
- Market Size of Croatia Syrups and Spread Market, 2025
- Forecast of Croatia Syrups and Spread Market, 2032
- Historical Data and Forecast of Croatia Syrups and Spread Revenues & Volume for the Period 2022 - 2032F
- Croatia Syrups and Spread Market Trend Evolution
- Croatia Syrups and Spread Market Drivers and Challenges
- Croatia Syrups and Spread Price Trends
- Croatia Syrups and Spread Porter's Five Forces
- Croatia Syrups and Spread Industry Life Cycle
- Historical Data and Forecast of Croatia Syrups and Spread Market Revenues & Volume By Product Type for the Period 2022 - 2032F
- Historical Data and Forecast of Croatia Syrups and Spread Market Revenues & Volume By Fruit Syrups for the Period 2022 - 2032F
- Historical Data and Forecast of Croatia Syrups and Spread Market Revenues & Volume By Chocolate Spread for the Period 2022 - 2032F
- Historical Data and Forecast of Croatia Syrups and Spread Market Revenues & Volume By Application for the Period 2022 - 2032F
- Historical Data and Forecast of Croatia Syrups and Spread Market Revenues & Volume By Beverages for the Period 2022 - 2032F
- Historical Data and Forecast of Croatia Syrups and Spread Market Revenues & Volume By Food & Beverages for the Period 2022 - 2032F
- Historical Data and Forecast of Croatia Syrups and Spread Market Revenues & Volume By Ingredient for the Period 2022 - 2032F
- Historical Data and Forecast of Croatia Syrups and Spread Market Revenues & Volume By SugarBased for the Period 2022 - 2032F
- Historical Data and Forecast of Croatia Syrups and Spread Market Revenues & Volume By Cocoa for the Period 2022 - 2032F
- Historical Data and Forecast of Croatia Syrups and Spread Market Revenues & Volume By Use for the Period 2022 - 2032F
- Historical Data and Forecast of Croatia Syrups and Spread Market Revenues & Volume By Flavoring for the Period 2022 - 2032F
- Historical Data and Forecast of Croatia Syrups and Spread Market Revenues & Volume By Baking for the Period 2022 - 2032F
- Croatia Syrups and Spread Import Export Trade Statistics
- Market Opportunity Assessment By Product Type
- Market Opportunity Assessment By Application
- Market Opportunity Assessment By Ingredient
- Market Opportunity Assessment By Use
- Croatia Syrups and Spread Top Companies Market Share
- Croatia Syrups and Spread Competitive Benchmarking By Technical and Operational Parameters
- Croatia Syrups and Spread Company Profiles
- Croatia Syrups and Spread Key Strategic Recommendations
Frequently Asked Questions About the Market Study (FAQs):
6Wresearch actively monitors the Croatia Syrups and Spread Market and publishes its comprehensive annual report, highlighting emerging trends, growth drivers, revenue analysis, and forecast outlook. Our insights help businesses to make data-backed strategic decisions with ongoing market dynamics. Our analysts track relevent industries related to the Croatia Syrups and Spread Market, allowing our clients with actionable intelligence and reliable forecasts tailored to emerging regional needs.
Yes, we provide customisation as per your requirements. To learn more, feel free to contact us on sales@6wresearch.com
1 Executive Summary |
2 Introduction |
2.1 Key Highlights of the Report |
2.2 Report Description |
2.3 Market Scope & Segmentation |
2.4 Research Methodology |
2.5 Assumptions |
3 Croatia Syrups and Spread Market Overview |
3.1 Croatia Country Macro Economic Indicators |
3.2 Croatia Syrups and Spread Market Revenues & Volume, 2022 & 2032F |
3.3 Croatia Syrups and Spread Market - Industry Life Cycle |
3.4 Croatia Syrups and Spread Market - Porter's Five Forces |
3.5 Croatia Syrups and Spread Market Revenues & Volume Share, By Product Type, 2022 & 2032F |
3.6 Croatia Syrups and Spread Market Revenues & Volume Share, By Application, 2022 & 2032F |
3.7 Croatia Syrups and Spread Market Revenues & Volume Share, By Ingredient, 2022 & 2032F |
3.8 Croatia Syrups and Spread Market Revenues & Volume Share, By Use, 2022 & 2032F |
4 Croatia Syrups and Spread Market Dynamics |
4.1 Impact Analysis |
4.2 Market Drivers |
4.2.1 Increasing health consciousness among consumers leading to a demand for natural and organic syrups and spreads |
4.2.2 Growing trend of home cooking and baking, driving the need for high-quality syrups and spreads |
4.2.3 Rising popularity of international cuisines influencing the demand for unique flavors and varieties in syrups and spreads |
4.3 Market Restraints |
4.3.1 Fluctuating prices of raw materials impacting production costs and pricing of syrups and spreads |
4.3.2 Intense competition from established brands and private labels affecting market penetration and pricing strategies |
5 Croatia Syrups and Spread Market Trends |
6 Croatia Syrups and Spread Market, By Types |
6.1 Croatia Syrups and Spread Market, By Product Type |
6.1.1 Overview and Analysis |
6.1.2 Croatia Syrups and Spread Market Revenues & Volume, By Product Type, 2022 - 2032F |
6.1.3 Croatia Syrups and Spread Market Revenues & Volume, By Fruit Syrups, 2022 - 2032F |
6.1.4 Croatia Syrups and Spread Market Revenues & Volume, By Chocolate Spread, 2022 - 2032F |
6.2 Croatia Syrups and Spread Market, By Application |
6.2.1 Overview and Analysis |
6.2.2 Croatia Syrups and Spread Market Revenues & Volume, By Beverages, 2022 - 2032F |
6.2.3 Croatia Syrups and Spread Market Revenues & Volume, By Food & Beverages, 2022 - 2032F |
6.3 Croatia Syrups and Spread Market, By Ingredient |
6.3.1 Overview and Analysis |
6.3.2 Croatia Syrups and Spread Market Revenues & Volume, By SugarBased, 2022 - 2032F |
6.3.3 Croatia Syrups and Spread Market Revenues & Volume, By Cocoa, 2022 - 2032F |
6.4 Croatia Syrups and Spread Market, By Use |
6.4.1 Overview and Analysis |
6.4.2 Croatia Syrups and Spread Market Revenues & Volume, By Flavoring, 2022 - 2032F |
6.4.3 Croatia Syrups and Spread Market Revenues & Volume, By Baking, 2022 - 2032F |
7 Croatia Syrups and Spread Market Import-Export Trade Statistics |
7.1 Croatia Syrups and Spread Market Export to Major Countries |
7.2 Croatia Syrups and Spread Market Imports from Major Countries |
8 Croatia Syrups and Spread Market Key Performance Indicators |
8.1 Consumer engagement on social media platforms showcasing interest and demand for new flavors and products |
8.2 Number of new product launches and innovations in the syrups and spread market indicating market growth and competitiveness |
8.3 Percentage of revenue generated from online sales channels reflecting the shift towards e-commerce and digital marketing strategies |
8.4 Customer retention rate and loyalty programs effectiveness demonstrating brand loyalty and market sustainability |
8.5 Sustainability practices adopted by companies in the production and packaging of syrups and spreads influencing consumer perception and market positioning |
9 Croatia Syrups and Spread Market - Opportunity Assessment |
9.1 Croatia Syrups and Spread Market Opportunity Assessment, By Product Type, 2022 & 2032F |
9.2 Croatia Syrups and Spread Market Opportunity Assessment, By Application, 2022 & 2032F |
9.3 Croatia Syrups and Spread Market Opportunity Assessment, By Ingredient, 2022 & 2032F |
9.4 Croatia Syrups and Spread Market Opportunity Assessment, By Use, 2022 & 2032F |
10 Croatia Syrups and Spread Market - Competitive Landscape |
10.1 Croatia Syrups and Spread Market Revenue Share, By Companies, 2025 |
10.2 Croatia Syrups and Spread Market Competitive Benchmarking, By Operating and Technical Parameters |
11 Company Profiles |
12 Recommendations |
13 Disclaimer |
Export potential assessment - trade Analytics for 2030
Export potential enables firms to identify high-growth global markets with greater confidence by combining advanced trade intelligence with a structured quantitative methodology. The framework analyzes emerging demand trends and country-level import patterns while integrating macroeconomic and trade datasets such as GDP and population forecasts, bilateral import–export flows, tariff structures, elasticity differentials between developed and developing economies, geographic distance, and import demand projections. Using weighted trade values from 2020–2024 as the base period to project country-to-country export potential for 2030, these inputs are operationalized through calculated drivers such as gravity model parameters, tariff impact factors, and projected GDP per-capita growth. Through an analysis of hidden potentials, demand hotspots, and market conditions that are most favorable to success, this method enables firms to focus on target countries, maximize returns, and global expansion with data, backed by accuracy.
By factoring in the projected importer demand gap that is currently unmet and could be potential opportunity, it identifies the potential for the Exporter (Country) among 190 countries, against the general trade analysis, which identifies the biggest importer or exporter.
To discover high-growth global markets and optimize your business strategy:
Click Here
Pricing
- Single User License$ 1,995
- Department License$ 2,400
- Site License$ 3,120
- Global License$ 3,795

Search
Thought Leadership and Analyst Meet


Our Clients
Latest Reports
- Philippines Polyhydroxybutyrate-co-Hydroxyvalerate Market (2026-2032) | Trends, Insights, Challenges, Restraints, Competition, Size, Value, Forecast, Pricing, Share, Outlook, Revenue, Investment Opportunities, Strategy, Drivers, Demand, Growth, segmentation, Analysis, Companies
- Peru Polyhydroxybutyrate-co-Hydroxyvalerate Market (2026-2032) | Growth, Demand, Challenges, Share, Trends, Analysis, Pricing, Investment Opportunities, Drivers, Value, Forecast, Competition, Size, Companies, Insights, Outlook, Restraints, segmentation, Revenue, Strategy
- Pakistan Polyhydroxybutyrate-co-Hydroxyvalerate Market (2026-2032) | Restraints, segmentation, Pricing, Forecast, Share, Strategy, Competition, Trends, Insights, Drivers, Challenges, Growth, Revenue, Outlook, Value, Investment Opportunities, Companies, Size, Analysis, Demand
- Oman Polyhydroxybutyrate-co-Hydroxyvalerate Market (2026-2032) | Drivers, segmentation, Insights, Competition, Pricing, Outlook, Size, Revenue, Challenges, Forecast, Analysis, Growth, Value, Share, Trends, Investment Opportunities, Strategy, Restraints, Companies, Demand
- Nigeria Polyhydroxybutyrate-co-Hydroxyvalerate Market (2026-2032) | Value, Investment Opportunities, Analysis, Revenue, Restraints, Pricing, Outlook, Competition, Demand, Growth, Forecast, Companies, Trends, Challenges, segmentation, Drivers, Insights, Share, Size, Strategy
- Nepal Polyhydroxybutyrate-co-Hydroxyvalerate Market (2026-2032) | Insights, Analysis, Drivers, Share, Revenue, Demand, segmentation, Investment Opportunities, Competition, Forecast, Growth, Pricing, Companies, Strategy, Trends, Restraints, Challenges, Outlook, Size, Value
- Myanmar Polyhydroxybutyrate-co-Hydroxyvalerate Market (2026-2032) | Outlook, Revenue, Strategy, Restraints, Drivers, segmentation, Share, Forecast, Competition, Insights, Growth, Pricing, Size, Demand, Value, Companies, Trends, Challenges, Investment Opportunities, Analysis
- Morocco Polyhydroxybutyrate-co-Hydroxyvalerate Market (2026-2032) | Outlook, Investment Opportunities, Restraints, Strategy, Forecast, Challenges, Drivers, Growth, Companies, segmentation, Trends, Size, Competition, Revenue, Demand, Insights, Share, Analysis, Value, Pricing
- Mexico Polyhydroxybutyrate-co-Hydroxyvalerate Market (2026-2032) | Size, Drivers, Outlook, Share, Strategy, Growth, Pricing, Challenges, Companies, Demand, Value, Investment Opportunities, Restraints, Trends, Forecast, segmentation, Analysis, Insights, Competition, Revenue
- Malaysia Polyhydroxybutyrate-co-Hydroxyvalerate Market (2026-2032) | Share, segmentation, Size, Companies, Analysis, Insights, Forecast, Value, Revenue, Drivers, Restraints, Challenges, Investment Opportunities, Trends, Competition, Strategy, Demand, Growth, Outlook, Pricing
Industry Events and Analyst Meet

HIMTEX 2026

India Refining Summit 2026

India EV Show 2026

EV tech India Expo 2026

Auto Tech Asia 2026
Whitepaper
- Middle East & Africa Commercial Security Market Click here to view more.
- Middle East & Africa Fire Safety Systems & Equipment Market Click here to view more.
- GCC Drone Market Click here to view more.
- Middle East Lighting Fixture Market Click here to view more.
- GCC Physical & Perimeter Security Market Click here to view more.
6WResearch In News
- Doha a strategic location for EV manufacturing hub: IPA Qatar
- Demand for luxury TVs surging in the GCC, says Samsung
- Empowering Growth: The Thriving Journey of Bangladesh’s Cable Industry
- Demand for luxury TVs surging in the GCC, says Samsung
- Video call with a traditional healer? Once unthinkable, it’s now common in South Africa
- Intelligent Buildings To Smooth GCC’s Path To Net Zero