Croatia Tea Market (2026-2032) | Revenue, Growth, Forecast, Share, Size, Value, Industry, Outlook, Segmentation, Analysis, Trends & Companies
Market Forecast By Type (Green Tea, Black Tea, Oolong Tea, Fruit/Herbal Tea, Others), By Packaging (Plastic Containers, Loose Tea, Paperboards, Aluminum Tins, Tea Bags), By Distribution Channel (Supermarkets/Hypermarkets, Specialty Stores, Convenience Stores, Online Stores, Others), By Application (Residential, Commercial) And Competitive Landscape
| Product Code: ETC4842685 | Publication Date: Nov 2023 | Updated Date: Apr 2026 | Product Type: Market Research Report | |
| Publisher: 6Wresearch | Author: Shubham Padhi | No. of Pages: 60 | No. of Figures: 30 | No. of Tables: 5 |
Croatia Tea Market Size (2020-2030)
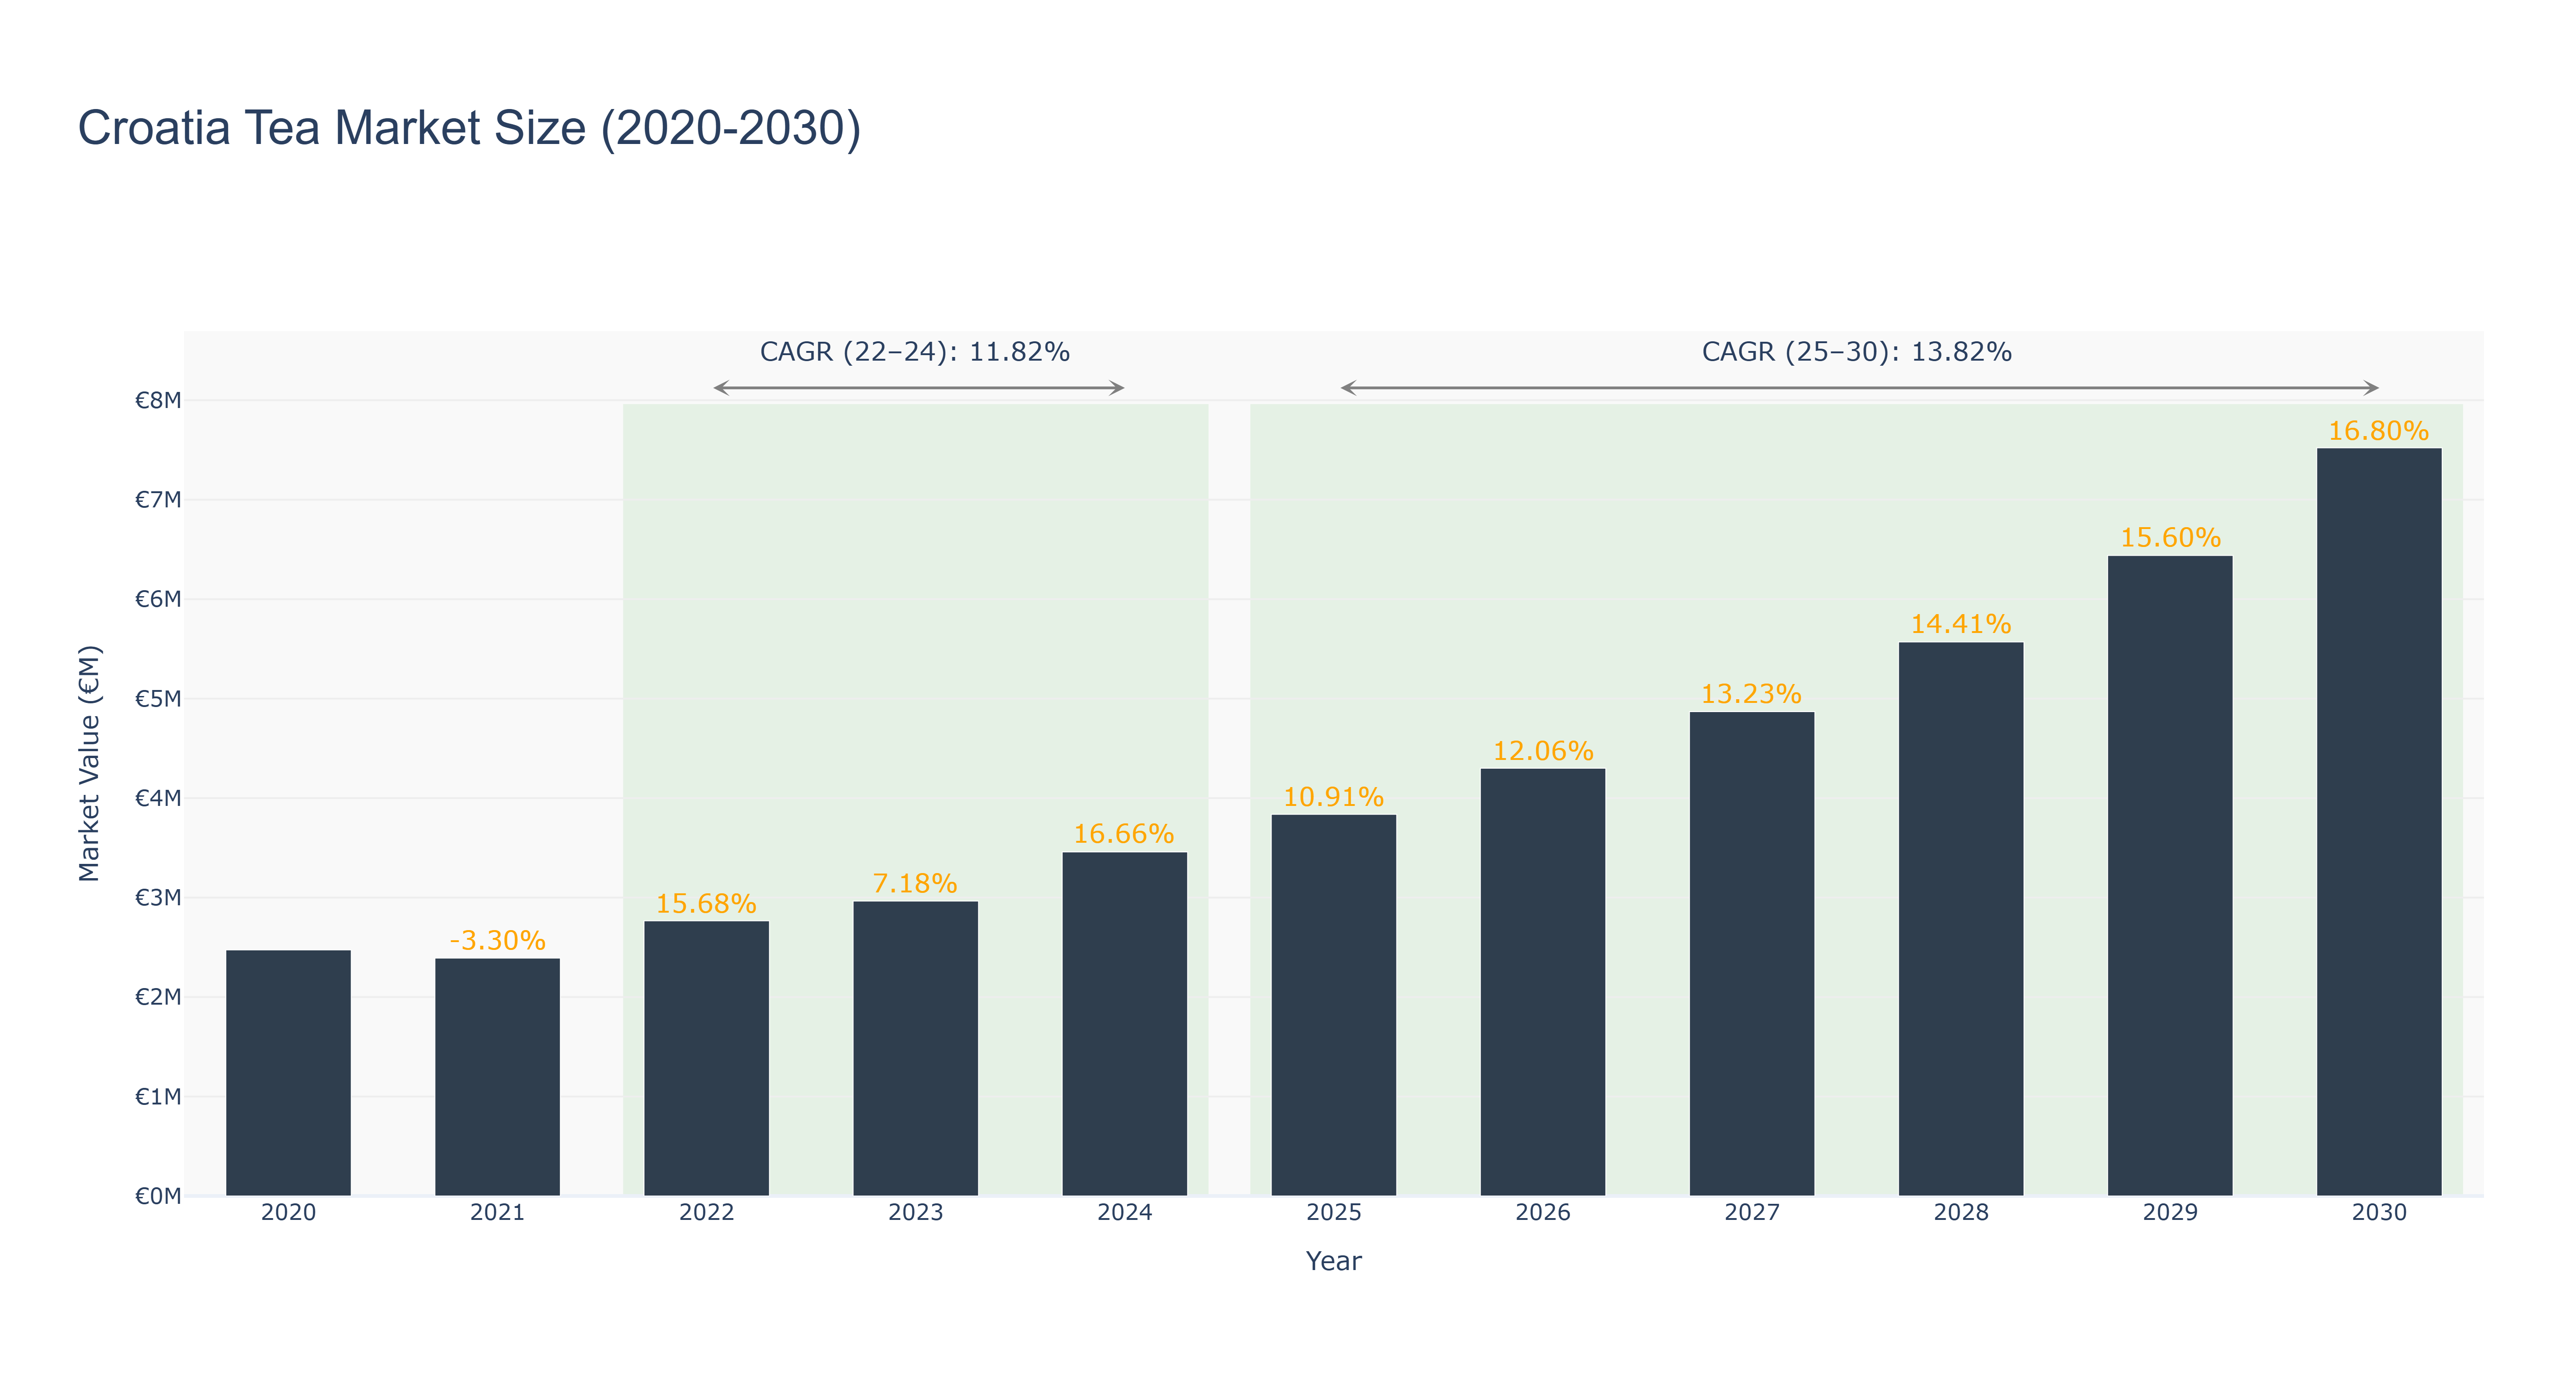
Croatia Tea Market has shown a steady growth trajectory over the years. The peak market size of €7.52 million is forecasted for 2030, with a notable increase in market size from €2.47 million in 2020 to €3.46 million in 2024. The market is expected to continue its upward trend, with a projected size of €4.30 million in 2026. The CAGR for the period 2022-24 stands at 11.82%, reflecting a strong growth phase, while the CAGR for 2025-30 is estimated at 13.82%. Industry drivers fueling this growth include increasing consumer awareness of health benefits associated with tea consumption and a growing trend towards premium and specialty teas. Looking ahead, Croatia is set to introduce sustainable tea farming practices to meet the rising demand for organic and ethically sourced teas, positioning itself as a key player in the European tea market.
Croatia Tea Market: Production & Trade Performance (2019-2025)
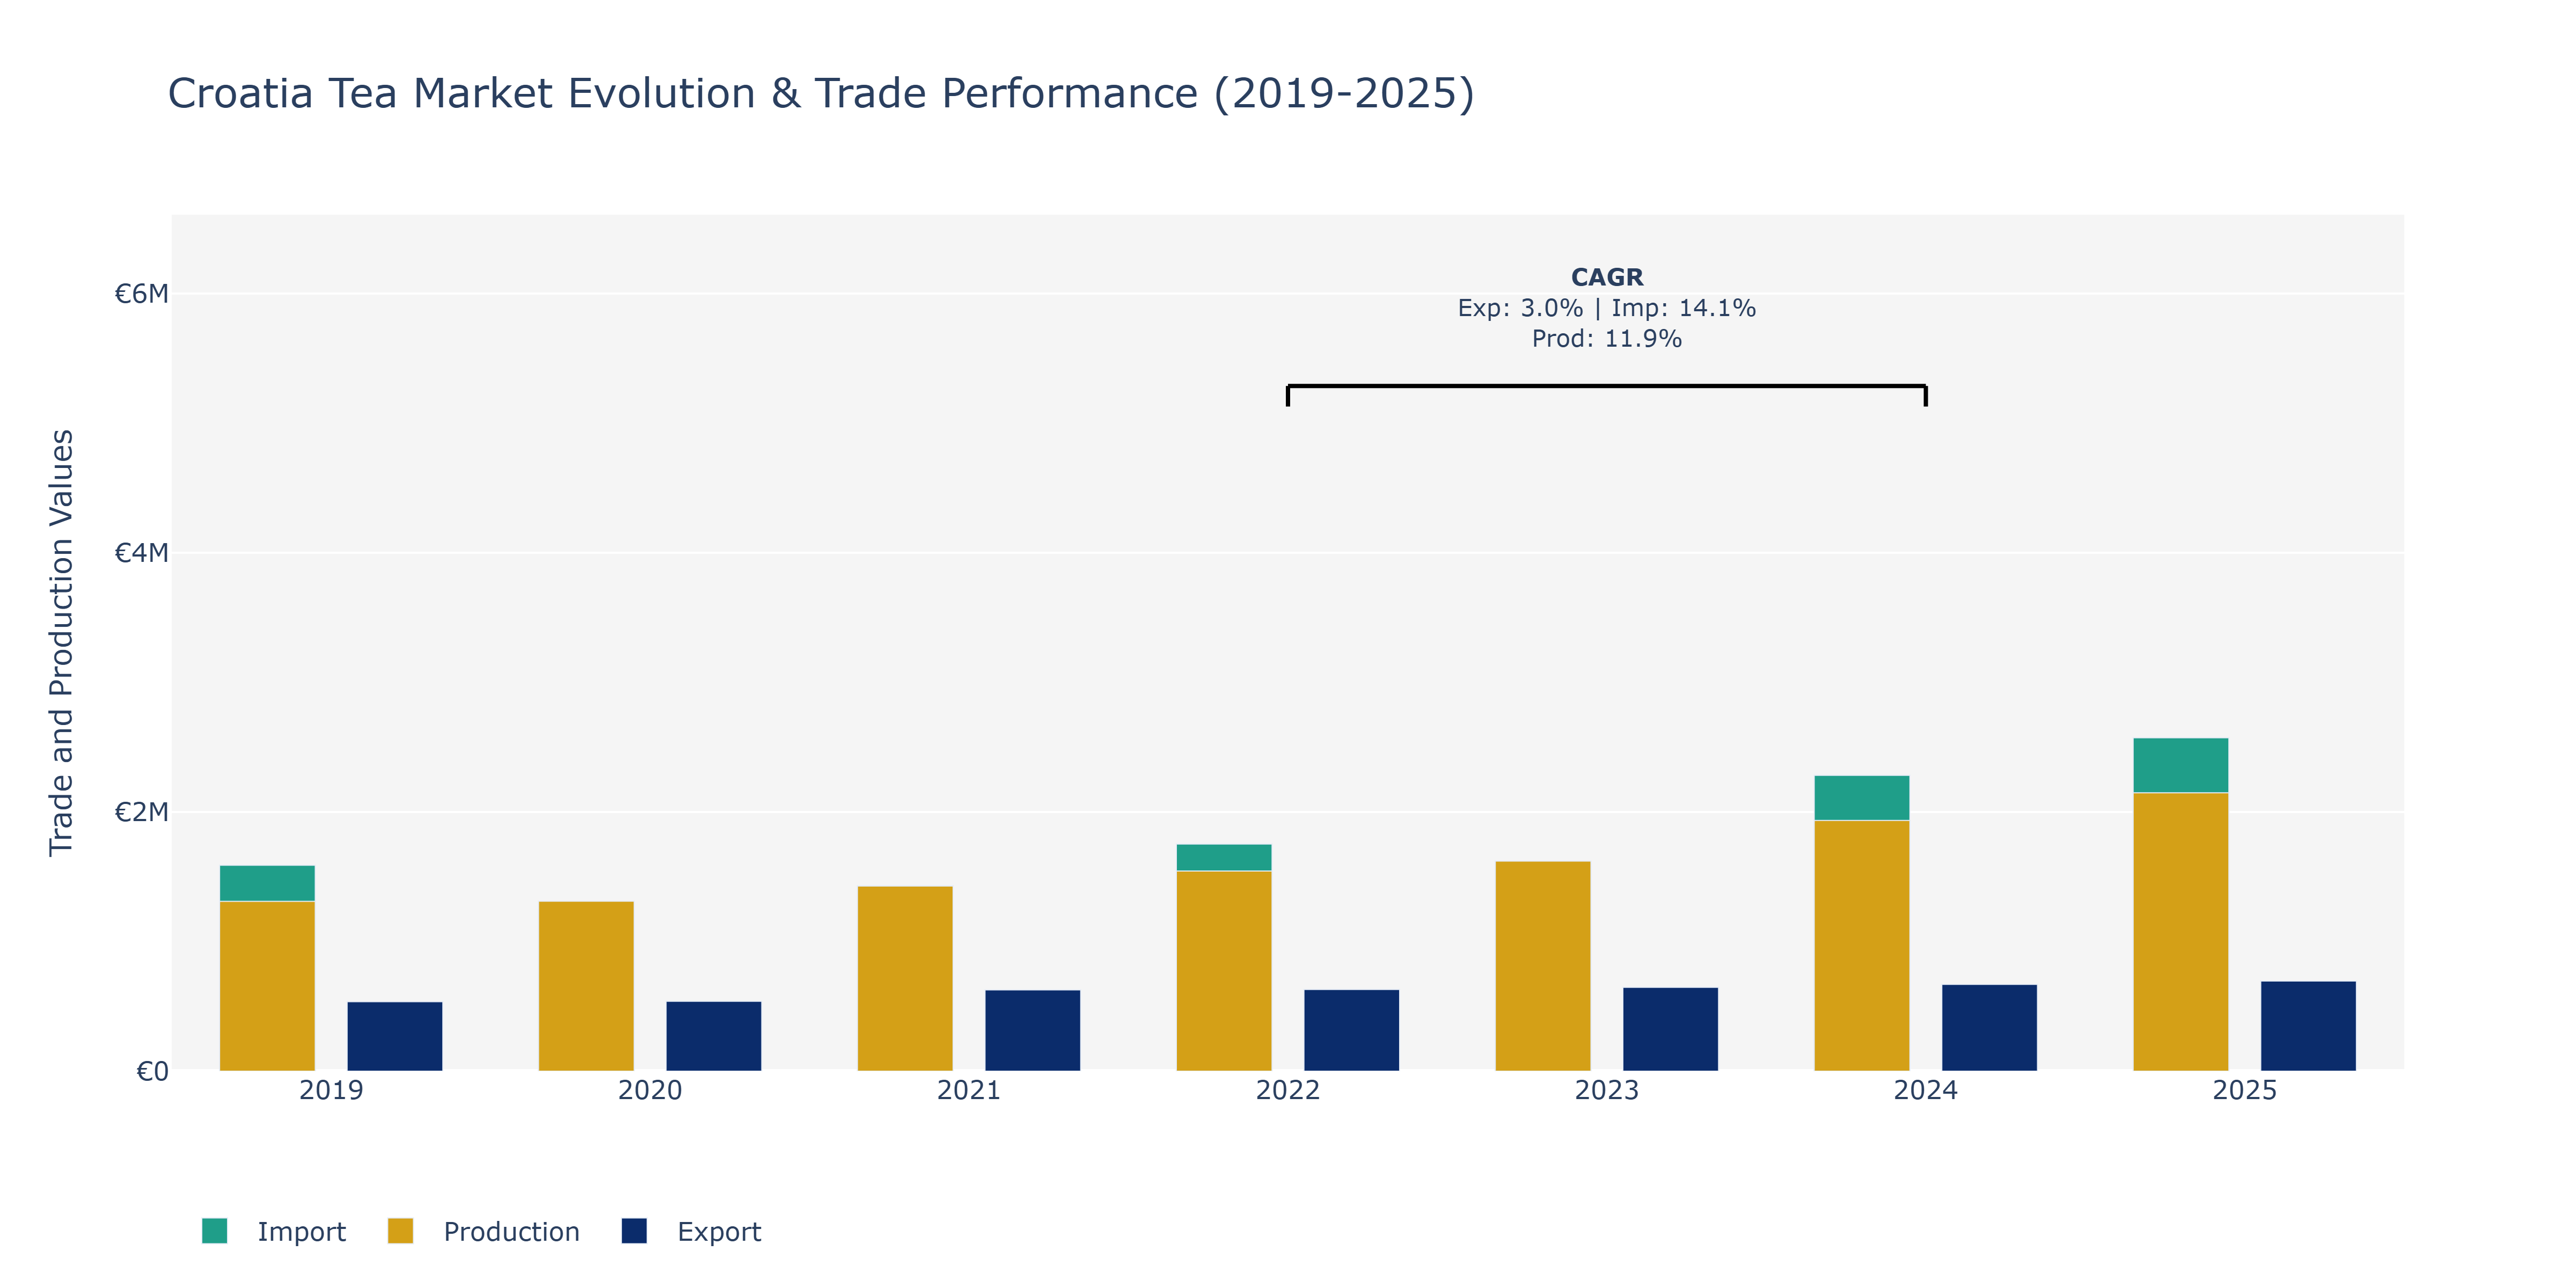
In the Croatia Tea Market, from 2019 to 2025, exports showed steady growth, starting at €536.12 thousand in 2019 and reaching €695.97 thousand in 2025. Imports experienced fluctuations, with a peak of €2.28 million in 2024. Production also demonstrated an upward trend, increasing from €1.31 million in 2019 to €2.15 million in 2025. The increase in exports can be attributed to the growing global demand for specialty teas and Croatia's reputation for high-quality tea products. Fluctuations in imports might be due to currency exchange rates and geopolitical factors affecting trade agreements. The rise in production reflects the country's investment in modernizing tea processing facilities and improving agricultural practices to boost yield. The CAGR from 2022 to 2024 highlights the market's growth potential, signaling opportunities for market players to capitalize on the increasing demand for Croatian tea products.
Key Highlights of the Report:
- Croatia Tea Market Outlook
- Market Size of Croatia Tea Market, 2025
- Forecast of Croatia Tea Market, 2032
- Historical Data and Forecast of Croatia Tea Revenues & Volume for the Period 2022 - 2032F
- Croatia Tea Market Trend Evolution
- Croatia Tea Market Drivers and Challenges
- Croatia Tea Price Trends
- Croatia Tea Porter`s Five Forces
- Croatia Tea Industry Life Cycle
- Historical Data and Forecast of Croatia Tea Market Revenues & Volume By Type for the Period 2022 - 2032F
- Historical Data and Forecast of Croatia Tea Market Revenues & Volume By Green Tea for the Period 2022 - 2032F
- Historical Data and Forecast of Croatia Tea Market Revenues & Volume By Black Tea for the Period 2022 - 2032F
- Historical Data and Forecast of Croatia Tea Market Revenues & Volume By Oolong Tea for the Period 2022 - 2032F
- Historical Data and Forecast of Croatia Tea Market Revenues & Volume By Fruit/Herbal Tea for the Period 2022 - 2032F
- Historical Data and Forecast of Croatia Tea Market Revenues & Volume By Others for the Period 2022 - 2032F
- Historical Data and Forecast of Croatia Tea Market Revenues & Volume By Packaging for the Period 2022 - 2032F
- Historical Data and Forecast of Croatia Tea Market Revenues & Volume By Plastic Containers for the Period 2022 - 2032F
- Historical Data and Forecast of Croatia Tea Market Revenues & Volume By Loose Tea for the Period 2022 - 2032F
- Historical Data and Forecast of Croatia Tea Market Revenues & Volume By Paperboards for the Period 2022 - 2032F
- Historical Data and Forecast of Croatia Tea Market Revenues & Volume By Aluminum Tins for the Period 2022 - 2032F
- Historical Data and Forecast of Croatia Tea Market Revenues & Volume By Tea Bags for the Period 2022 - 2032F
- Historical Data and Forecast of Croatia Tea Market Revenues & Volume By Distribution Channel for the Period 2022 - 2032F
- Historical Data and Forecast of Croatia Tea Market Revenues & Volume By Supermarkets/Hypermarkets for the Period 2022 - 2032F
- Historical Data and Forecast of Croatia Tea Market Revenues & Volume By Specialty Stores for the Period 2022 - 2032F
- Historical Data and Forecast of Croatia Tea Market Revenues & Volume By Convenience Stores for the Period 2022 - 2032F
- Historical Data and Forecast of Croatia Tea Market Revenues & Volume By Online Stores for the Period 2022 - 2032F
- Historical Data and Forecast of Croatia Tea Market Revenues & Volume By Others for the Period 2022 - 2032F
- Historical Data and Forecast of Croatia Tea Market Revenues & Volume By Application for the Period 2022 - 2032F
- Historical Data and Forecast of Croatia Tea Market Revenues & Volume By Residential for the Period 2022 - 2032F
- Historical Data and Forecast of Croatia Tea Market Revenues & Volume By Commercial for the Period 2022 - 2032F
- Croatia Tea Import Export Trade Statistics
- Market Opportunity Assessment By Type
- Market Opportunity Assessment By Packaging
- Market Opportunity Assessment By Distribution Channel
- Market Opportunity Assessment By Application
- Croatia Tea Top Companies Market Share
- Croatia Tea Competitive Benchmarking By Technical and Operational Parameters
- Croatia Tea Company Profiles
- Croatia Tea Key Strategic Recommendations
Frequently Asked Questions About the Market Study (FAQs):
6Wresearch actively monitors the Croatia Tea Market and publishes its comprehensive annual report, highlighting emerging trends, growth drivers, revenue analysis, and forecast outlook. Our insights help businesses to make data-backed strategic decisions with ongoing market dynamics. Our analysts track relevent industries related to the Croatia Tea Market, allowing our clients with actionable intelligence and reliable forecasts tailored to emerging regional needs.
Yes, we provide customisation as per your requirements. To learn more, feel free to contact us on sales@6wresearch.com
1 Executive Summary |
2 Introduction |
2.1 Key Highlights of the Report |
2.2 Report Description |
2.3 Market Scope & Segmentation |
2.4 Research Methodology |
2.5 Assumptions |
3 Croatia Tea Market Overview |
3.1 Croatia Country Macro Economic Indicators |
3.2 Croatia Tea Market Revenues & Volume, 2022 & 2032F |
3.3 Croatia Tea Market - Industry Life Cycle |
3.4 Croatia Tea Market - Porter's Five Forces |
3.5 Croatia Tea Market Revenues & Volume Share, By Type, 2022 & 2032F |
3.6 Croatia Tea Market Revenues & Volume Share, By Packaging, 2022 & 2032F |
3.7 Croatia Tea Market Revenues & Volume Share, By Distribution Channel, 2022 & 2032F |
3.8 Croatia Tea Market Revenues & Volume Share, By Application, 2022 & 2032F |
4 Croatia Tea Market Dynamics |
4.1 Impact Analysis |
4.2 Market Drivers |
4.2.1 Increasing health consciousness among consumers |
4.2.2 Growing demand for herbal and organic teas |
4.2.3 Rising popularity of tea as a social and cultural beverage in Croatia |
4.3 Market Restraints |
4.3.1 Seasonal fluctuations affecting tea consumption |
4.3.2 Competition from other beverage categories like coffee and soft drinks |
4.3.3 High import tariffs on tea impacting prices and availability |
5 Croatia Tea Market Trends |
6 Croatia Tea Market Segmentations |
6.1 Croatia Tea Market, By Type |
6.1.1 Overview and Analysis |
6.1.2 Croatia Tea Market Revenues & Volume, By Green Tea, 2022 - 2032F |
6.1.3 Croatia Tea Market Revenues & Volume, By Black Tea, 2022 - 2032F |
6.1.4 Croatia Tea Market Revenues & Volume, By Oolong Tea, 2022 - 2032F |
6.1.5 Croatia Tea Market Revenues & Volume, By Fruit/Herbal Tea, 2022 - 2032F |
6.1.6 Croatia Tea Market Revenues & Volume, By Others, 2022 - 2032F |
6.2 Croatia Tea Market, By Packaging |
6.2.1 Overview and Analysis |
6.2.2 Croatia Tea Market Revenues & Volume, By Plastic Containers, 2022 - 2032F |
6.2.3 Croatia Tea Market Revenues & Volume, By Loose Tea, 2022 - 2032F |
6.2.4 Croatia Tea Market Revenues & Volume, By Paperboards, 2022 - 2032F |
6.2.5 Croatia Tea Market Revenues & Volume, By Aluminum Tins, 2022 - 2032F |
6.2.6 Croatia Tea Market Revenues & Volume, By Tea Bags, 2022 - 2032F |
6.3 Croatia Tea Market, By Distribution Channel |
6.3.1 Overview and Analysis |
6.3.2 Croatia Tea Market Revenues & Volume, By Supermarkets/Hypermarkets, 2022 - 2032F |
6.3.3 Croatia Tea Market Revenues & Volume, By Specialty Stores, 2022 - 2032F |
6.3.4 Croatia Tea Market Revenues & Volume, By Convenience Stores, 2022 - 2032F |
6.3.5 Croatia Tea Market Revenues & Volume, By Online Stores, 2022 - 2032F |
6.3.6 Croatia Tea Market Revenues & Volume, By Others, 2022 - 2032F |
6.4 Croatia Tea Market, By Application |
6.4.1 Overview and Analysis |
6.4.2 Croatia Tea Market Revenues & Volume, By Residential, 2022 - 2032F |
6.4.3 Croatia Tea Market Revenues & Volume, By Commercial, 2022 - 2032F |
7 Croatia Tea Market Import-Export Trade Statistics |
7.1 Croatia Tea Market Export to Major Countries |
7.2 Croatia Tea Market Imports from Major Countries |
8 Croatia Tea Market Key Performance Indicators |
8.1 Consumer engagement on social media platforms for tea brands |
8.2 Number of new product launches in the tea market |
8.3 Percentage of tea sales from online channels |
9 Croatia Tea Market - Opportunity Assessment |
9.1 Croatia Tea Market Opportunity Assessment, By Type, 2022 & 2032F |
9.2 Croatia Tea Market Opportunity Assessment, By Packaging, 2022 & 2032F |
9.3 Croatia Tea Market Opportunity Assessment, By Distribution Channel, 2022 & 2032F |
9.4 Croatia Tea Market Opportunity Assessment, By Application, 2022 & 2032F |
10 Croatia Tea Market - Competitive Landscape |
10.1 Croatia Tea Market Revenue Share, By Companies, 2025 |
10.2 Croatia Tea Market Competitive Benchmarking, By Operating and Technical Parameters |
11 Company Profiles |
12 Recommendations | 13 Disclaimer |
Global Go To Market Strategy - 2030
Export potential enables firms to identify high-growth global markets with greater confidence by combining advanced trade intelligence with a structured quantitative methodology. The framework analyzes emerging demand trends and country-level import patterns while integrating macroeconomic and trade datasets such as GDP and population forecasts, bilateral import–export flows, tariff structures, elasticity differentials between developed and developing economies, geographic distance, and import demand projections. Using weighted trade values from 2020–2024 as the base period to project country-to-country export potential for 2030, these inputs are operationalized through calculated drivers such as gravity model parameters, tariff impact factors, and projected GDP per-capita growth. Through an analysis of hidden potentials, demand hotspots, and market conditions that are most favorable to success, this method enables firms to focus on target countries, maximize returns, and global expansion with data, backed by accuracy.
By factoring in the projected importer demand gap that is currently unmet and could be potential opportunity, it identifies the potential for the Exporter (Country) among 190 countries, against the general trade analysis, which identifies the biggest importer or exporter.
To discover high-growth global markets and optimize your business strategy:
Click Here
Pricing
- Single User License$ 1,995
- Department License$ 2,400
- Site License$ 3,120
- Global License$ 3,795

Leadership Perspectives from Industry Events
Search
Thought Leadership and Analyst Meet


Our Clients
6WResearch In News
- Doha a strategic location for EV manufacturing hub: IPA Qatar
- Demand for luxury TVs surging in the GCC, says Samsung
- Empowering Growth: The Thriving Journey of Bangladesh’s Cable Industry
- Demand for luxury TVs surging in the GCC, says Samsung
- Video call with a traditional healer? Once unthinkable, it’s now common in South Africa
- Intelligent Buildings To Smooth GCC’s Path To Net Zero
Latest Reports
- New Zealand Aseptic Manufacturing Market (2026-2032)
- Netherlands Aseptic Manufacturing Market (2026-2032)
- Nauru Aseptic Manufacturing Market (2026-2032)
- Namibia Aseptic Manufacturing Market (2026-2032)
- Mozambique Aseptic Manufacturing Market (2026-2032)
- Montenegro Aseptic Manufacturing Market (2026-2032)
- Mongolia Aseptic Manufacturing Market (2026-2032)
- Monaco Aseptic Manufacturing Market (2026-2032)
- Micronesia Aseptic Manufacturing Market (2026-2032)
- Mauritius Aseptic Manufacturing Market (2026-2032)
Industry Events and Analyst Meet

HIMTEX 2026

India Refining Summit 2026

India EV Show 2026

EV tech India Expo 2026

Auto Tech Asia 2026
Whitepaper
- Middle East & Africa Commercial Security Market Click here to view more.
- Middle East & Africa Fire Safety Systems & Equipment Market Click here to view more.
- GCC Drone Market Click here to view more.
- Middle East Lighting Fixture Market Click here to view more.
- GCC Physical & Perimeter Security Market Click here to view more.