Cyprus After Sun Care Products Market (2025-2031) | Share, Size, Companies, Revenue, Growth, Analysis, Segmentation, Outlook, Value, Industry, Trends & Forecast
Market Forecast By Type (Mass, Premium), By Product (Lotion, Cream, Gel, Others), By Distribution Channel (Hypermarkets & Supermarkets, Specialty Stores, E-commerce, Others) And Competitive Landscape
| Product Code: ETC5240357 | Publication Date: Nov 2023 | Updated Date: Apr 2026 | Product Type: Market Research Report | |
| Publisher: 6Wresearch | Author: Shubham Padhi | No. of Pages: 60 | No. of Figures: 30 | No. of Tables: 5 |
Cyprus After Sun Care Products Market Size (2020-2030)
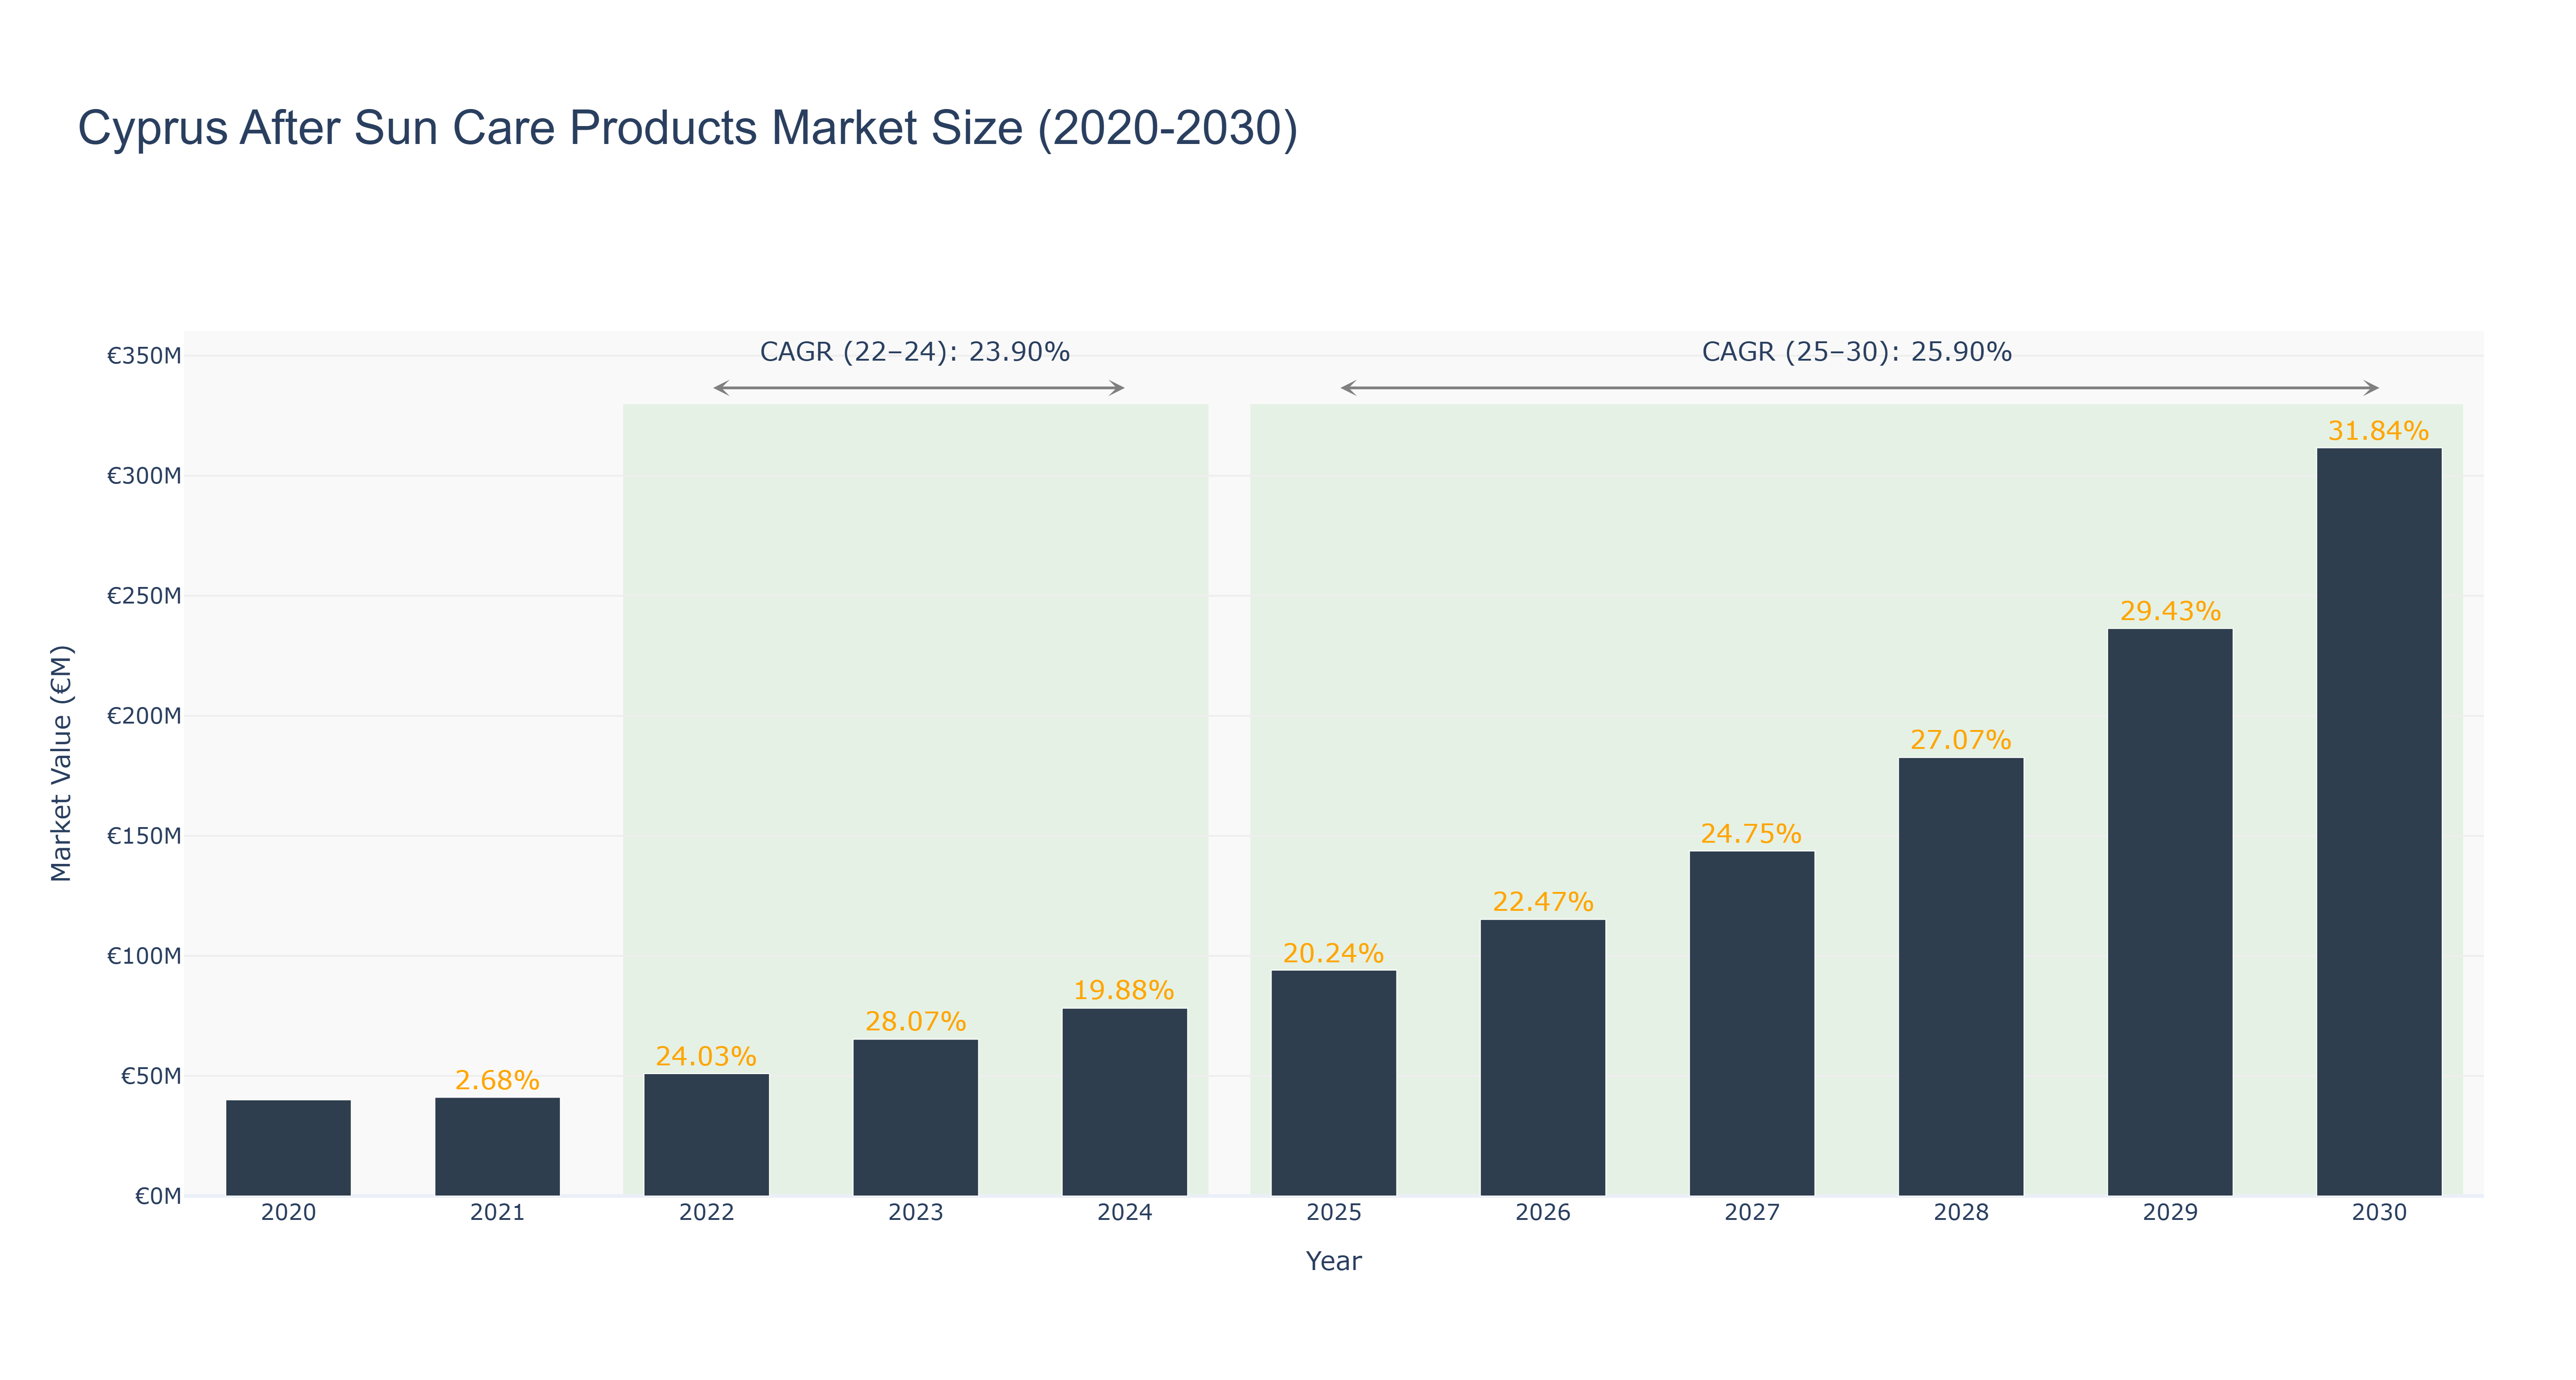
The Cyprus After Sun Care Products Market has shown a positive growth trend over the years. The peak market size of €311.65 million is forecasted for 2030, with significant growth observed from 2020 to 2024, reaching €78.24 million in 2024. The market is expected to continue its upward trajectory, with a CAGR of 23.90% from 2022 to 2024 and 25.90% from 2025 to 2030. The market's growth can be attributed to increasing awareness of skincare, rising disposable incomes, and a growing tourism sector in Cyprus. Recent developments in the market include the introduction of innovative sun care products with advanced formulations to cater to evolving consumer preferences. Future projects may focus on sustainable packaging solutions and enhanced UV protection technologies to meet the changing regulatory landscape and consumer demands.
Cyprus After Sun Care Products Market: Production & Trade Performance (2019-2025)
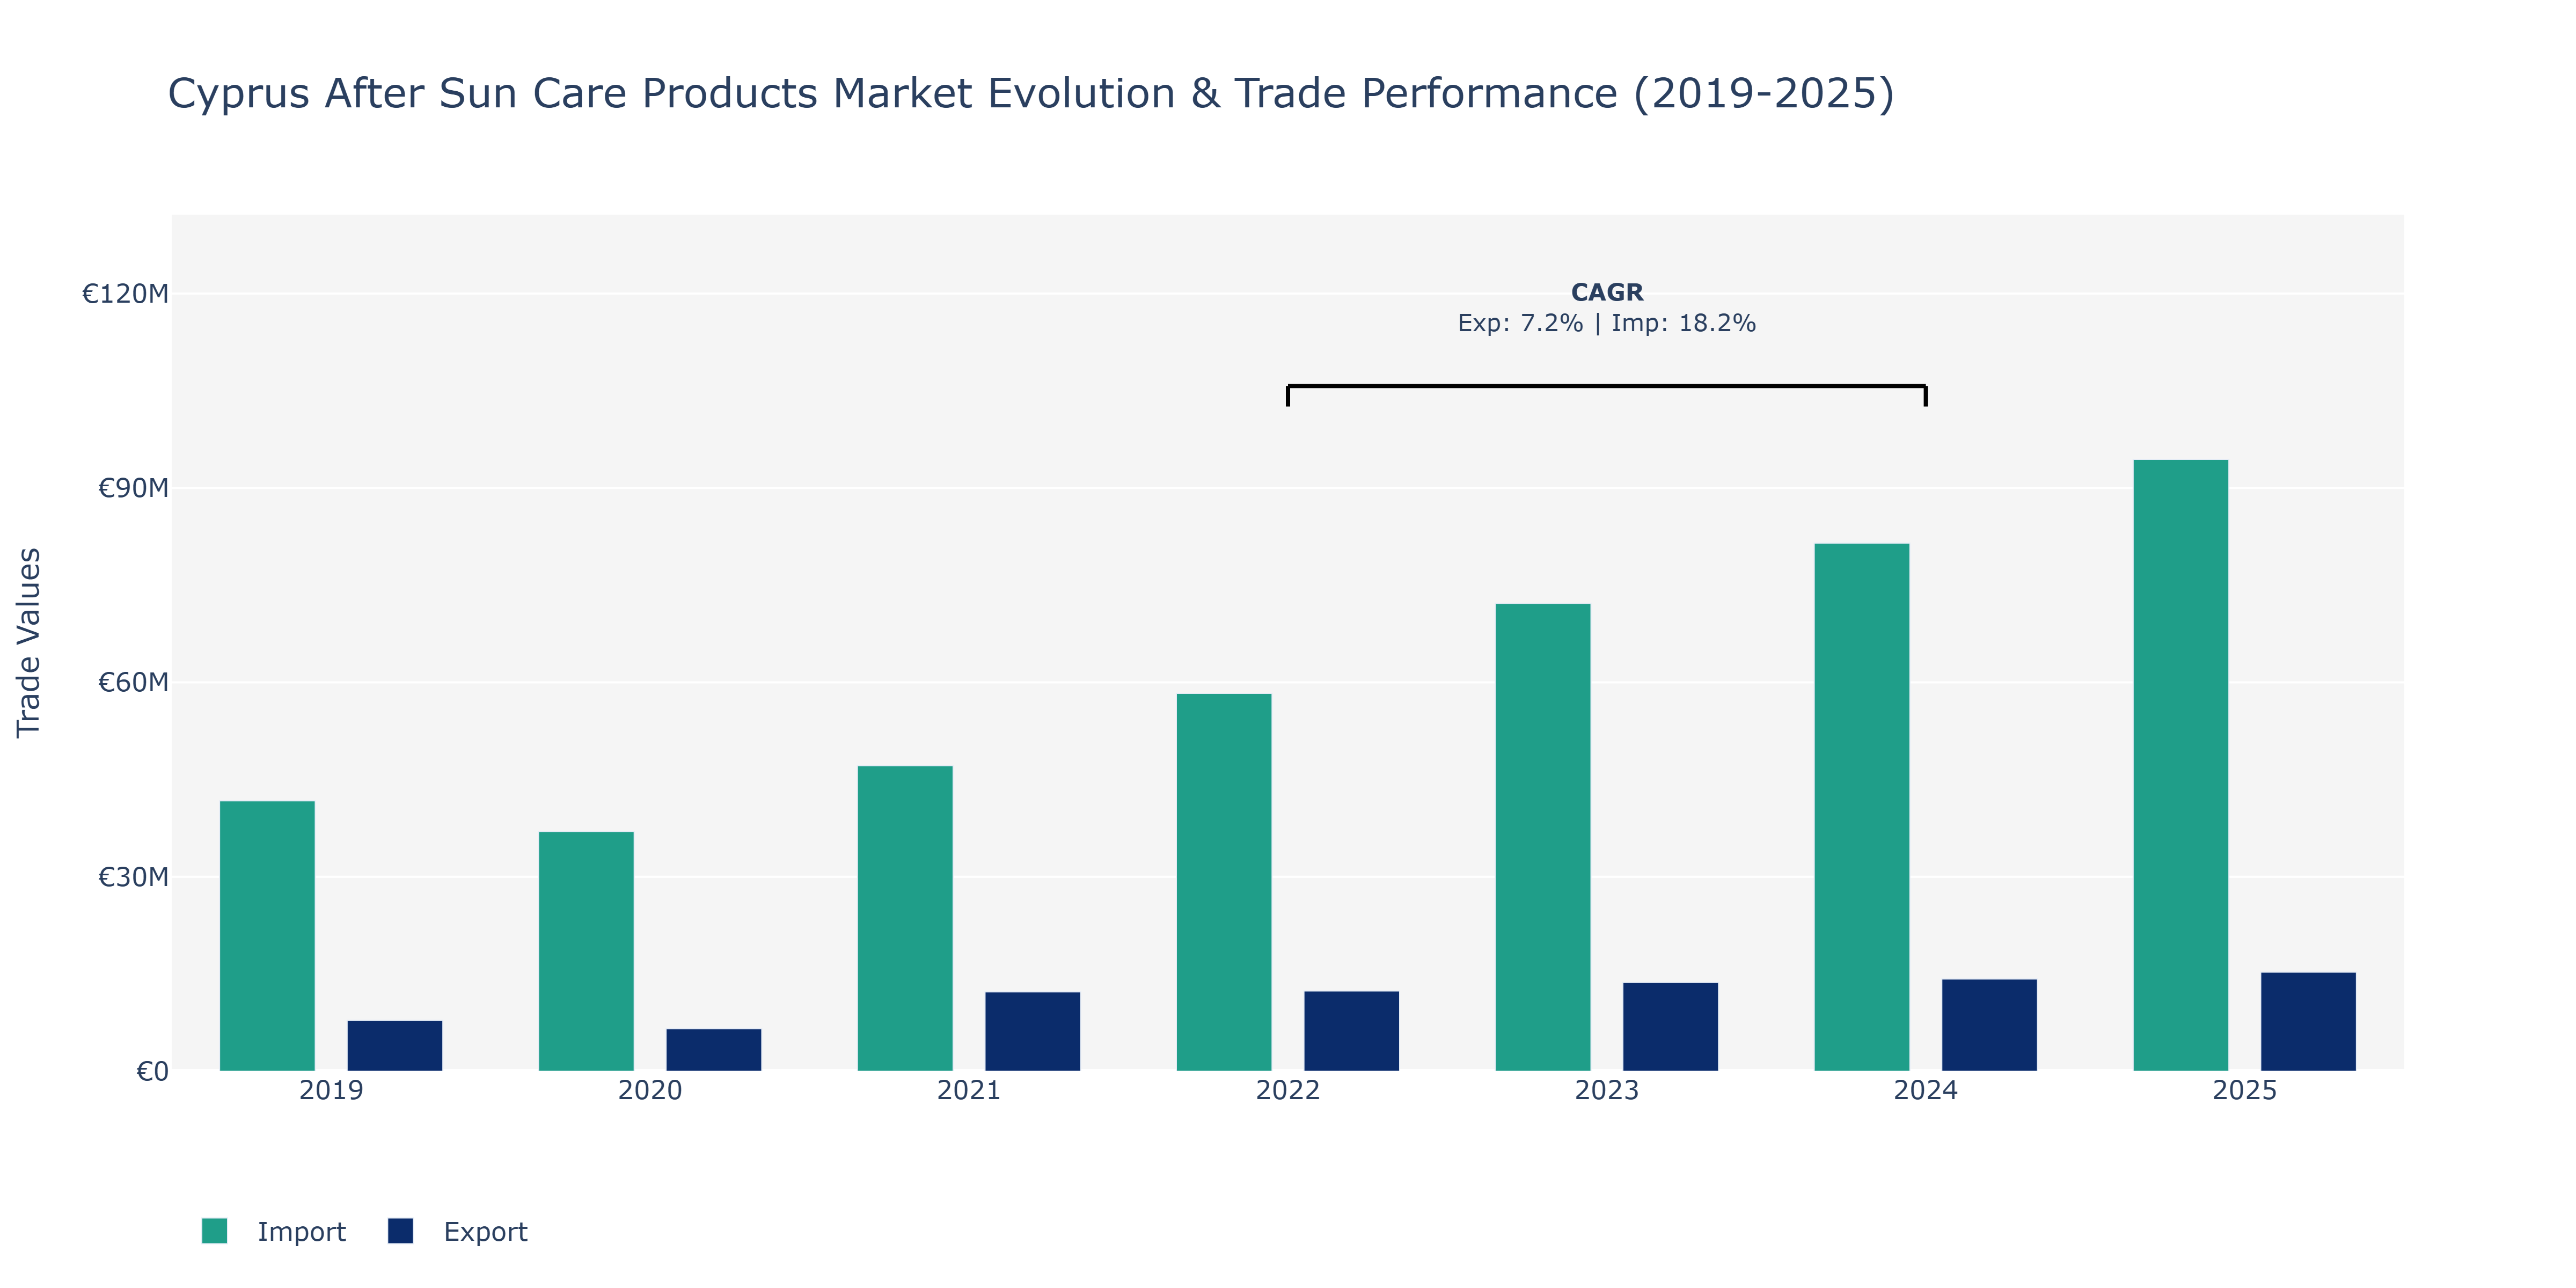
Between 2019 and 2025, Cyprus experienced notable fluctuations in Exports and Imports of After Sun Care Products. Exports started at €7.87 million in 2019, decreasing to €6.53 million in 2020 before showcasing an upward trend year-over-year, reaching €15.27 million in 2025. In comparison, Imports followed a similar pattern, starting at €41.71 million in 2019, dropping to €36.99 million in 2020, and then consistently rising to €94.4 million in 2025. The significant growth in both Exports and Imports can be attributed to the increasing demand for quality after sun care products, driven by rising awareness of skin health and the importance of sun protection among consumers in Cyprus. The surge in Imports could be due to the country's reliance on imported raw materials and finished goods for its after sun care product market, indicating a growing market and consumer preference for a wide range of products.
Key Highlights of the Report:
- Cyprus After Sun Care Products Market Outlook
- Market Size of Cyprus After Sun Care Products Market, 2024
- Forecast of Cyprus After Sun Care Products Market, 2031
- Historical Data and Forecast of Cyprus After Sun Care Products Revenues & Volume for the Period 2021-2031
- Cyprus After Sun Care Products Market Trend Evolution
- Cyprus After Sun Care Products Market Drivers and Challenges
- Cyprus After Sun Care Products Price Trends
- Cyprus After Sun Care Products Porter`s Five Forces
- Cyprus After Sun Care Products Industry Life Cycle
- Historical Data and Forecast of Cyprus After Sun Care Products Market Revenues & Volume By Type for the Period 2021-2031
- Historical Data and Forecast of Cyprus After Sun Care Products Market Revenues & Volume By Mass for the Period 2021-2031
- Historical Data and Forecast of Cyprus After Sun Care Products Market Revenues & Volume By Premium for the Period 2021-2031
- Historical Data and Forecast of Cyprus After Sun Care Products Market Revenues & Volume By Product for the Period 2021-2031
- Historical Data and Forecast of Cyprus After Sun Care Products Market Revenues & Volume By Lotion for the Period 2021-2031
- Historical Data and Forecast of Cyprus After Sun Care Products Market Revenues & Volume By Cream for the Period 2021-2031
- Historical Data and Forecast of Cyprus After Sun Care Products Market Revenues & Volume By Gel for the Period 2021-2031
- Historical Data and Forecast of Cyprus After Sun Care Products Market Revenues & Volume By Others for the Period 2021-2031
- Historical Data and Forecast of Cyprus After Sun Care Products Market Revenues & Volume By Distribution Channel for the Period 2021-2031
- Historical Data and Forecast of Cyprus After Sun Care Products Market Revenues & Volume By Hypermarkets & Supermarkets for the Period 2021-2031
- Historical Data and Forecast of Cyprus After Sun Care Products Market Revenues & Volume By Specialty Stores for the Period 2021-2031
- Historical Data and Forecast of Cyprus After Sun Care Products Market Revenues & Volume By E-commerce for the Period 2021-2031
- Historical Data and Forecast of Cyprus After Sun Care Products Market Revenues & Volume By Others for the Period 2021-2031
- Cyprus After Sun Care Products Import Export Trade Statistics
- Market Opportunity Assessment By Type
- Market Opportunity Assessment By Product
- Market Opportunity Assessment By Distribution Channel
- Cyprus After Sun Care Products Top Companies Market Share
- Cyprus After Sun Care Products Competitive Benchmarking By Technical and Operational Parameters
- Cyprus After Sun Care Products Company Profiles
- Cyprus After Sun Care Products Key Strategic Recommendations
Frequently Asked Questions About the Market Study (FAQs):
6Wresearch actively monitors the Cyprus After Sun Care Products Market and publishes its comprehensive annual report, highlighting emerging trends, growth drivers, revenue analysis, and forecast outlook. Our insights help businesses to make data-backed strategic decisions with ongoing market dynamics. Our analysts track relevent industries related to the Cyprus After Sun Care Products Market, allowing our clients with actionable intelligence and reliable forecasts tailored to emerging regional needs.
Yes, we provide customisation as per your requirements. To learn more, feel free to contact us on sales@6wresearch.com
1 Executive Summary |
2 Introduction |
2.1 Key Highlights of the Report |
2.2 Report Description |
2.3 Market Scope & Segmentation |
2.4 Research Methodology |
2.5 Assumptions |
3 Cyprus After Sun Care Products Market Overview |
3.1 Cyprus Country Macro Economic Indicators |
3.2 Cyprus After Sun Care Products Market Revenues & Volume, 2021 & 2031F |
3.3 Cyprus After Sun Care Products Market - Industry Life Cycle |
3.4 Cyprus After Sun Care Products Market - Porter's Five Forces |
3.5 Cyprus After Sun Care Products Market Revenues & Volume Share, By Type, 2021 & 2031F |
3.6 Cyprus After Sun Care Products Market Revenues & Volume Share, By Product, 2021 & 2031F |
3.7 Cyprus After Sun Care Products Market Revenues & Volume Share, By Distribution Channel, 2021 & 2031F |
4 Cyprus After Sun Care Products Market Dynamics |
4.1 Impact Analysis |
4.2 Market Drivers |
4.3 Market Restraints |
5 Cyprus After Sun Care Products Market Trends |
6 Cyprus After Sun Care Products Market Segmentations |
6.1 Cyprus After Sun Care Products Market, By Type |
6.1.1 Overview and Analysis |
6.1.2 Cyprus After Sun Care Products Market Revenues & Volume, By Mass, 2021-2031F |
6.1.3 Cyprus After Sun Care Products Market Revenues & Volume, By Premium, 2021-2031F |
6.2 Cyprus After Sun Care Products Market, By Product |
6.2.1 Overview and Analysis |
6.2.2 Cyprus After Sun Care Products Market Revenues & Volume, By Lotion, 2021-2031F |
6.2.3 Cyprus After Sun Care Products Market Revenues & Volume, By Cream, 2021-2031F |
6.2.4 Cyprus After Sun Care Products Market Revenues & Volume, By Gel, 2021-2031F |
6.2.5 Cyprus After Sun Care Products Market Revenues & Volume, By Others, 2021-2031F |
6.3 Cyprus After Sun Care Products Market, By Distribution Channel |
6.3.1 Overview and Analysis |
6.3.2 Cyprus After Sun Care Products Market Revenues & Volume, By Hypermarkets & Supermarkets, 2021-2031F |
6.3.3 Cyprus After Sun Care Products Market Revenues & Volume, By Specialty Stores, 2021-2031F |
6.3.4 Cyprus After Sun Care Products Market Revenues & Volume, By E-commerce, 2021-2031F |
6.3.5 Cyprus After Sun Care Products Market Revenues & Volume, By Others, 2021-2031F |
7 Cyprus After Sun Care Products Market Import-Export Trade Statistics |
7.1 Cyprus After Sun Care Products Market Export to Major Countries |
7.2 Cyprus After Sun Care Products Market Imports from Major Countries |
8 Cyprus After Sun Care Products Market Key Performance Indicators |
9 Cyprus After Sun Care Products Market - Opportunity Assessment |
9.1 Cyprus After Sun Care Products Market Opportunity Assessment, By Type, 2021 & 2031F |
9.2 Cyprus After Sun Care Products Market Opportunity Assessment, By Product, 2021 & 2031F |
9.3 Cyprus After Sun Care Products Market Opportunity Assessment, By Distribution Channel, 2021 & 2031F |
10 Cyprus After Sun Care Products Market - Competitive Landscape |
10.1 Cyprus After Sun Care Products Market Revenue Share, By Companies, 2024 |
10.2 Cyprus After Sun Care Products Market Competitive Benchmarking, By Operating and Technical Parameters |
11 Company Profiles |
12 Recommendations | 13 Disclaimer |
Global Go To Market Strategy - 2030
Export potential enables firms to identify high-growth global markets with greater confidence by combining advanced trade intelligence with a structured quantitative methodology. The framework analyzes emerging demand trends and country-level import patterns while integrating macroeconomic and trade datasets such as GDP and population forecasts, bilateral import–export flows, tariff structures, elasticity differentials between developed and developing economies, geographic distance, and import demand projections. Using weighted trade values from 2020–2024 as the base period to project country-to-country export potential for 2030, these inputs are operationalized through calculated drivers such as gravity model parameters, tariff impact factors, and projected GDP per-capita growth. Through an analysis of hidden potentials, demand hotspots, and market conditions that are most favorable to success, this method enables firms to focus on target countries, maximize returns, and global expansion with data, backed by accuracy.
By factoring in the projected importer demand gap that is currently unmet and could be potential opportunity, it identifies the potential for the Exporter (Country) among 190 countries, against the general trade analysis, which identifies the biggest importer or exporter.
To discover high-growth global markets and optimize your business strategy:
Click Here
Pricing
- Single User License$ 1,995
- Department License$ 2,400
- Site License$ 3,120
- Global License$ 3,795

Leadership Perspectives from Industry Events
Search
Thought Leadership and Analyst Meet


Our Clients
6WResearch In News
- India Air Conditioner Market Set for Strong Rebound in 2026 After Weather-Led Correction and GST-Driven Recovery: 6Wresearch
- ADAS in India: How Automatic Emergency Braking, Blind Spot Detection & Driver Monitoring are Transforming Road Safety
- Doha a strategic location for EV manufacturing hub: IPA Qatar
- Demand for luxury TVs surging in the GCC, says Samsung
- Empowering Growth: The Thriving Journey of Bangladesh’s Cable Industry
- Demand for luxury TVs surging in the GCC, says Samsung
Latest Reports
- Nicaragua RPG Gaming Market (2026-2032)
- New Zealand RPG Gaming Market (2026-2032)
- Netherlands RPG Gaming Market (2026-2032)
- Nauru RPG Gaming Market (2026-2032)
- Namibia RPG Gaming Market (2026-2032)
- Mozambique RPG Gaming Market (2026-2032)
- Montenegro RPG Gaming Market (2026-2032)
- Mongolia RPG Gaming Market (2026-2032)
- Monaco RPG Gaming Market (2026-2032)
- Micronesia RPG Gaming Market (2026-2032)
Industry Events and Analyst Meet

EV India Expo 2026

HIMTEX 2026

India Refining Summit 2026

India EV Show 2026

EV tech India Expo 2026
Whitepaper
- Middle East & Africa Commercial Security Market Click here to view more.
- Middle East & Africa Fire Safety Systems & Equipment Market Click here to view more.
- GCC Drone Market Click here to view more.
- Middle East Lighting Fixture Market Click here to view more.
- GCC Physical & Perimeter Security Market Click here to view more.