Cyprus Almond Butter Market (2025-2031) | Outlook, Industry, Segmentation, Share, Value, Size & Revenue, Companies, Growth, Forecast, Analysis, Trends, Competitive Landscape
Market Forecast By Application (Food Industry, Cosmetics Industry, Other Applications), By Distribution Channel (Online Retail, Hypermarkets and Supermarkets, Departmental Stores and Convenience Stores), By Type (Raw Almond Butter, Roasted Almond Butter) And Competitive Landscape
| Product Code: ETC6887648 | Publication Date: Sep 2024 | Updated Date: Apr 2026 | Product Type: Market Research Report | |
| Publisher: 6Wresearch | Author: Sumit Sagar | No. of Pages: 75 | No. of Figures: 35 | No. of Tables: 20 |
Cyprus Almond Butter Market Size (2020-2030)
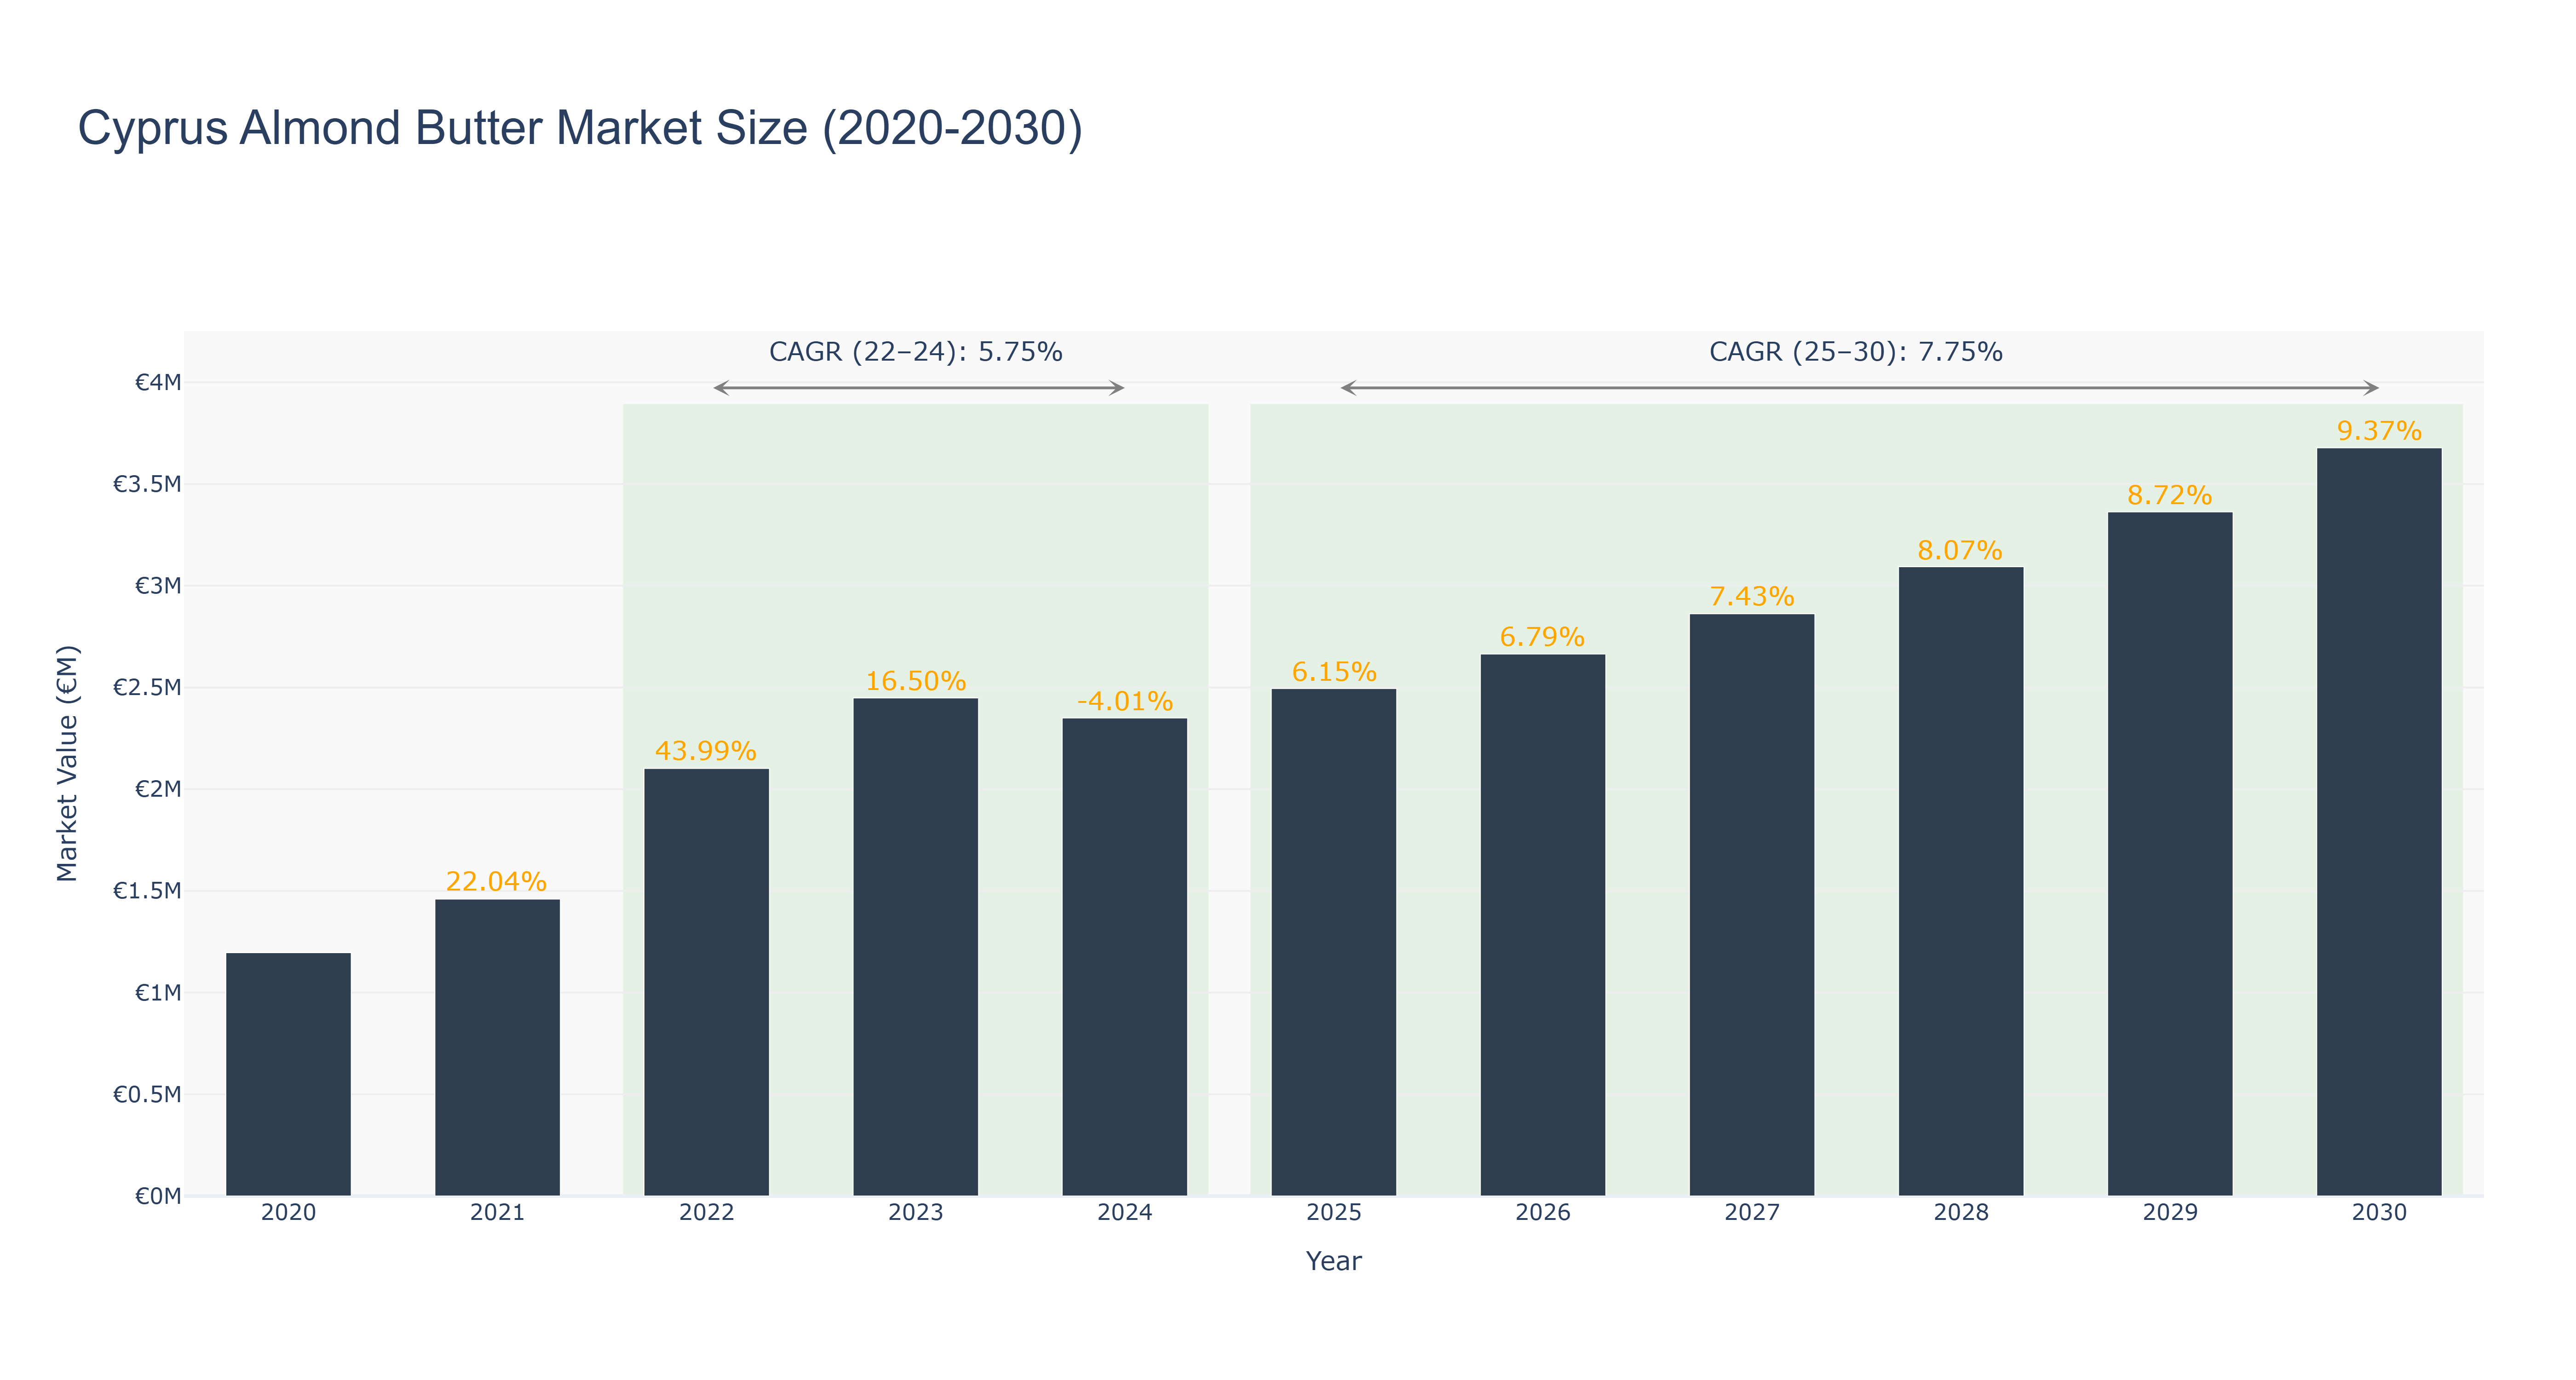
Cyprus Almond Butter Market has shown a steady growth trajectory over the years. The market peaked at €3.68 million in 2030, with a forecasted growth rate of 9.37%. From 2020 to 2024, the market size increased from €1.20 million to €2.35 million, experiencing a slight decline in 2024 due to a negative growth rate of -4.01%. The market rebounded and continued its upward trend, driven by increasing consumer demand for healthy alternatives and the rising popularity of almond-based products. The CAGR for the period 2022-24 was 5.75%, while for 2025-30, it is projected to be 7.75%. Looking ahead, Cyprus is set to witness new investments in almond butter production facilities, aiming to capitalize on the growing health-conscious consumer base. These developments are expected to further boost the market's growth and solidify its position in the healthy food segment.
Cyprus Almond Butter Market: Production & Trade Performance (2019-2025)
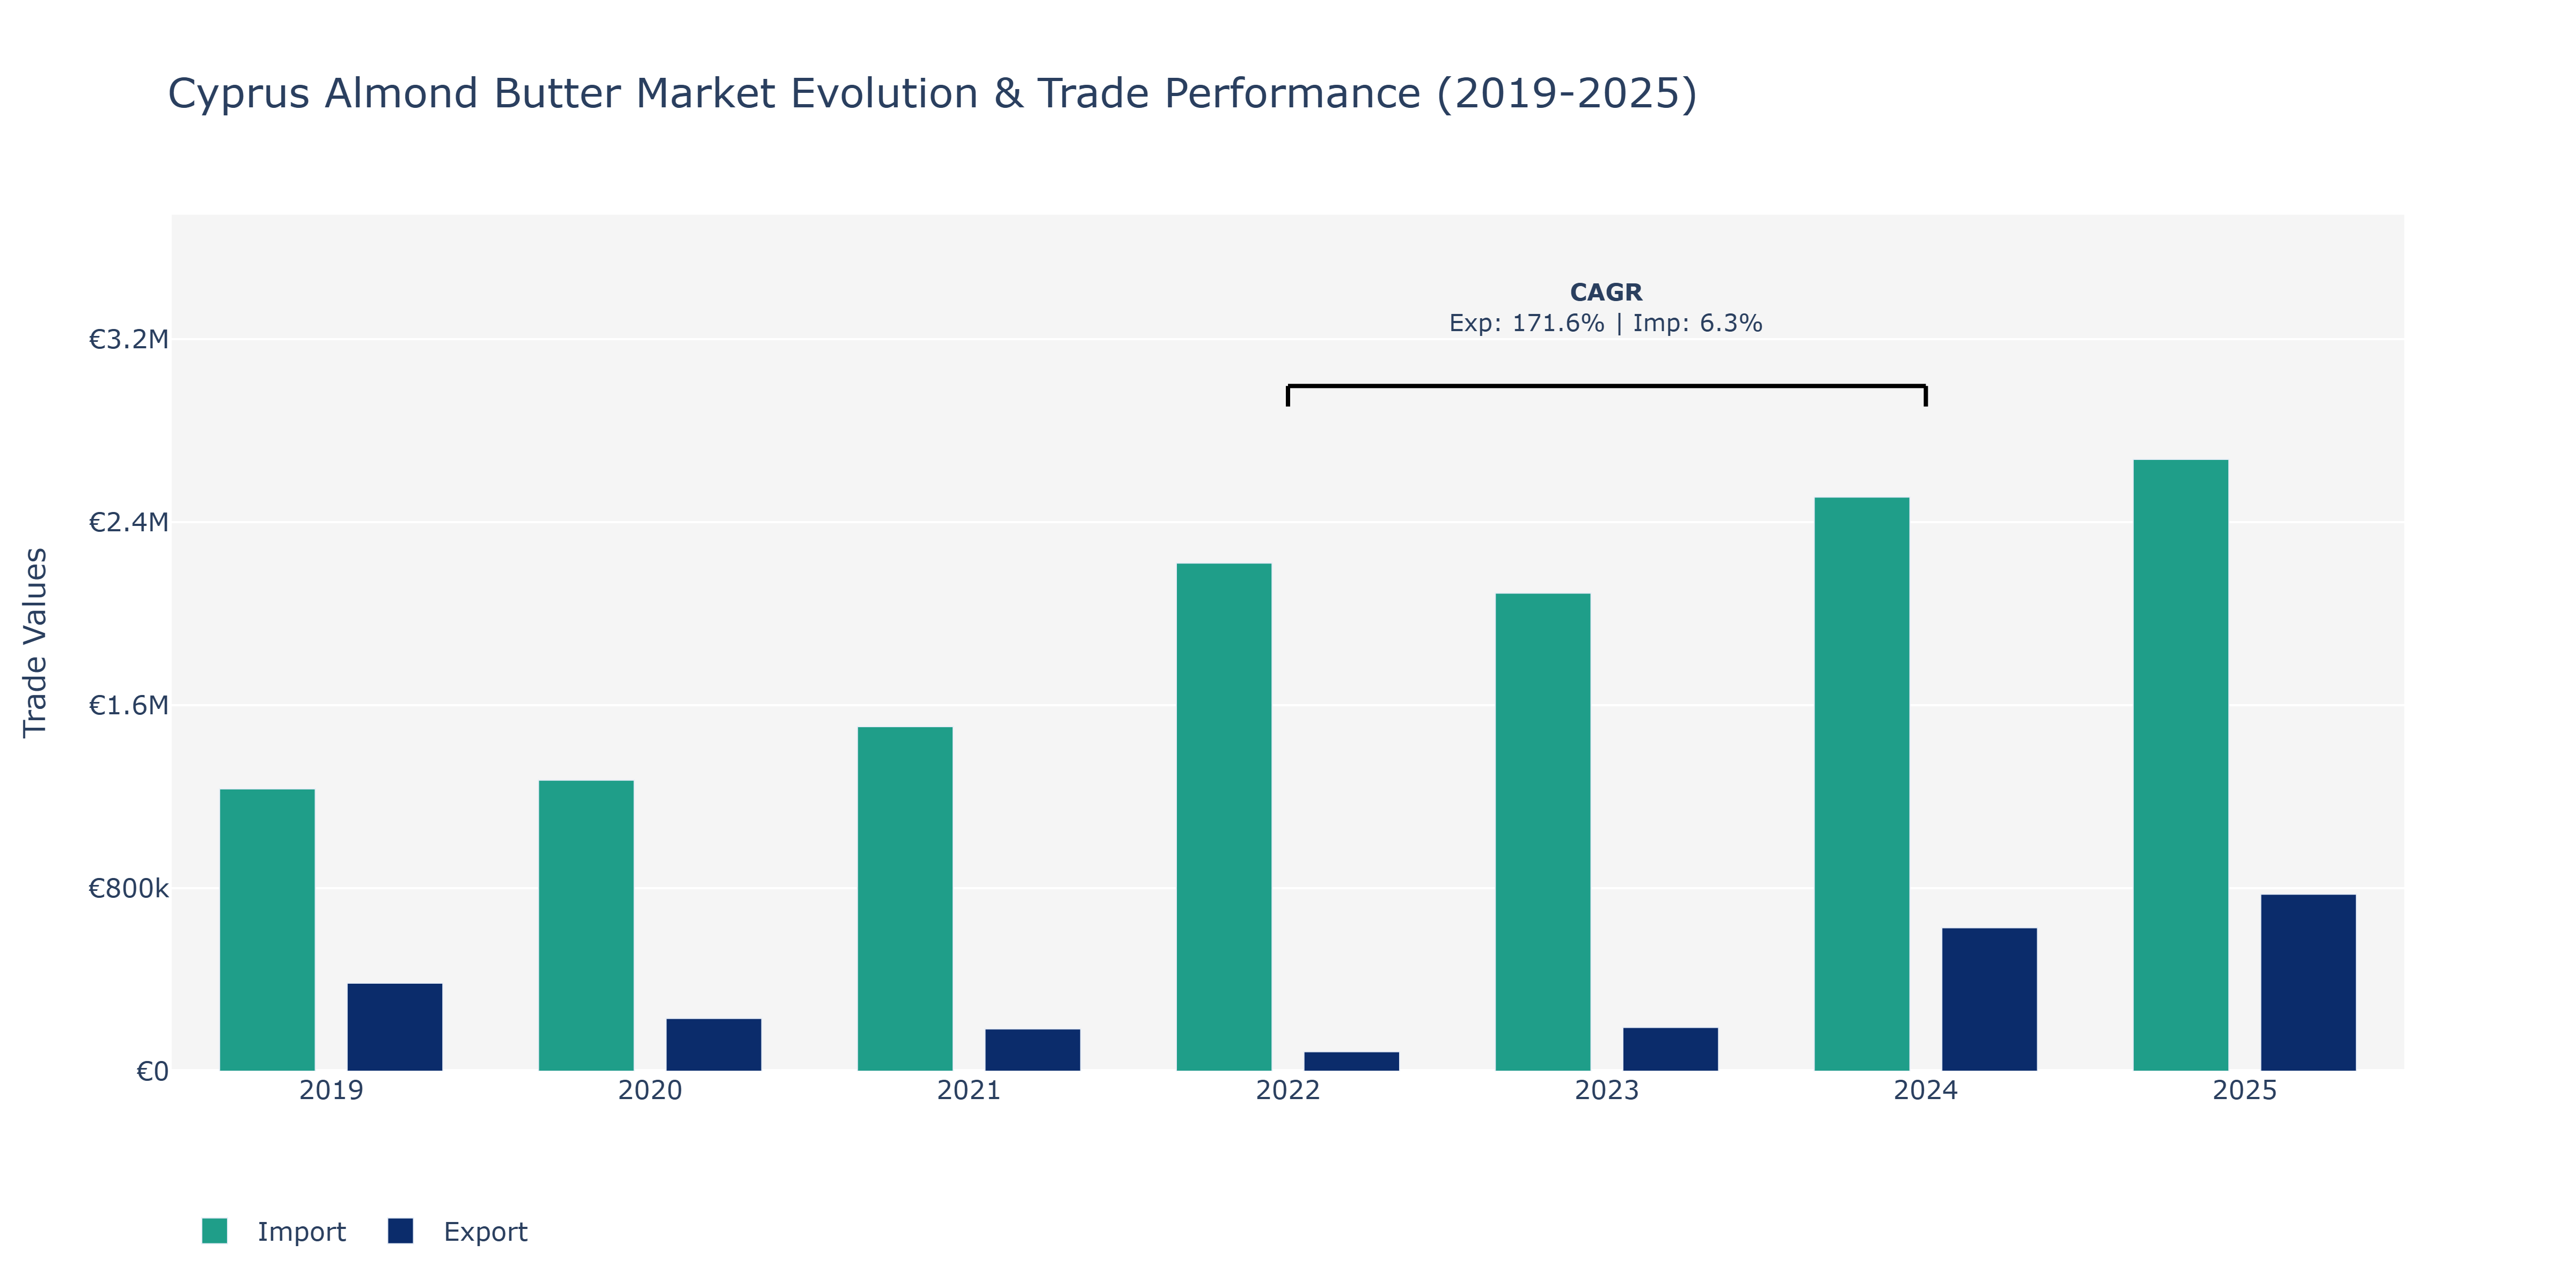
Between 2019 and 2025, the Cyprus Almond Butter Market witnessed notable fluctuations in both exports and imports. Exports peaked in 2024 at approximately €627.21 thousand, showing a significant increase from the €85.03 thousand recorded in 2022. This surge in exports can be attributed to the growing popularity of almond-based products due to their perceived health benefits and versatile use in various food items. On the other hand, imports also displayed an upward trend, reaching around €2.67 million in 2025 from €1.23 million in 2019. This increase may have been driven by rising demand for almond butter in Cyprus, potentially due to changing consumer preferences towards healthier food choices and an expanding food processing industry on the island. The consistent growth in both exports and imports highlights the market's resilience and potential for further expansion in the coming years as consumers continue to prioritize health and wellness in their dietary habits.
Key Highlights of the Report:
- Cyprus Almond Butter Market Outlook
- Market Size of Cyprus Almond Butter Market, 2024
- Forecast of Cyprus Almond Butter Market, 2031
- Historical Data and Forecast of Cyprus Almond Butter Revenues & Volume for the Period 2021- 2031
- Cyprus Almond Butter Market Trend Evolution
- Cyprus Almond Butter Market Drivers and Challenges
- Cyprus Almond Butter Price Trends
- Cyprus Almond Butter Porter's Five Forces
- Cyprus Almond Butter Industry Life Cycle
- Historical Data and Forecast of Cyprus Almond Butter Market Revenues & Volume By Application for the Period 2021- 2031
- Historical Data and Forecast of Cyprus Almond Butter Market Revenues & Volume By Food Industry for the Period 2021- 2031
- Historical Data and Forecast of Cyprus Almond Butter Market Revenues & Volume By Cosmetics Industry for the Period 2021- 2031
- Historical Data and Forecast of Cyprus Almond Butter Market Revenues & Volume By Other Applications for the Period 2021- 2031
- Historical Data and Forecast of Cyprus Almond Butter Market Revenues & Volume By Distribution Channel for the Period 2021- 2031
- Historical Data and Forecast of Cyprus Almond Butter Market Revenues & Volume By Online Retail for the Period 2021- 2031
- Historical Data and Forecast of Cyprus Almond Butter Market Revenues & Volume By Hypermarkets and Supermarkets for the Period 2021- 2031
- Historical Data and Forecast of Cyprus Almond Butter Market Revenues & Volume By Departmental Stores and Convenience Stores for the Period 2021- 2031
- Historical Data and Forecast of Cyprus Almond Butter Market Revenues & Volume By Type for the Period 2021- 2031
- Historical Data and Forecast of Cyprus Almond Butter Market Revenues & Volume By Raw Almond Butter for the Period 2021- 2031
- Historical Data and Forecast of Cyprus Almond Butter Market Revenues & Volume By Roasted Almond Butter for the Period 2021- 2031
- Cyprus Almond Butter Import Export Trade Statistics
- Market Opportunity Assessment By Application
- Market Opportunity Assessment By Distribution Channel
- Market Opportunity Assessment By Type
- Cyprus Almond Butter Top Companies Market Share
- Cyprus Almond Butter Competitive Benchmarking By Technical and Operational Parameters
- Cyprus Almond Butter Company Profiles
- Cyprus Almond Butter Key Strategic Recommendations
Frequently Asked Questions About the Market Study (FAQs):
6Wresearch actively monitors the Cyprus Almond Butter Market and publishes its comprehensive annual report, highlighting emerging trends, growth drivers, revenue analysis, and forecast outlook. Our insights help businesses to make data-backed strategic decisions with ongoing market dynamics. Our analysts track relevent industries related to the Cyprus Almond Butter Market, allowing our clients with actionable intelligence and reliable forecasts tailored to emerging regional needs.
Yes, we provide customisation as per your requirements. To learn more, feel free to contact us on sales@6wresearch.com
1 Executive Summary |
2 Introduction |
2.1 Key Highlights of the Report |
2.2 Report Description |
2.3 Market Scope & Segmentation |
2.4 Research Methodology |
2.5 Assumptions |
3 Cyprus Almond Butter Market Overview |
3.1 Cyprus Country Macro Economic Indicators |
3.2 Cyprus Almond Butter Market Revenues & Volume, 2021 & 2031F |
3.3 Cyprus Almond Butter Market - Industry Life Cycle |
3.4 Cyprus Almond Butter Market - Porter's Five Forces |
3.5 Cyprus Almond Butter Market Revenues & Volume Share, By Application, 2021 & 2031F |
3.6 Cyprus Almond Butter Market Revenues & Volume Share, By Distribution Channel, 2021 & 2031F |
3.7 Cyprus Almond Butter Market Revenues & Volume Share, By Type, 2021 & 2031F |
4 Cyprus Almond Butter Market Dynamics |
4.1 Impact Analysis |
4.2 Market Drivers |
4.3 Market Restraints |
5 Cyprus Almond Butter Market Trends |
6 Cyprus Almond Butter Market, By Types |
6.1 Cyprus Almond Butter Market, By Application |
6.1.1 Overview and Analysis |
6.1.2 Cyprus Almond Butter Market Revenues & Volume, By Application, 2021- 2031F |
6.1.3 Cyprus Almond Butter Market Revenues & Volume, By Food Industry, 2021- 2031F |
6.1.4 Cyprus Almond Butter Market Revenues & Volume, By Cosmetics Industry, 2021- 2031F |
6.1.5 Cyprus Almond Butter Market Revenues & Volume, By Other Applications, 2021- 2031F |
6.2 Cyprus Almond Butter Market, By Distribution Channel |
6.2.1 Overview and Analysis |
6.2.2 Cyprus Almond Butter Market Revenues & Volume, By Online Retail, 2021- 2031F |
6.2.3 Cyprus Almond Butter Market Revenues & Volume, By Hypermarkets and Supermarkets, 2021- 2031F |
6.2.4 Cyprus Almond Butter Market Revenues & Volume, By Departmental Stores and Convenience Stores, 2021- 2031F |
6.3 Cyprus Almond Butter Market, By Type |
6.3.1 Overview and Analysis |
6.3.2 Cyprus Almond Butter Market Revenues & Volume, By Raw Almond Butter, 2021- 2031F |
6.3.3 Cyprus Almond Butter Market Revenues & Volume, By Roasted Almond Butter, 2021- 2031F |
7 Cyprus Almond Butter Market Import-Export Trade Statistics |
7.1 Cyprus Almond Butter Market Export to Major Countries |
7.2 Cyprus Almond Butter Market Imports from Major Countries |
8 Cyprus Almond Butter Market Key Performance Indicators |
9 Cyprus Almond Butter Market - Opportunity Assessment |
9.1 Cyprus Almond Butter Market Opportunity Assessment, By Application, 2021 & 2031F |
9.2 Cyprus Almond Butter Market Opportunity Assessment, By Distribution Channel, 2021 & 2031F |
9.3 Cyprus Almond Butter Market Opportunity Assessment, By Type, 2021 & 2031F |
10 Cyprus Almond Butter Market - Competitive Landscape |
10.1 Cyprus Almond Butter Market Revenue Share, By Companies, 2024 |
10.2 Cyprus Almond Butter Market Competitive Benchmarking, By Operating and Technical Parameters |
11 Company Profiles |
12 Recommendations |
13 Disclaimer |
Export potential assessment - trade Analytics for 2030
Export potential enables firms to identify high-growth global markets with greater confidence by combining advanced trade intelligence with a structured quantitative methodology. The framework analyzes emerging demand trends and country-level import patterns while integrating macroeconomic and trade datasets such as GDP and population forecasts, bilateral import–export flows, tariff structures, elasticity differentials between developed and developing economies, geographic distance, and import demand projections. Using weighted trade values from 2020–2024 as the base period to project country-to-country export potential for 2030, these inputs are operationalized through calculated drivers such as gravity model parameters, tariff impact factors, and projected GDP per-capita growth. Through an analysis of hidden potentials, demand hotspots, and market conditions that are most favorable to success, this method enables firms to focus on target countries, maximize returns, and global expansion with data, backed by accuracy.
By factoring in the projected importer demand gap that is currently unmet and could be potential opportunity, it identifies the potential for the Exporter (Country) among 190 countries, against the general trade analysis, which identifies the biggest importer or exporter.
To discover high-growth global markets and optimize your business strategy:
Click Here
Pricing
- Single User License$ 1,995
- Department License$ 2,400
- Site License$ 3,120
- Global License$ 3,795

Search
Thought Leadership and Analyst Meet


Our Clients
Latest Reports
- India Ultrasonic Smart Water Meter Market (2026-2032) | Outlook, Competition, Drivers, Trends, Demand, Competitive, Strategic Insights, Companies, Challenges, Strategy, Consumer Insights, Analysis, Opportunities, Growth, Size, Share, Industry, Revenue, Segments, Value, Segmentation, Supply, Forecast, Restraints,
- India Electromagnetic Bulk Flow Meter Market (2026-2032) | Analysis, Challenges, Strategic Insights, Supply, Forecast, Growth, Share, Consumer Insights, Competitive, Value, Outlook, Size & Demand,
- India Battery Powered Bulk Flow Meter Market (2026-2032) | Outlook, Analysis, Competitive Landscape, Growth, Size, Trends, Value, Revenue, Companies, Segmentation, Share & Forecast
- Bosnia and Herzegovina Fuel-Efficient Winglets Market (2026-2032) | Growth, Competition, Strategy, Restraints, Trends, Challenges, segmentation, Value, Outlook, Investment Opportunities, Analysis, Revenue, Companies, Insights, Pricing, Size, Drivers, Demand, Share, Forecast
- Canada Cloud CFD Market (2026-2032) | Size & Revenue, Industry, Growth, Competitive Landscape, Forecast, Segmentation, Value, Outlook, Trends, Share, Analysis, Companies
- Taiwan Food Delivery Platform Market (2026-2032) | Companies, Outlook, Analysis, Trends, Value, Revenue, Segmentation, Share, Forecast, Competitive Landscape, Growth, Size & Forecast
- United Kingdom (UK) Long-term Care Insurance Market (2026-2032) | Growth, Share, Consumer Insights, Drivers, Opportunities, Competition, Pricing Analysis, Segments, Restraints, Companies, Competitive, Value, Outlook, Size, Demand, Analysis, Challenges, Strategic Insights, Investment Trends, Revenue, Trends, Supply, Forecast
- United Kingdom (UK) Long Term Care Market (2026-2032) | Companies, Outlook, Analysis, Trends, Value, Revenue, Segmentation, Share, Forecast, Competitive Landscape, Growth, Size & Forecast
- Iraq Insulation and Waterproofing Market (2026-2032) | Outlook, Drivers, Growth, Size, Share, Industry, Revenue, Trends, Demand, Competitive, Strategic Insights, Opportunities, Segments, Companies, Challenges, Strategy, Consumer Insights, Analysis, Investment Trends, Value, Segmentation, Forecast, Restraints
- India Switchgear Market Outlook (2026-2032) | Size, Share, Trends, Growth, Revenue, Forecast, Analysis, Value, Outlook
Industry Events and Analyst Meet

HIMTEX 2026

India Refining Summit 2026

India EV Show 2026

EV tech India Expo 2026

Auto Tech Asia 2026
Whitepaper
- Middle East & Africa Commercial Security Market Click here to view more.
- Middle East & Africa Fire Safety Systems & Equipment Market Click here to view more.
- GCC Drone Market Click here to view more.
- Middle East Lighting Fixture Market Click here to view more.
- GCC Physical & Perimeter Security Market Click here to view more.
6WResearch In News
- Doha a strategic location for EV manufacturing hub: IPA Qatar
- Demand for luxury TVs surging in the GCC, says Samsung
- Empowering Growth: The Thriving Journey of Bangladesh’s Cable Industry
- Demand for luxury TVs surging in the GCC, says Samsung
- Video call with a traditional healer? Once unthinkable, it’s now common in South Africa
- Intelligent Buildings To Smooth GCC’s Path To Net Zero