Cyprus Cyanuric Acid Market (2025-2031) | Trends, Pricing Analysis, Competitive, Companies, Challenges, Drivers, Growth, Analysis, Segmentation, Investment Trends, Strategic Insights, Demand, Forecast, Size, Segments, Share, Supply, Strategy, Outlook, Restraints, Opportunities, Competition, Revenue, Consumer Insights, Industry, Value
Market Forecast By Product Type (Granular Cyanuric Acid, Liquid Cyanuric Acid, Tablet Form Cyanuric Acid, Powdered Cyanuric Acid), By Technology Type (Chemical Stabilization, Aqueous Formulation, Slow Release Technology, High Purity Form), By End User (Swimming Pool Owners, Water Treatment Plants, Agriculture Sector, Industrial Users), By Application (Chlorine Stabilization in Pools, UV Protection for Water Treatment, Herbicide and Pesticide Applications, Chemical Manufacturing Processes) And Competitive Landscape
| Product Code: ETC11687383 | Publication Date: Apr 2025 | Updated Date: Apr 2026 | Product Type: Market Research Report | |
| Publisher: 6Wresearch | Author: Bhawna Singh | No. of Pages: 65 | No. of Figures: 34 | No. of Tables: 19 |
Cyprus Cyanuric Acid Market Size (2020-2030)
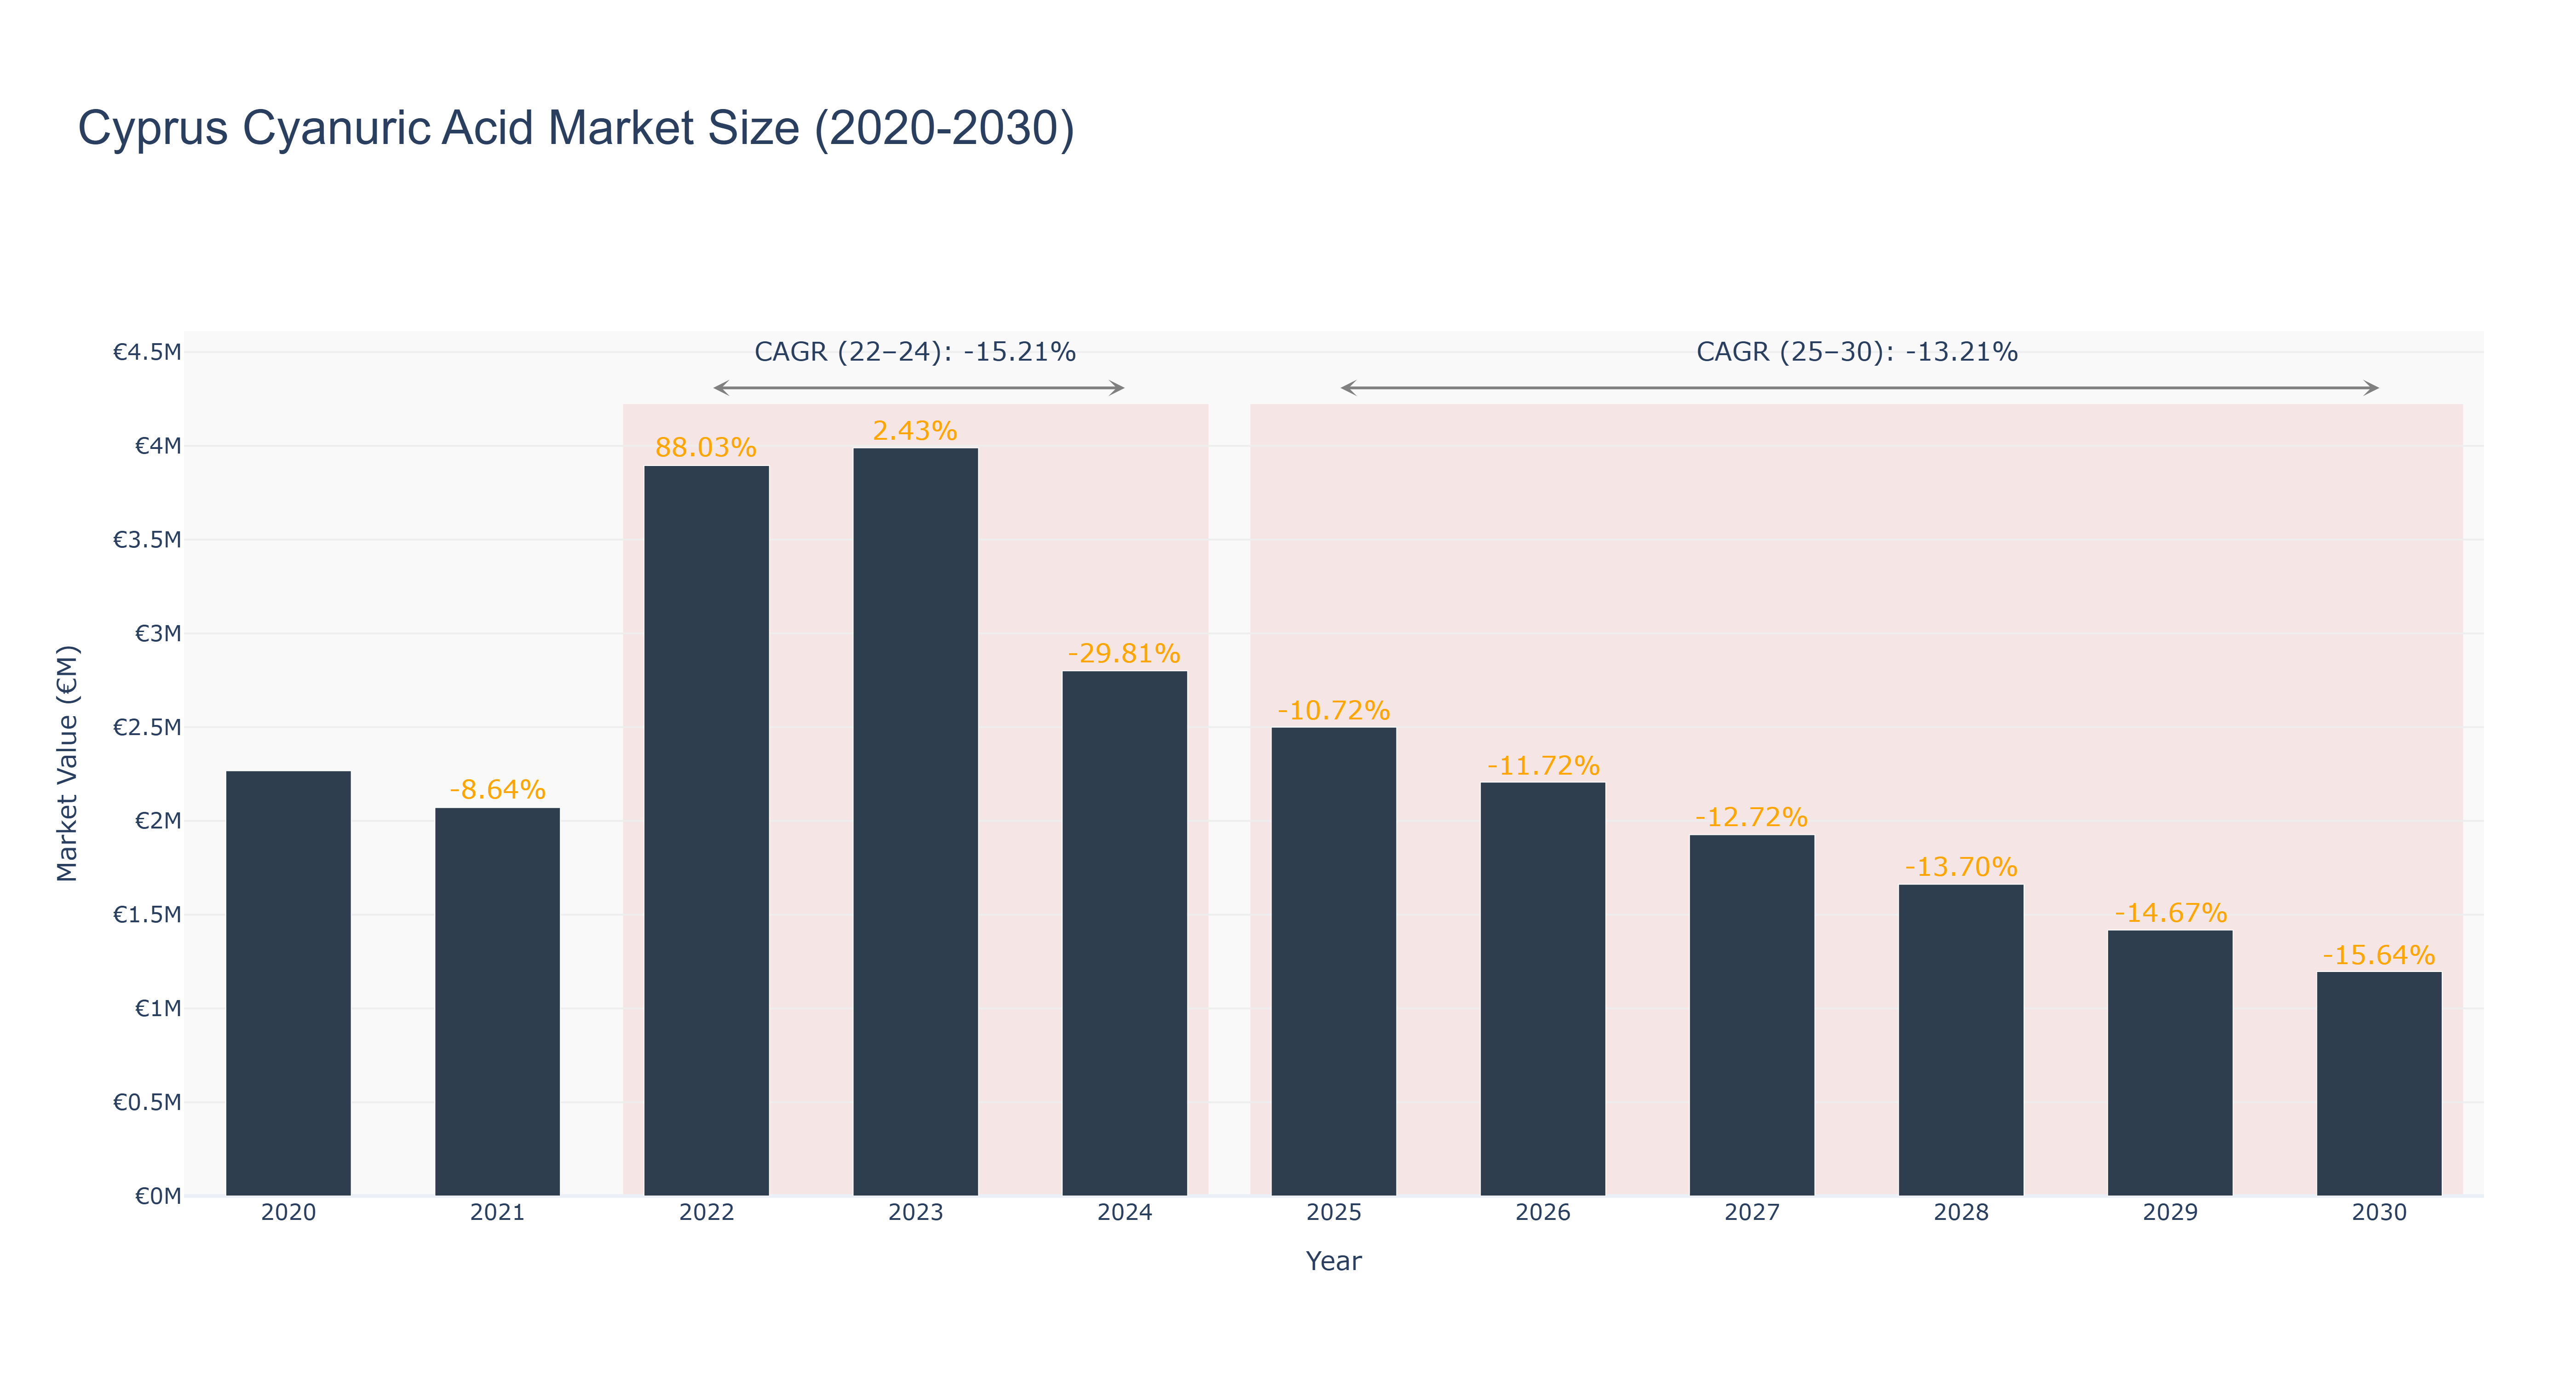
The Cyprus Cyanuric Acid Market experienced a peak market size of €3.99 million in 2023, followed by a decline to €2.80 million in 2024. The market is forecasted to further decrease to €1.20 million by 2030, with a CAGR of -13.21% from 2025 to 2030. The recent downward trend in market size can be attributed to factors such as increased competition, evolving consumer preferences, and economic uncertainties. However, industry drivers such as technological advancements in production processes and growing environmental concerns present opportunities for market recovery. In the near future, Cyprus is set to implement sustainability initiatives in the chemical industry, focusing on eco-friendly manufacturing practices and product innovations to drive market growth and competitiveness.
Cyprus Cyanuric Acid Market: Production & Trade Performance (2019-2025)
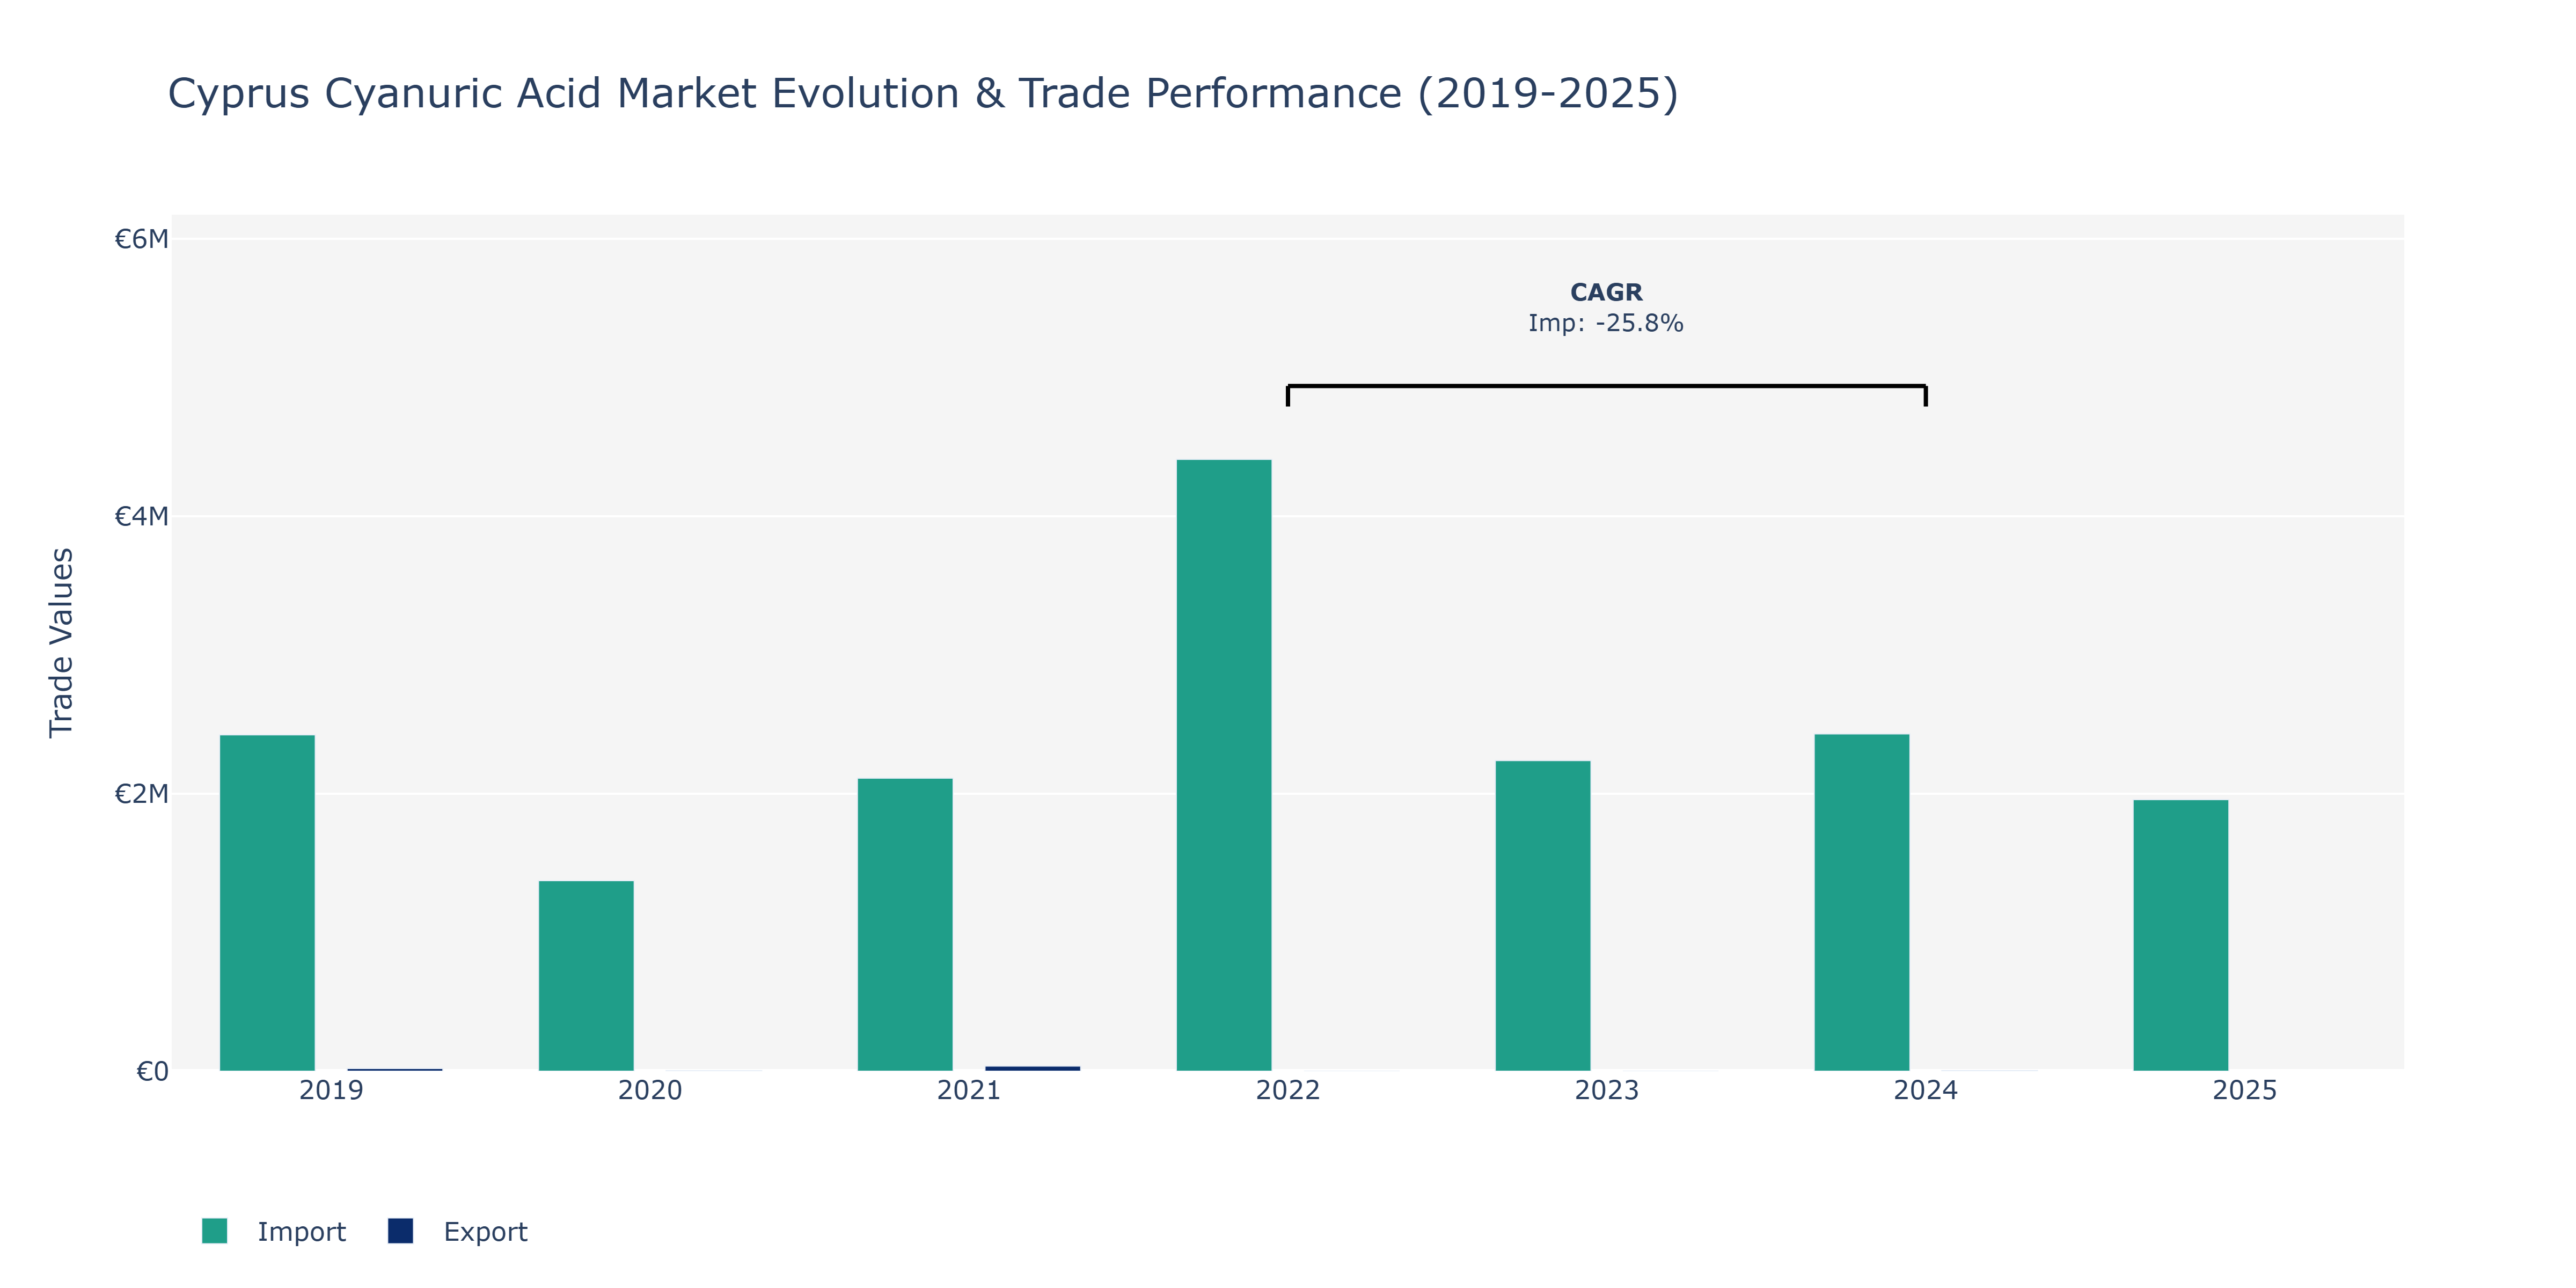
Between 2019 and 2025, the Cyprus Cyanuric Acid Market experienced notable fluctuations in exports and imports. In 2019, exports amounted to €19.0 thousand, declining sharply in 2020 to €3.12 thousand before rebounding significantly in 2021 to reach €36.58 thousand, showcasing a peak point. However, in 2024, exports dropped to €3.98 thousand. On the imports side, the market saw a consistent increase from €2.42 million in 2019 to a peak of €4.41 million in 2022, followed by a decline to €2.24 million in 2023, and then a slight increase in 2025 to €1.96 million. The decrease in imports in 2023 might be attributed to changing consumer preferences towards alternative products or shifts in domestic production. The market's dependency on raw materials or changes in international trade dynamics could have influenced the import trends. It is essential for stakeholders to monitor these fluctuations closely to make informed decisions and adapt strategies to mitigate risks in the Cyprus Cyanuric Acid Market.
Key Highlights of the Report:
- Cyprus Cyanuric Acid Market Outlook
- Market Size of Cyprus Cyanuric Acid Market, 2024
- Forecast of Cyprus Cyanuric Acid Market, 2031
- Historical Data and Forecast of Cyprus Cyanuric Acid Revenues & Volume for the Period 2021-2031
- Cyprus Cyanuric Acid Market Trend Evolution
- Cyprus Cyanuric Acid Market Drivers and Challenges
- Cyprus Cyanuric Acid Price Trends
- Cyprus Cyanuric Acid Porter's Five Forces
- Cyprus Cyanuric Acid Industry Life Cycle
- Historical Data and Forecast of Cyprus Cyanuric Acid Market Revenues & Volume By Product Type for the Period 2021-2031
- Historical Data and Forecast of Cyprus Cyanuric Acid Market Revenues & Volume By Granular Cyanuric Acid for the Period 2021-2031
- Historical Data and Forecast of Cyprus Cyanuric Acid Market Revenues & Volume By Liquid Cyanuric Acid for the Period 2021-2031
- Historical Data and Forecast of Cyprus Cyanuric Acid Market Revenues & Volume By Tablet Form Cyanuric Acid for the Period 2021-2031
- Historical Data and Forecast of Cyprus Cyanuric Acid Market Revenues & Volume By Powdered Cyanuric Acid for the Period 2021-2031
- Historical Data and Forecast of Cyprus Cyanuric Acid Market Revenues & Volume By Technology Type for the Period 2021-2031
- Historical Data and Forecast of Cyprus Cyanuric Acid Market Revenues & Volume By Chemical Stabilization for the Period 2021-2031
- Historical Data and Forecast of Cyprus Cyanuric Acid Market Revenues & Volume By Aqueous Formulation for the Period 2021-2031
- Historical Data and Forecast of Cyprus Cyanuric Acid Market Revenues & Volume By Slow Release Technology for the Period 2021-2031
- Historical Data and Forecast of Cyprus Cyanuric Acid Market Revenues & Volume By High Purity Form for the Period 2021-2031
- Historical Data and Forecast of Cyprus Cyanuric Acid Market Revenues & Volume By End User for the Period 2021-2031
- Historical Data and Forecast of Cyprus Cyanuric Acid Market Revenues & Volume By Swimming Pool Owners for the Period 2021-2031
- Historical Data and Forecast of Cyprus Cyanuric Acid Market Revenues & Volume By Water Treatment Plants for the Period 2021-2031
- Historical Data and Forecast of Cyprus Cyanuric Acid Market Revenues & Volume By Agriculture Sector for the Period 2021-2031
- Historical Data and Forecast of Cyprus Cyanuric Acid Market Revenues & Volume By Industrial Users for the Period 2021-2031
- Historical Data and Forecast of Cyprus Cyanuric Acid Market Revenues & Volume By Application for the Period 2021-2031
- Historical Data and Forecast of Cyprus Cyanuric Acid Market Revenues & Volume By Chlorine Stabilization in Pools for the Period 2021-2031
- Historical Data and Forecast of Cyprus Cyanuric Acid Market Revenues & Volume By UV Protection for Water Treatment for the Period 2021-2031
- Historical Data and Forecast of Cyprus Cyanuric Acid Market Revenues & Volume By Herbicide and Pesticide Applications for the Period 2021-2031
- Historical Data and Forecast of Cyprus Cyanuric Acid Market Revenues & Volume By Chemical Manufacturing Processes for the Period 2021-2031
- Cyprus Cyanuric Acid Import Export Trade Statistics
- Market Opportunity Assessment By Product Type
- Market Opportunity Assessment By Technology Type
- Market Opportunity Assessment By End User
- Market Opportunity Assessment By Application
- Cyprus Cyanuric Acid Top Companies Market Share
- Cyprus Cyanuric Acid Competitive Benchmarking By Technical and Operational Parameters
- Cyprus Cyanuric Acid Company Profiles
- Cyprus Cyanuric Acid Key Strategic Recommendations
Frequently Asked Questions About the Market Study (FAQs):
6Wresearch actively monitors the Cyprus Cyanuric Acid Market and publishes its comprehensive annual report, highlighting emerging trends, growth drivers, revenue analysis, and forecast outlook. Our insights help businesses to make data-backed strategic decisions with ongoing market dynamics. Our analysts track relevent industries related to the Cyprus Cyanuric Acid Market, allowing our clients with actionable intelligence and reliable forecasts tailored to emerging regional needs.
Yes, we provide customisation as per your requirements. To learn more, feel free to contact us on sales@6wresearch.com
1 Executive Summary |
2 Introduction |
2.1 Key Highlights of the Report |
2.2 Report Description |
2.3 Market Scope & Segmentation |
2.4 Research Methodology |
2.5 Assumptions |
3 Cyprus Cyanuric Acid Market Overview |
3.1 Cyprus Country Macro Economic Indicators |
3.2 Cyprus Cyanuric Acid Market Revenues & Volume, 2021 & 2031F |
3.3 Cyprus Cyanuric Acid Market - Industry Life Cycle |
3.4 Cyprus Cyanuric Acid Market - Porter's Five Forces |
3.5 Cyprus Cyanuric Acid Market Revenues & Volume Share, By Product Type, 2021 & 2031F |
3.6 Cyprus Cyanuric Acid Market Revenues & Volume Share, By Technology Type, 2021 & 2031F |
3.7 Cyprus Cyanuric Acid Market Revenues & Volume Share, By End User, 2021 & 2031F |
3.8 Cyprus Cyanuric Acid Market Revenues & Volume Share, By Application, 2021 & 2031F |
4 Cyprus Cyanuric Acid Market Dynamics |
4.1 Impact Analysis |
4.2 Market Drivers |
4.3 Market Restraints |
5 Cyprus Cyanuric Acid Market Trends |
6 Cyprus Cyanuric Acid Market, By Types |
6.1 Cyprus Cyanuric Acid Market, By Product Type |
6.1.1 Overview and Analysis |
6.1.2 Cyprus Cyanuric Acid Market Revenues & Volume, By Product Type, 2021 - 2031F |
6.1.3 Cyprus Cyanuric Acid Market Revenues & Volume, By Granular Cyanuric Acid, 2021 - 2031F |
6.1.4 Cyprus Cyanuric Acid Market Revenues & Volume, By Liquid Cyanuric Acid, 2021 - 2031F |
6.1.5 Cyprus Cyanuric Acid Market Revenues & Volume, By Tablet Form Cyanuric Acid, 2021 - 2031F |
6.1.6 Cyprus Cyanuric Acid Market Revenues & Volume, By Powdered Cyanuric Acid, 2021 - 2031F |
6.2 Cyprus Cyanuric Acid Market, By Technology Type |
6.2.1 Overview and Analysis |
6.2.2 Cyprus Cyanuric Acid Market Revenues & Volume, By Chemical Stabilization, 2021 - 2031F |
6.2.3 Cyprus Cyanuric Acid Market Revenues & Volume, By Aqueous Formulation, 2021 - 2031F |
6.2.4 Cyprus Cyanuric Acid Market Revenues & Volume, By Slow Release Technology, 2021 - 2031F |
6.2.5 Cyprus Cyanuric Acid Market Revenues & Volume, By High Purity Form, 2021 - 2031F |
6.3 Cyprus Cyanuric Acid Market, By End User |
6.3.1 Overview and Analysis |
6.3.2 Cyprus Cyanuric Acid Market Revenues & Volume, By Swimming Pool Owners, 2021 - 2031F |
6.3.3 Cyprus Cyanuric Acid Market Revenues & Volume, By Water Treatment Plants, 2021 - 2031F |
6.3.4 Cyprus Cyanuric Acid Market Revenues & Volume, By Agriculture Sector, 2021 - 2031F |
6.3.5 Cyprus Cyanuric Acid Market Revenues & Volume, By Industrial Users, 2021 - 2031F |
6.4 Cyprus Cyanuric Acid Market, By Application |
6.4.1 Overview and Analysis |
6.4.2 Cyprus Cyanuric Acid Market Revenues & Volume, By Chlorine Stabilization in Pools, 2021 - 2031F |
6.4.3 Cyprus Cyanuric Acid Market Revenues & Volume, By UV Protection for Water Treatment, 2021 - 2031F |
6.4.4 Cyprus Cyanuric Acid Market Revenues & Volume, By Herbicide and Pesticide Applications, 2021 - 2031F |
6.4.5 Cyprus Cyanuric Acid Market Revenues & Volume, By Chemical Manufacturing Processes, 2021 - 2031F |
7 Cyprus Cyanuric Acid Market Import-Export Trade Statistics |
7.1 Cyprus Cyanuric Acid Market Export to Major Countries |
7.2 Cyprus Cyanuric Acid Market Imports from Major Countries |
8 Cyprus Cyanuric Acid Market Key Performance Indicators |
9 Cyprus Cyanuric Acid Market - Opportunity Assessment |
9.1 Cyprus Cyanuric Acid Market Opportunity Assessment, By Product Type, 2021 & 2031F |
9.2 Cyprus Cyanuric Acid Market Opportunity Assessment, By Technology Type, 2021 & 2031F |
9.3 Cyprus Cyanuric Acid Market Opportunity Assessment, By End User, 2021 & 2031F |
9.4 Cyprus Cyanuric Acid Market Opportunity Assessment, By Application, 2021 & 2031F |
10 Cyprus Cyanuric Acid Market - Competitive Landscape |
10.1 Cyprus Cyanuric Acid Market Revenue Share, By Companies, 2024 |
10.2 Cyprus Cyanuric Acid Market Competitive Benchmarking, By Operating and Technical Parameters |
11 Company Profiles |
12 Recommendations |
13 Disclaimer |
Global Go To Market Strategy - 2030
Export potential enables firms to identify high-growth global markets with greater confidence by combining advanced trade intelligence with a structured quantitative methodology. The framework analyzes emerging demand trends and country-level import patterns while integrating macroeconomic and trade datasets such as GDP and population forecasts, bilateral import–export flows, tariff structures, elasticity differentials between developed and developing economies, geographic distance, and import demand projections. Using weighted trade values from 2020–2024 as the base period to project country-to-country export potential for 2030, these inputs are operationalized through calculated drivers such as gravity model parameters, tariff impact factors, and projected GDP per-capita growth. Through an analysis of hidden potentials, demand hotspots, and market conditions that are most favorable to success, this method enables firms to focus on target countries, maximize returns, and global expansion with data, backed by accuracy.
By factoring in the projected importer demand gap that is currently unmet and could be potential opportunity, it identifies the potential for the Exporter (Country) among 190 countries, against the general trade analysis, which identifies the biggest importer or exporter.
To discover high-growth global markets and optimize your business strategy:
Click Here
Pricing
- Single User License$ 1,995
- Department License$ 2,400
- Site License$ 3,120
- Global License$ 3,795

Leadership Perspectives from Industry Events
Search
Thought Leadership and Analyst Meet


Our Clients
6WResearch In News
- Doha a strategic location for EV manufacturing hub: IPA Qatar
- Demand for luxury TVs surging in the GCC, says Samsung
- Empowering Growth: The Thriving Journey of Bangladesh’s Cable Industry
- Demand for luxury TVs surging in the GCC, says Samsung
- Video call with a traditional healer? Once unthinkable, it’s now common in South Africa
- Intelligent Buildings To Smooth GCC’s Path To Net Zero
Latest Reports
- Taiwan Airport Wireless Infrastructure Market (2026-2032)
- Vietnam Airport Wireless Infrastructure Market (2026-2032)
- Thailand Airport Wireless Infrastructure Market (2026-2032)
- South Korea Airport Wireless Infrastructure Market (2026-2032)
- Romania Airport Wireless Infrastructure Market (2026-2032)
- Qatar Airport Wireless Infrastructure Market (2026-2032)
- Philippines Airport Wireless Infrastructure Market (2026-2032)
- Japan Airport Wireless Infrastructure Market (2026-2032)
- Taiwan Airport Winter Services Market (2026-2032)
- Vietnam Airport Winter Services Market (2026-2032)
Industry Events and Analyst Meet

HIMTEX 2026

India Refining Summit 2026

India EV Show 2026

EV tech India Expo 2026

Auto Tech Asia 2026
Whitepaper
- Middle East & Africa Commercial Security Market Click here to view more.
- Middle East & Africa Fire Safety Systems & Equipment Market Click here to view more.
- GCC Drone Market Click here to view more.
- Middle East Lighting Fixture Market Click here to view more.
- GCC Physical & Perimeter Security Market Click here to view more.