Czech Republic Interactive Tables Market (2026-2032) Outlook | Share, Forecast, Companies, Analysis, Revenue, Value, Trends, Size, Growth, Industry
Market Forecast By Technology (LCD, LED, Capacitive, Others), By Screen Size (32-65 Inch, 65 Inch & Above), By Application (Exhibition & Trade Shows, Education, Retail, Control Room, Hospitality, Transportation, Others) And Competitive Landscape
| Product Code: ETC275056 | Publication Date: Aug 2022 | Updated Date: Jul 2026 | Product Type: Market Research Report | |
| Publisher: 6Wresearch | Author: Ravi Bhandari | No. of Pages: 75 | No. of Figures: 35 | No. of Tables: 20 |
Czech Republic Interactive Tables Market Size, Share & Growth Rate
The Czech Republic Interactive Tables Market was estimated at USD 315 Million in 2025 and is projected to reach USD 436 Million by 2032, growing at a CAGR of 4.8% from 2026 to 2032. This robust growth trajectory is primarily fueled by the increasing integration of technology in education and corporate settings, where the demand for interactive and engaging solutions is paramount. As organizations strive to enhance collaboration and presentation capabilities, the adoption of interactive tables is becoming more critical to meeting these objectives.
Czech Republic Interactive Tables Market Year-wise Growth Rate and Key Drivers
This graph highlights how the Czech Republic Interactive Tables Market has steadily grown over the years, supported by major growth factors.
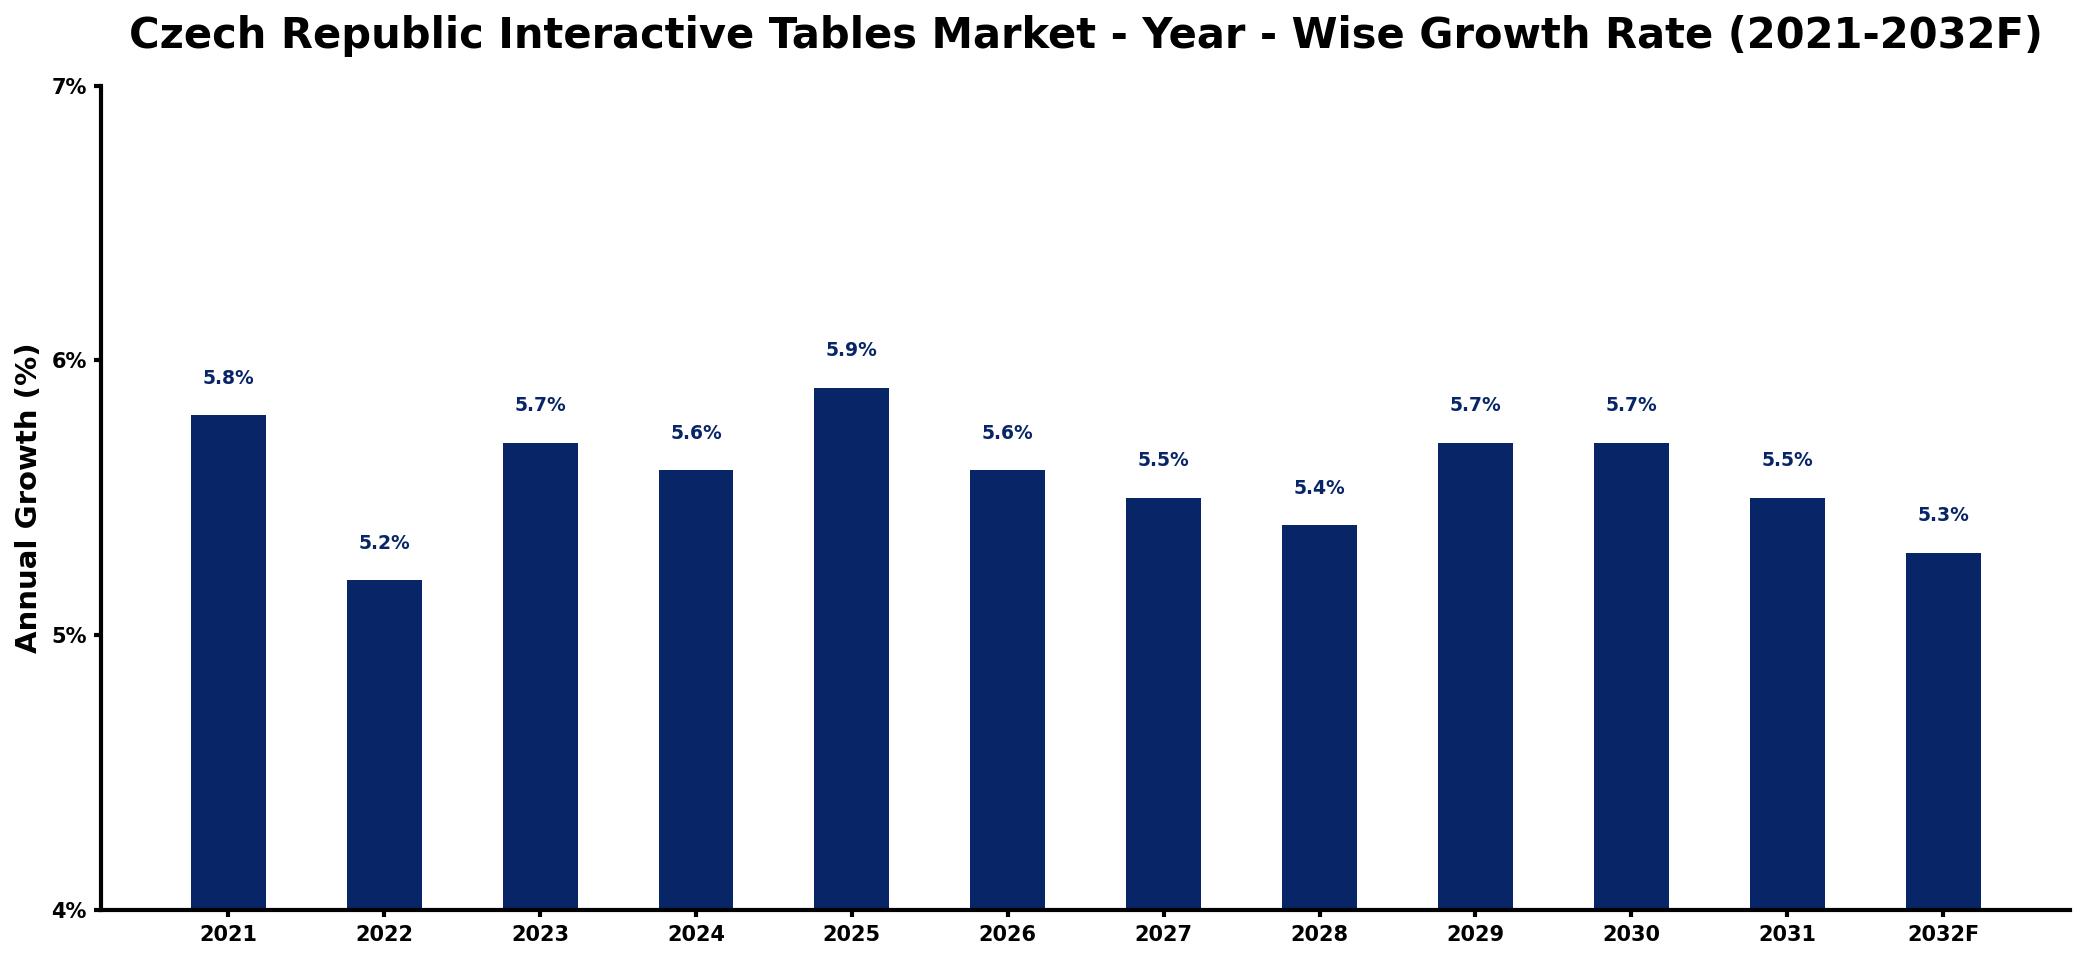
The table below presents the year‑wise growth rates along with the key drivers influencing the market
| Year | Growth Rate | Major Drivers |
| 2021 | 5.8% | Rising demand for digital solutions |
| 2022 | 5.2% | Increased investments in technology |
| 2023 | 5.7% | Growing adoption in education sector |
| 2024 | 5.6% | Expansion of smart office environments |
| 2025 | 5.9% | Surge in hospitality technology upgrades |
| 2026 | 5.6% | Enhanced user engagement strategies |
| 2027 | 5.5% | Strengthened focus on remote collaboration |
| 2028 | 5.4% | Broadening applications in retail spaces |
| 2029 | 5.7% | Growing interest in experiential marketing |
| 2030 | 5.7% | Increased integration with IoT devices |
| 2031 | 5.5% | rising infrastructure development spending |
| 2032 | 5.3% | Rising emphasis on sustainability initiatives |
Note: Market size estimations and growth projections presented in this report are based on 6Wresearch's proprietary forecasting methodology, utilizing the latest available industry data, government publications, and primary research inputs.
Czech Republic Interactive Tables Market Synopsis
The strongest force shaping the Czech Republic Interactive Tables Market is the surge in demand for collaborative tools within educational institutions and corporate environments. As schools and businesses embrace innovative teaching and meeting methods, the need for interactive tables has escalated, promoting a more engaging user experience.
Additionally, public awareness around the benefits of digital learning tools is rising, further driving the market. Institutions are increasingly recognizing that interactive tables not only enhance learning experiences but also foster more effective teamwork and customer interactions in retail environments.
Czech Republic Interactive Tables Market Key Takeaways
- The market is projected to see significant growth due to increasing technology adoption across educational and corporate sectors.
- Collaborative engagement is emerging as a crucial factor driving demand for interactive tables in various environments.
- Government initiatives supporting digital learning are expected to bolster market expansion.
- The integration of advanced technologies is essential for creating compelling interactive experiences.
- Manufacturers face challenges related to production costs and fluctuating market demand.
Evaluation of Restraints in Czech Republic Interactive Tables Market
Despite the promising growth of the interactive tables market, several restraints could impede progress. One significant barrier is the high production costs associated with developing advanced interactive table technologies. This challenge is compounded by the complexity of integrating sophisticated features into the designs. Furthermore, the inconsistency of market demand can create difficulties for manufacturers, making it hard to maintain steady production levels. As a result, while opportunities abound, industry players must navigate these constraints to capitalize on the market's potential.
Czech Republic Interactive Tables Market Trends
Current trends indicate an increasing focus on creating immersive and interactive content tailored for diverse applications in education, corporate training, and retail. The development of more intuitive user interfaces and connectivity options is expected to enhance user experiences significantly. Additionally, there is a notable shift toward integrating artificial intelligence and machine learning capabilities into interactive tables, which can provide customized solutions for users and further drive engagement.
Czech Republic Interactive Tables Market Opportunities
As the demand for interactive learning and collaboration continues to rise, ample opportunities exist for businesses to innovate within the Czech Republic Interactive Tables Market. Investments in research and development focused on enhancing usability and functionality will be essential. Moreover, partnerships between educational institutions and technology providers could lead to tailored solutions that meet specific needs, thus unlocking further growth potential in this evolving landscape.
Government Initiatives in the Czech Republic Interactive Tables Market
The Czech government has been proactive in promoting digital learning and collaboration through various initiatives. Policies that encourage the integration of technology in educational settings are driving demand for interactive tables across schools and corporate training environments. Furthermore, public funding and support for research projects aimed at improving collaborative technologies are fostering innovation within the sector, enhancing the overall market landscape.
Future Insights of the Czech Republic Interactive Tables Market
Looking ahead to the period from 2026 to 2032, the Czech Republic Interactive Tables Market is expected to experience steady growth driven by technological advancements and an increased emphasis on collaboration across various sectors. With institutions increasingly prioritizing interactive solutions, investment in these technologies will likely flourish. The market is poised for expansion as companies and educational facilities alike seek to leverage interactive tables to improve user engagement and collaboration.
Czech Republic Interactive Tables Market Latest Developments (2025 - 2026)
Recently, the industry has seen notable shifts toward enhancing user interface designs and integrating more advanced features within interactive tables. There has been a growing emphasis on creating multifunctional tables capable of serving diverse needs in educational and corporate settings. Additionally, increased collaboration between technology developers and educational institutions is paving the way for tailored solutions that cater specifically to the evolving demands of users.
Czech Republic Interactive Tables Market - Key Attractiveness of the Report
- 10 Years of Market Numbers
- Historical Data Starting from 2022 to 2025
- Base Year: 2025
- Forecast Data until 2032
- Key Performance Indicators Impacting the Market
- Major Upcoming Developments and Projects
Key Highlights of the Report:
- Czech Republic Interactive Tables Market Outlook
- Market Size of Czech Republic Interactive Tables Market, 2025
- Forecast of Czech Republic Interactive Tables Market, 2032
- Historical Data and Forecast of Czech Republic Interactive Tables Revenues & Volume for the Period 2022-2032F
- Czech Republic Interactive Tables Market Trend Evolution
- Czech Republic Interactive Tables Market Drivers and Challenges
- Czech Republic Interactive Tables Price Trends
- Czech Republic Interactive Tables Porter's Five Forces
- Czech Republic Interactive Tables Industry Life Cycle
- Historical Data and Forecast of Czech Republic Interactive Tables Market Revenues & Volume By Technology for the Period 2022-2032F
- Historical Data and Forecast of Czech Republic Interactive Tables Market Revenues & Volume By LCD for the Period 2022-2032F
- Historical Data and Forecast of Czech Republic Interactive Tables Market Revenues & Volume By LED for the Period 2022-2032F
- Historical Data and Forecast of Czech Republic Interactive Tables Market Revenues & Volume By Capacitive for the Period 2022-2032F
- Historical Data and Forecast of Czech Republic Interactive Tables Market Revenues & Volume By Others for the Period 2022-2032F
- Historical Data and Forecast of Czech Republic Interactive Tables Market Revenues & Volume By Screen Size for the Period 2022-2032F
- Historical Data and Forecast of Czech Republic Interactive Tables Market Revenues & Volume By 32-65 Inch for the Period 2022-2032F
- Historical Data and Forecast of Czech Republic Interactive Tables Market Revenues & Volume By 65 Inch & Above for the Period 2022-2032F
- Historical Data and Forecast of Czech Republic Interactive Tables Market Revenues & Volume By Application for the Period 2022-2032F
- Historical Data and Forecast of Czech Republic Interactive Tables Market Revenues & Volume By Exhibition & Trade Shows for the Period 2022-2032F
- Historical Data and Forecast of Czech Republic Interactive Tables Market Revenues & Volume By Education for the Period 2022-2032F
- Historical Data and Forecast of Czech Republic Interactive Tables Market Revenues & Volume By Retail for the Period 2022-2032F
- Historical Data and Forecast of Czech Republic Interactive Tables Market Revenues & Volume By Control Room for the Period 2022-2032F
- Historical Data and Forecast of Czech Republic Interactive Tables Market Revenues & Volume By Hospitality for the Period 2022-2032F
- Historical Data and Forecast of Czech Republic Interactive Tables Market Revenues & Volume By Transportation for the Period 2022-2032F
- Historical Data and Forecast of Czech Republic Interactive Tables Market Revenues & Volume By Others for the Period 2022-2032F
- Czech Republic Interactive Tables Import Export Trade Statistics
- Market Opportunity Assessment By Technology
- Market Opportunity Assessment By Screen Size
- Market Opportunity Assessment By Application
- Czech Republic Interactive Tables Top Companies Market Share
- Czech Republic Interactive Tables Competitive Benchmarking By Technical and Operational Parameters
- Czech Republic Interactive Tables Company Profiles
- Czech Republic Interactive Tables Key Strategic Recommendations
Frequently Asked Questions About the Market Study (FAQs):
The demand for interactive tables is primarily driven by the growing emphasis on collaboration and engagement in educational and corporate settings. Institutions are increasingly adopting interactive tables to enhance learning and improve group interactions.
The Czech Republic Interactive Tables Market was estimated at USD 315 Million in 2025, with projections reaching USD 436 Million by 2032, growing at a CAGR of 4.8% from 2026 to 2032, reflecting robust market potential.
Technology integration is critical as it enhances the functionality and user experience of interactive tables, making them more appealing for educational and corporate use. The rise of AI and machine learning is set to further enrich these technologies.
Yes, the Czech government is actively promoting digital learning through policies that encourage technology integration in schools and public funding for research on collaborative technologies, fostering market growth.
Manufacturers grapple with high production costs and the complexities of integrating advanced technologies into designs, alongside the inconsistency of market demand, which complicates production planning.
6Wresearch actively monitors the Czech Republic Interactive Tables Market and publishes its comprehensive annual report, highlighting emerging trends, growth drivers, revenue analysis, and forecast outlook. Our insights help businesses to make data-backed strategic decisions with ongoing market dynamics. Our analysts track relevent industries related to the Czech Republic Interactive Tables Market, allowing our clients with actionable intelligence and reliable forecasts tailored to emerging regional needs.
Yes, we provide customisation as per your requirements. To learn more, feel free to contact us on sales@6wresearch.com
1 Executive Summary |
2 Introduction |
2.1 Key Highlights of the Report |
2.2 Report Description |
2.3 Market Scope & Segmentation |
2.4 Research Methodology |
2.5 Assumptions |
3 Czech Republic Interactive Tables Market Overview |
3.1 Czech Republic Country Macro Economic Indicators |
3.2 Czech Republic Interactive Tables Market Revenues & Volume, 2022 & 2032F |
3.3 Czech Republic Interactive Tables Market - Industry Life Cycle |
3.4 Czech Republic Interactive Tables Market - Porter's Five Forces |
3.5 Czech Republic Interactive Tables Market Revenues & Volume Share, By Technology, 2022 & 2032F |
3.6 Czech Republic Interactive Tables Market Revenues & Volume Share, By Screen Size, 2022 & 2032F |
3.7 Czech Republic Interactive Tables Market Revenues & Volume Share, By Application, 2022 & 2032F |
4 Czech Republic Interactive Tables Market Dynamics |
4.1 Impact Analysis |
4.2 Market Drivers |
4.2.1 Increasing demand for interactive and digital learning solutions in educational institutions |
4.2.2 Rising adoption of interactive tables in corporate offices for enhanced collaboration and productivity |
4.2.3 Growing trend of interactive tables in hospitality sector to provide interactive experiences to customers |
4.3 Market Restraints |
4.3.1 High initial investment cost associated with interactive tables |
4.3.2 Limited awareness and understanding of the benefits of interactive tables among potential users |
4.3.3 Integration challenges with existing technologies and infrastructure in various sectors |
5 Czech Republic Interactive Tables Market Trends |
6 Czech Republic Interactive Tables Market, By Types |
6.1 Czech Republic Interactive Tables Market, By Technology |
6.1.1 Overview and Analysis |
6.1.2 Czech Republic Interactive Tables Market Revenues & Volume, By Technology, 2022-2032F |
6.1.3 Czech Republic Interactive Tables Market Revenues & Volume, By LCD, 2022-2032F |
6.1.4 Czech Republic Interactive Tables Market Revenues & Volume, By LED, 2022-2032F |
6.1.5 Czech Republic Interactive Tables Market Revenues & Volume, By Capacitive, 2022-2032F |
6.1.6 Czech Republic Interactive Tables Market Revenues & Volume, By Others, 2022-2032F |
6.2 Czech Republic Interactive Tables Market, By Screen Size |
6.2.1 Overview and Analysis |
6.2.2 Czech Republic Interactive Tables Market Revenues & Volume, By 32-65 Inch, 2022-2032F |
6.2.3 Czech Republic Interactive Tables Market Revenues & Volume, By 65 Inch & Above, 2022-2032F |
6.3 Czech Republic Interactive Tables Market, By Application |
6.3.1 Overview and Analysis |
6.3.2 Czech Republic Interactive Tables Market Revenues & Volume, By Exhibition & Trade Shows, 2022-2032F |
6.3.3 Czech Republic Interactive Tables Market Revenues & Volume, By Education, 2022-2032F |
6.3.4 Czech Republic Interactive Tables Market Revenues & Volume, By Retail, 2022-2032F |
6.3.5 Czech Republic Interactive Tables Market Revenues & Volume, By Control Room, 2022-2032F |
6.3.6 Czech Republic Interactive Tables Market Revenues & Volume, By Hospitality, 2022-2032F |
6.3.7 Czech Republic Interactive Tables Market Revenues & Volume, By Transportation, 2022-2032F |
7 Czech Republic Interactive Tables Market Import-Export Trade Statistics |
7.1 Czech Republic Interactive Tables Market Export to Major Countries |
7.2 Czech Republic Interactive Tables Market Imports from Major Countries |
8 Czech Republic Interactive Tables Market Key Performance Indicators |
8.1 Average time spent on interactive tables per user per session |
8.2 Percentage increase in the number of educational institutions using interactive tables |
8.3 Rate of adoption of interactive tables in corporate offices |
8.4 Number of interactive table installations in the hospitality sector |
8.5 Customer satisfaction scores related to the use of interactive tables |
9 Czech Republic Interactive Tables Market - Opportunity Assessment |
9.1 Czech Republic Interactive Tables Market Opportunity Assessment, By Technology, 2022 & 2032F |
9.2 Czech Republic Interactive Tables Market Opportunity Assessment, By Screen Size, 2022 & 2032F |
9.3 Czech Republic Interactive Tables Market Opportunity Assessment, By Application, 2022 & 2032F |
10 Czech Republic Interactive Tables Market - Competitive Landscape |
10.1 Czech Republic Interactive Tables Market Revenue Share, By Companies, 2025 |
10.2 Czech Republic Interactive Tables Market Competitive Benchmarking, By Operating and Technical Parameters |
11 Company Profiles |
12 Recommendations |
13 Disclaimer |
Global Go To Market Strategy - 2030
Export potential enables firms to identify high-growth global markets with greater confidence by combining advanced trade intelligence with a structured quantitative methodology. The framework analyzes emerging demand trends and country-level import patterns while integrating macroeconomic and trade datasets such as GDP and population forecasts, bilateral import–export flows, tariff structures, elasticity differentials between developed and developing economies, geographic distance, and import demand projections. Using weighted trade values from 2020–2024 as the base period to project country-to-country export potential for 2030, these inputs are operationalized through calculated drivers such as gravity model parameters, tariff impact factors, and projected GDP per-capita growth. Through an analysis of hidden potentials, demand hotspots, and market conditions that are most favorable to success, this method enables firms to focus on target countries, maximize returns, and global expansion with data, backed by accuracy.
By factoring in the projected importer demand gap that is currently unmet and could be potential opportunity, it identifies the potential for the Exporter (Country) among 190 countries, against the general trade analysis, which identifies the biggest importer or exporter.
To discover high-growth global markets and optimize your business strategy:
Click Here
Pricing
- Single User License$ 1,995
- Department License$ 2,400
- Site License$ 3,120
- Global License$ 3,795

Leadership Perspectives from Industry Events
Search
Thought Leadership and Analyst Meet


Our Clients
6WResearch In News
- India Air Conditioner Market Set for Strong Rebound in 2026 After Weather-Led Correction and GST-Driven Recovery: 6Wresearch
- ADAS in India: How Automatic Emergency Braking, Blind Spot Detection & Driver Monitoring are Transforming Road Safety
- Doha a strategic location for EV manufacturing hub: IPA Qatar
- Demand for luxury TVs surging in the GCC, says Samsung
- Empowering Growth: The Thriving Journey of Bangladesh’s Cable Industry
- Demand for luxury TVs surging in the GCC, says Samsung
Latest Reports
- Nicaragua RPG Gaming Market (2026-2032)
- New Zealand RPG Gaming Market (2026-2032)
- Netherlands RPG Gaming Market (2026-2032)
- Nauru RPG Gaming Market (2026-2032)
- Namibia RPG Gaming Market (2026-2032)
- Mozambique RPG Gaming Market (2026-2032)
- Montenegro RPG Gaming Market (2026-2032)
- Mongolia RPG Gaming Market (2026-2032)
- Monaco RPG Gaming Market (2026-2032)
- Micronesia RPG Gaming Market (2026-2032)
Industry Events and Analyst Meet

EV India Expo 2026

HIMTEX 2026

India Refining Summit 2026

India EV Show 2026

EV tech India Expo 2026
Whitepaper
- Middle East & Africa Commercial Security Market Click here to view more.
- Middle East & Africa Fire Safety Systems & Equipment Market Click here to view more.
- GCC Drone Market Click here to view more.
- Middle East Lighting Fixture Market Click here to view more.
- GCC Physical & Perimeter Security Market Click here to view more.