Denmark 3D Printing Filament Market (2026-2032) | Segmentation, Growth, Analysis, Size, Trends, Forecast, Companies, Value, Outlook, Share, Industry & Revenue
Market Forecast By Type (Plastics, Metals, Ceramics), By End Use Industry (Aerospace & Defense, Medical & Dental, Automotive, Electronics) And Competitive Landscape
| Product Code: ETC5725656 | Publication Date: Nov 2023 | Updated Date: Apr 2026 | Product Type: Market Research Report | |
| Publisher: 6Wresearch | Author: Ravi Bhandari | No. of Pages: 60 | No. of Figures: 30 | No. of Tables: 5 |
Denmark 3D Printing Filament Market Size (2020-2030)
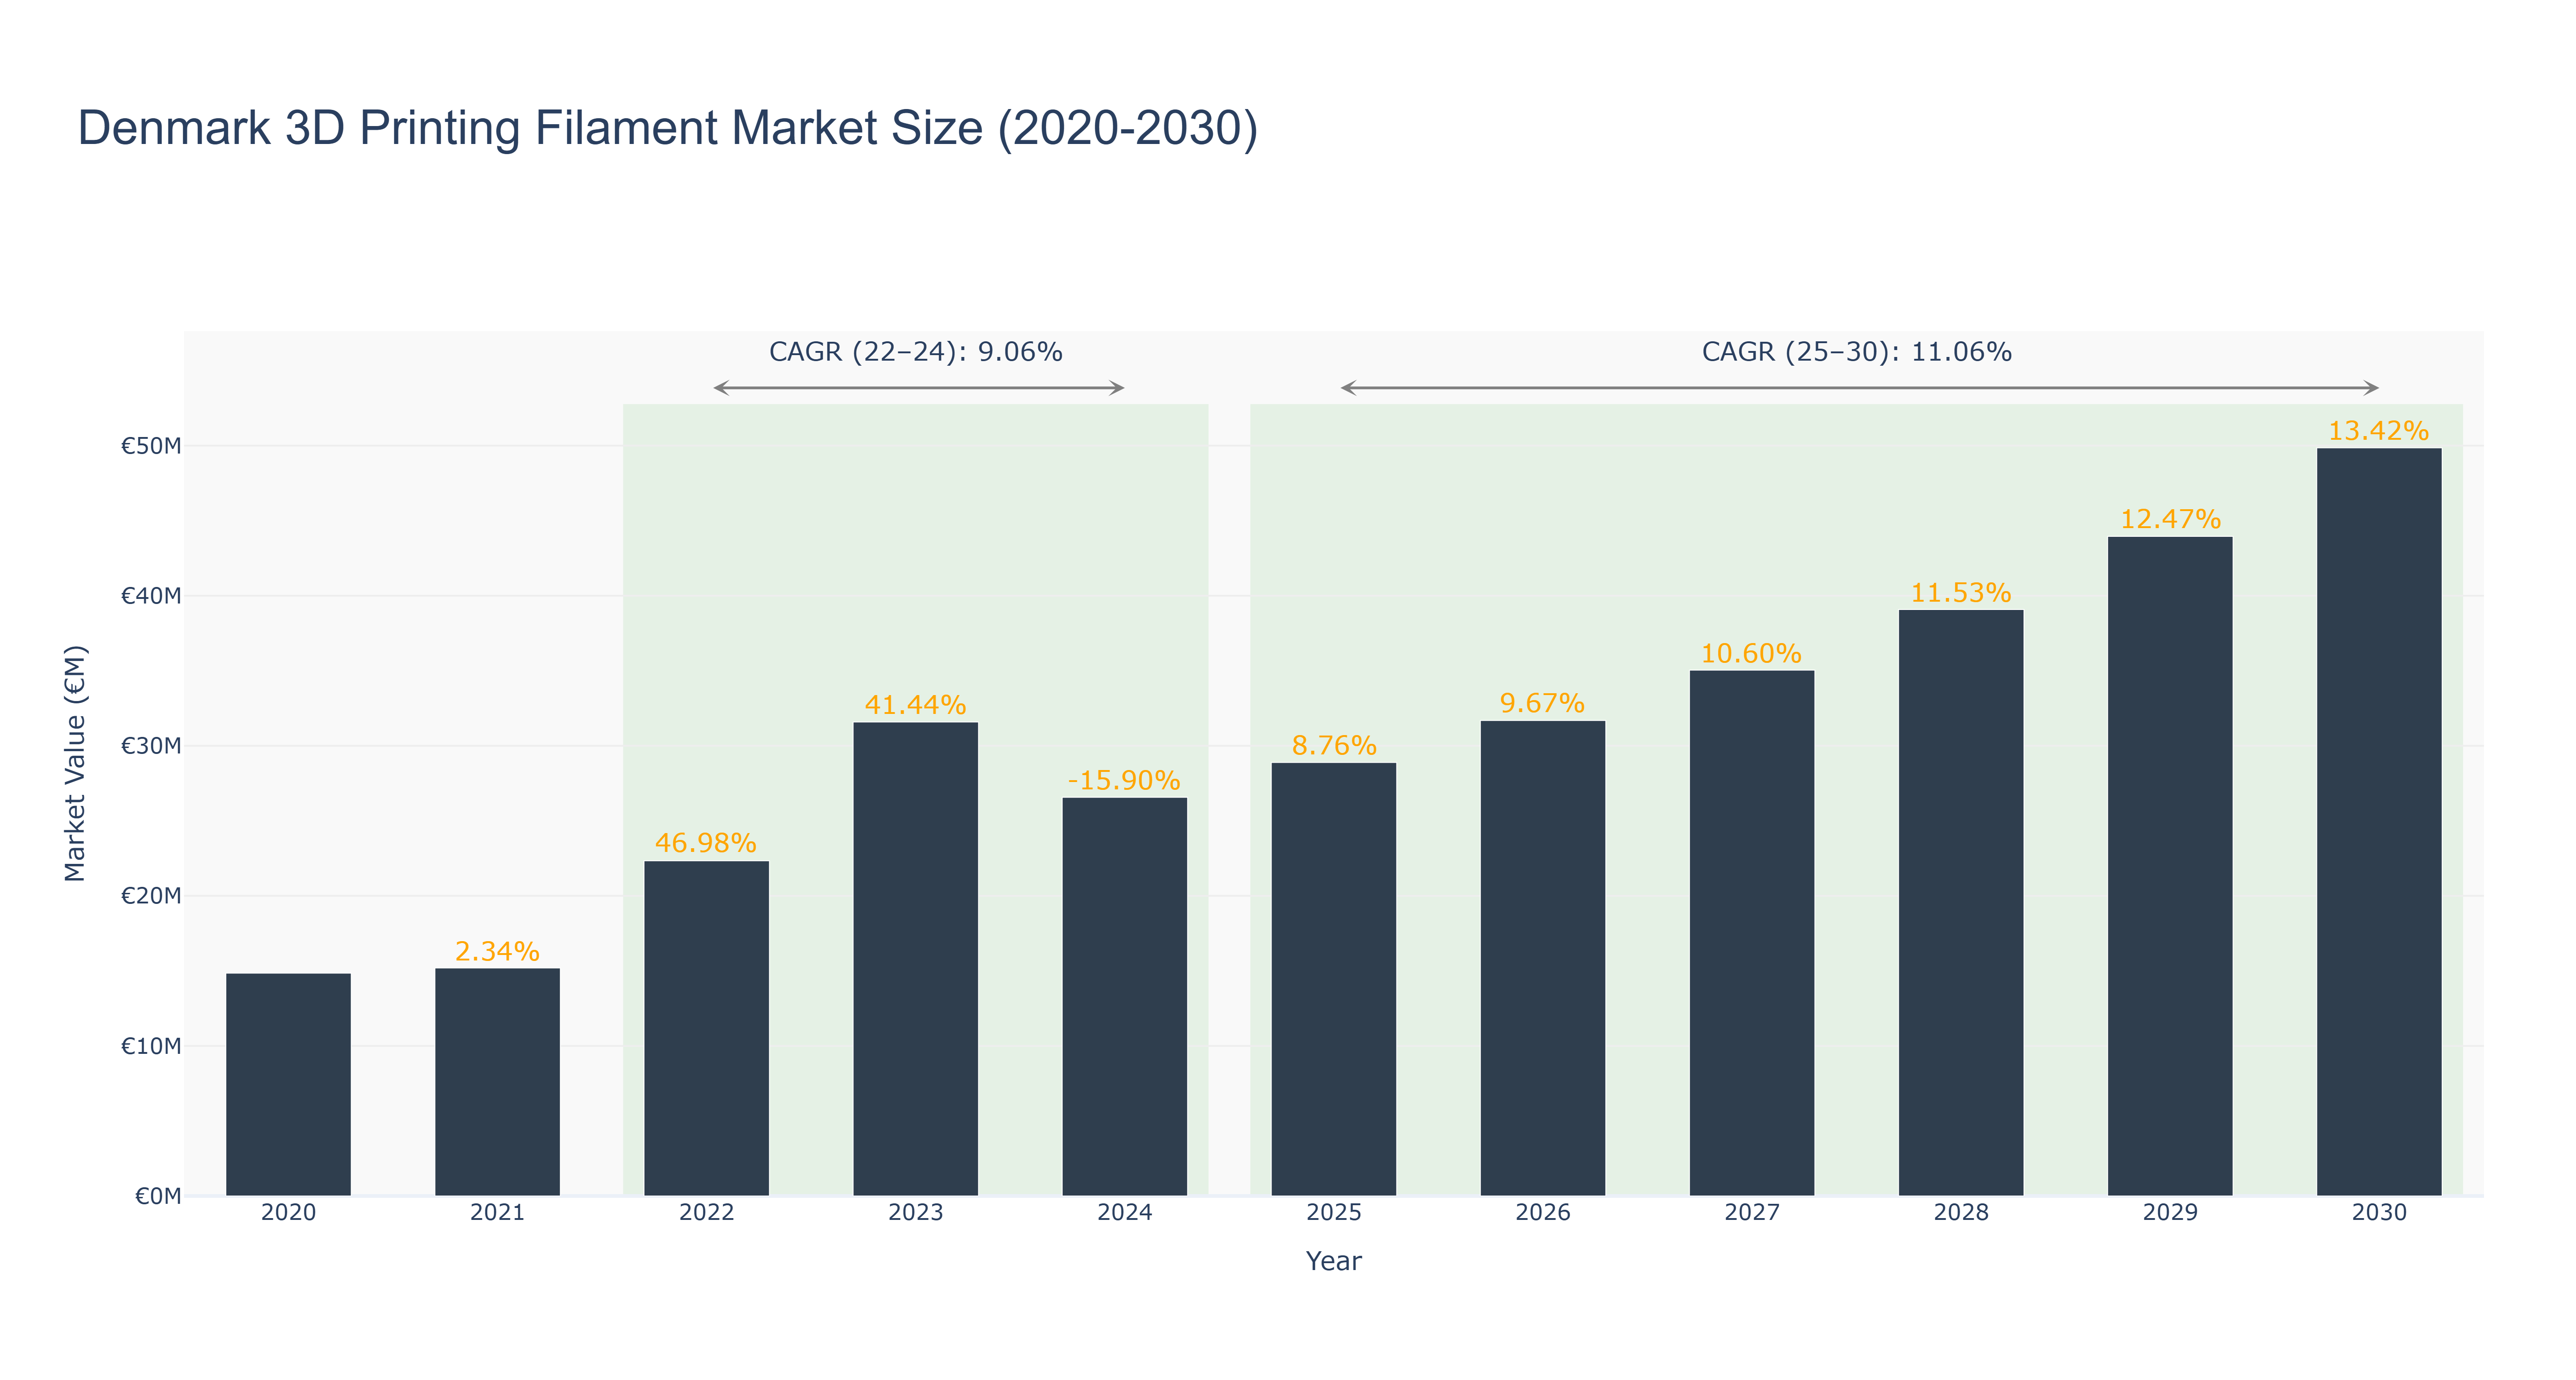
Denmark's 3D Printing Filament Market has shown a notable growth trajectory over the years. The market size peaked at €49.86 million in 2030, with a steady increase from €14.85 million in 2020. The market experienced a significant decline in 2024 to €26.57 million, attributed to a temporary market saturation and economic downturn. However, the market rebounded swiftly, reaching €28.89 million in 2025 and continued to grow steadily, with a forecasted size of €43.96 million in 2029. The market's CAGR from 2022-24 was 9.06%, reflecting a recovery phase, while the CAGR from 2025-30 is projected at 11.06%, indicating sustained growth. Industry drivers such as technological advancements and increased adoption of 3D printing technologies are fueling this growth. Looking ahead, Denmark is set to launch a national initiative promoting sustainable 3D printing practices, further boosting market expansion.
Denmark 3D Printing Filament Market: Production & Trade Performance (2019-2025)
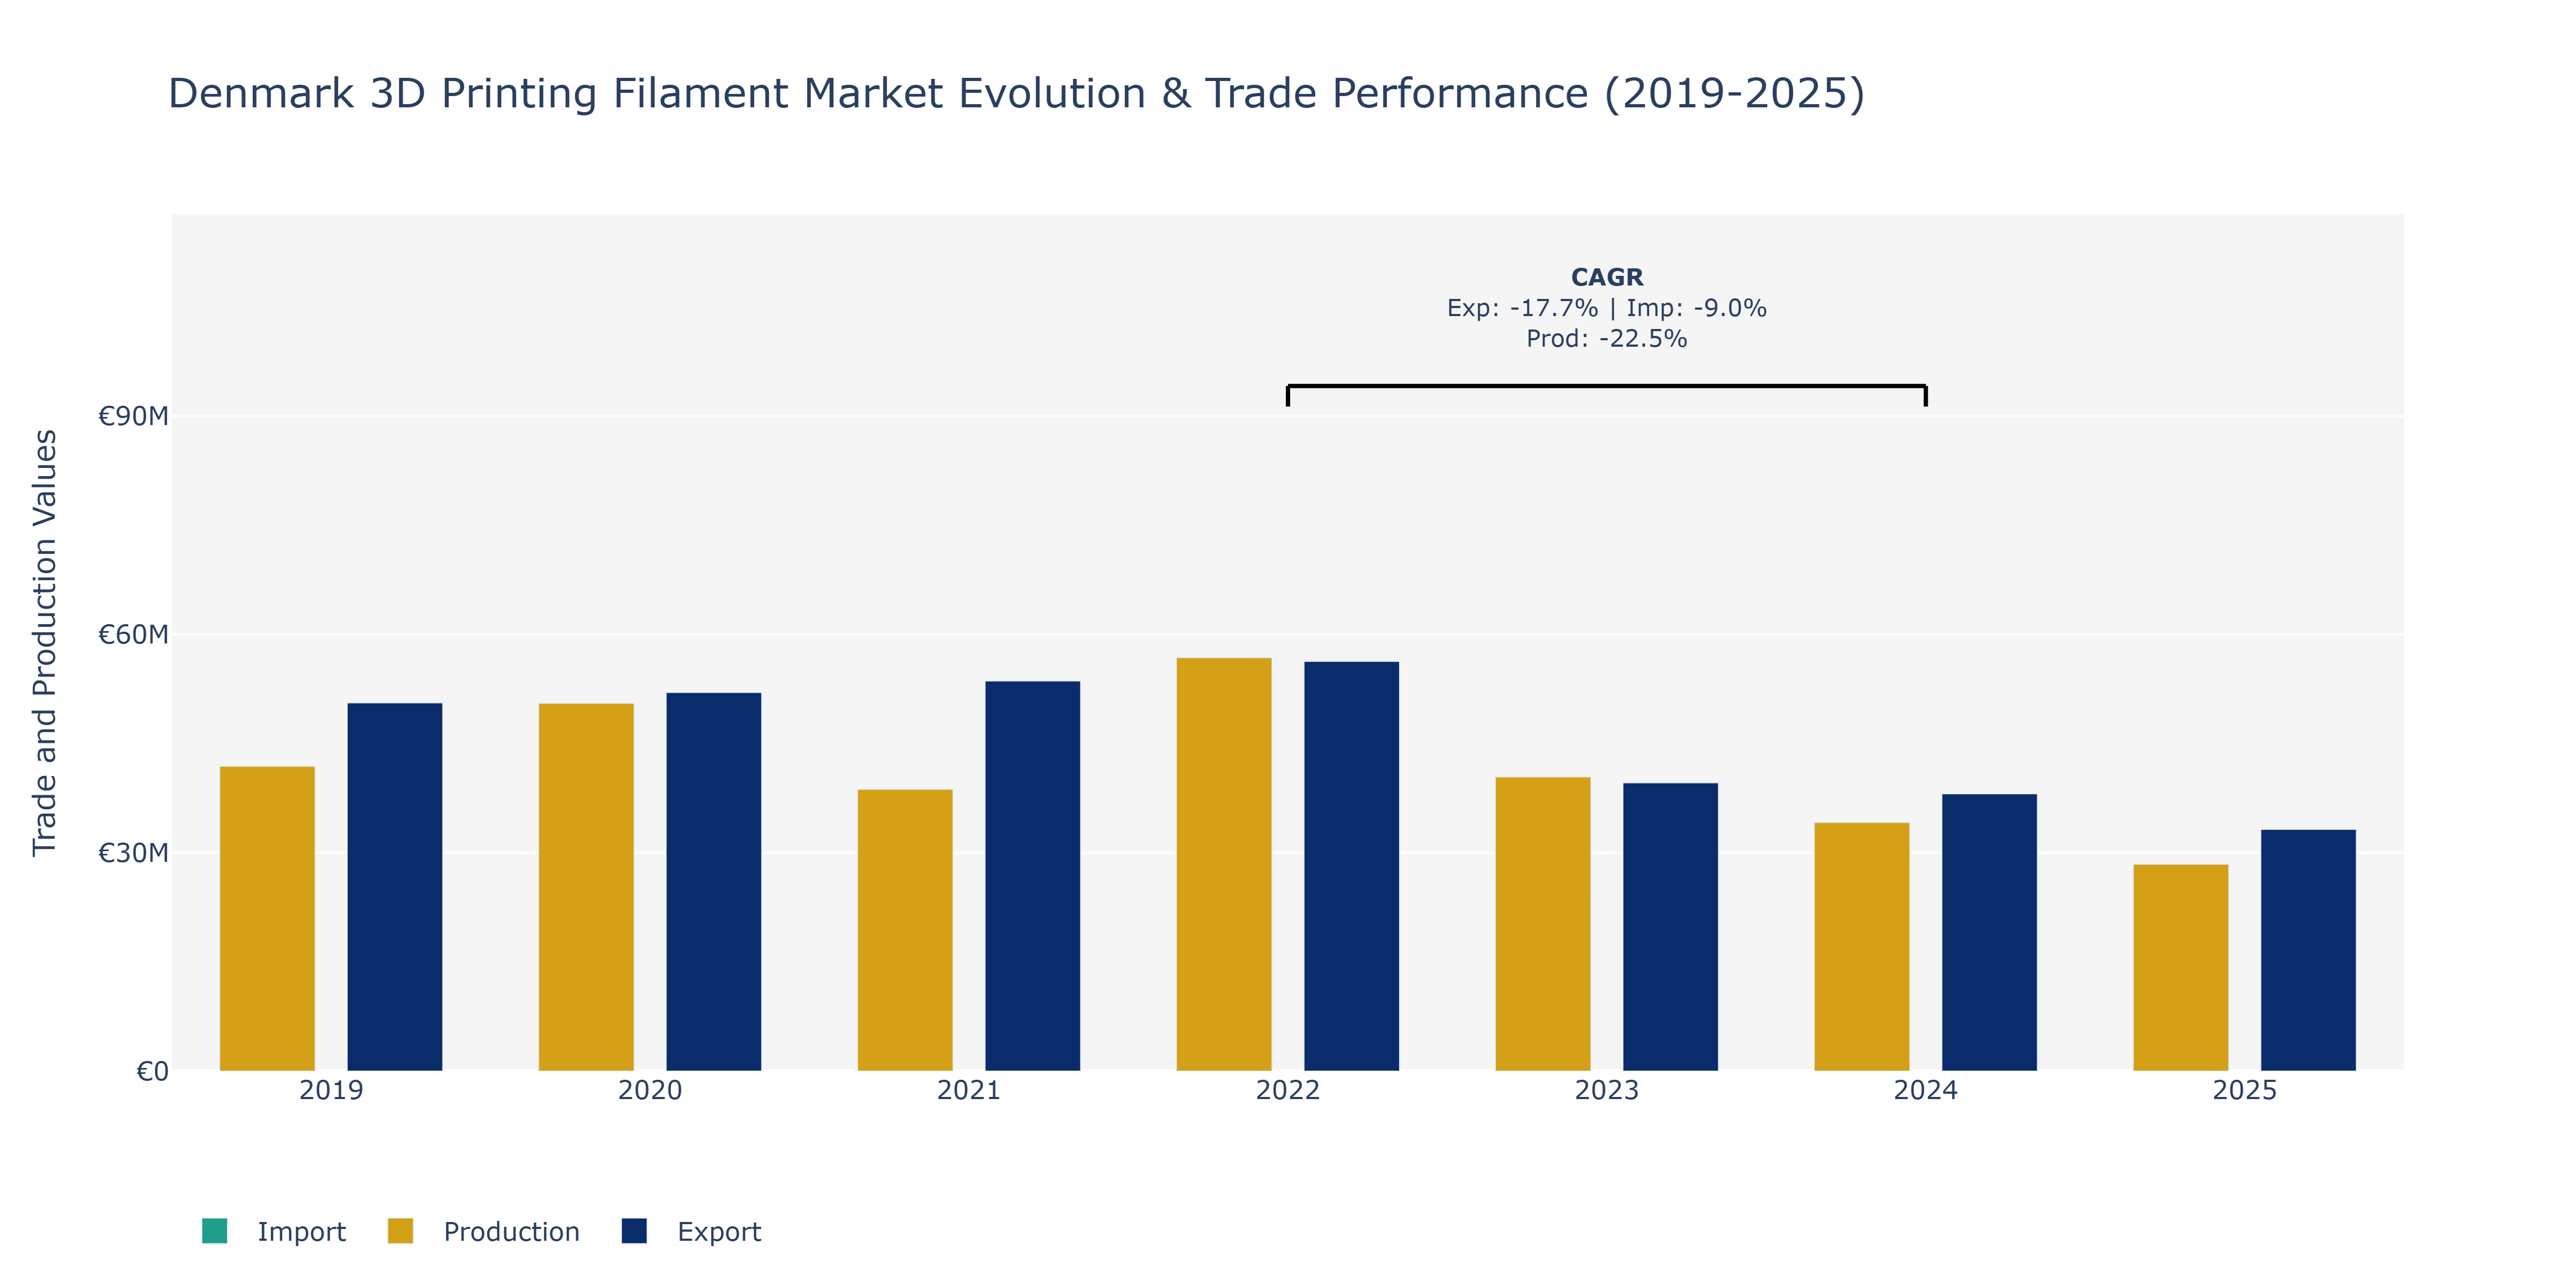
In the Denmark 3D Printing Filament Market, exports showed a fluctuating trend over the years, starting at €50.59 million in 2019, reaching a peak of €56.29 million in 2022, and then declining to €33.22 million in 2025. This downward trajectory from 2022 to 2025 could be attributed to evolving global market demands, competitive pricing strategies, and shifts in international trade dynamics impacting the 3D printing industry. Imports, on the other hand, consistently increased from €16.25 million in 2019 to €21.96 million in 2021, peaking at €27.22 million in 2022 before slightly decreasing in 2025 to €21.30 million. Such growth in imports may be driven by the need for raw materials or specialized filament types not readily available domestically. In terms of production, there was a notable decrease from €56.81 million in 2022 to €34.16 million in 2024, reflecting a challenging period for local manufacturers possibly influenced by supply chain disruptions, technological advancements, or changes in consumer preferences. These market dynamics emphasize the importance for stakeholders to closely monitor global trends and innovate to remain competitive in the evolving 3D printing filament landscape.
Key Highlights of the Report:
- Denmark 3D Printing Filament Market Outlook
- Market Size of Denmark 3D Printing Filament Market, 2025
- Forecast of Denmark 3D Printing Filament Market, 2032
- Historical Data and Forecast of Denmark 3D Printing Filament Revenues & Volume for the Period 2022 - 2032F
- Denmark 3D Printing Filament Market Trend Evolution
- Denmark 3D Printing Filament Market Drivers and Challenges
- Denmark 3D Printing Filament Price Trends
- Denmark 3D Printing Filament Porter`s Five Forces
- Denmark 3D Printing Filament Industry Life Cycle
- Historical Data and Forecast of Denmark 3D Printing Filament Market Revenues & Volume By Type for the Period 2022 - 2032F
- Historical Data and Forecast of Denmark 3D Printing Filament Market Revenues & Volume By Plastics for the Period 2022 - 2032F
- Historical Data and Forecast of Denmark 3D Printing Filament Market Revenues & Volume By Metals for the Period 2022 - 2032F
- Historical Data and Forecast of Denmark 3D Printing Filament Market Revenues & Volume By Ceramics for the Period 2022 - 2032F
- Historical Data and Forecast of Denmark 3D Printing Filament Market Revenues & Volume By End Use Industry for the Period 2022 - 2032F
- Historical Data and Forecast of Denmark 3D Printing Filament Market Revenues & Volume By Aerospace & Defense for the Period 2022 - 2032F
- Historical Data and Forecast of Denmark 3D Printing Filament Market Revenues & Volume By Medical & Dental for the Period 2022 - 2032F
- Historical Data and Forecast of Denmark 3D Printing Filament Market Revenues & Volume By Automotive for the Period 2022 - 2032F
- Historical Data and Forecast of Denmark 3D Printing Filament Market Revenues & Volume By Electronics for the Period 2022 - 2032F
- Denmark 3D Printing Filament Import Export Trade Statistics
- Market Opportunity Assessment By Type
- Market Opportunity Assessment By End Use Industry
- Denmark 3D Printing Filament Top Companies Market Share
- Denmark 3D Printing Filament Competitive Benchmarking By Technical and Operational Parameters
- Denmark 3D Printing Filament Company Profiles
- Denmark 3D Printing Filament Key Strategic Recommendations
Frequently Asked Questions About the Market Study (FAQs):
6Wresearch actively monitors the Denmark 3D Printing Filament Market and publishes its comprehensive annual report, highlighting emerging trends, growth drivers, revenue analysis, and forecast outlook. Our insights help businesses to make data-backed strategic decisions with ongoing market dynamics. Our analysts track relevent industries related to the Denmark 3D Printing Filament Market, allowing our clients with actionable intelligence and reliable forecasts tailored to emerging regional needs.
Yes, we provide customisation as per your requirements. To learn more, feel free to contact us on sales@6wresearch.com
1 Executive Summary |
2 Introduction |
2.1 Key Highlights of the Report |
2.2 Report Description |
2.3 Market Scope & Segmentation |
2.4 Research Methodology |
2.5 Assumptions |
3 Denmark 3D Printing Filament Market Overview |
3.1 Denmark Country Macro Economic Indicators |
3.2 Denmark 3D Printing Filament Market Revenues & Volume, 2022 & 2032F |
3.3 Denmark 3D Printing Filament Market - Industry Life Cycle |
3.4 Denmark 3D Printing Filament Market - Porter's Five Forces |
3.5 Denmark 3D Printing Filament Market Revenues & Volume Share, By Type, 2022 & 2032F |
3.6 Denmark 3D Printing Filament Market Revenues & Volume Share, By End Use Industry, 2022 & 2032F |
4 Denmark 3D Printing Filament Market Dynamics |
4.1 Impact Analysis |
4.2 Market Drivers |
4.2.1 Growing adoption of 3D printing technology in various industries |
4.2.2 Increasing demand for customized and high-quality 3D printed products |
4.2.3 Technological advancements leading to the development of new and improved 3D printing filaments |
4.3 Market Restraints |
4.3.1 High initial investment costs associated with 3D printing technology |
4.3.2 Limited availability of raw materials for 3D printing filaments |
4.3.3 Concerns regarding the environmental impact of 3D printing filaments |
5 Denmark 3D Printing Filament Market Trends |
6 Denmark 3D Printing Filament Market Segmentations |
6.1 Denmark 3D Printing Filament Market, By Type |
6.1.1 Overview and Analysis |
6.1.2 Denmark 3D Printing Filament Market Revenues & Volume, By Plastics, 2022 - 2032F |
6.1.3 Denmark 3D Printing Filament Market Revenues & Volume, By Metals, 2022 - 2032F |
6.1.4 Denmark 3D Printing Filament Market Revenues & Volume, By Ceramics, 2022 - 2032F |
6.2 Denmark 3D Printing Filament Market, By End Use Industry |
6.2.1 Overview and Analysis |
6.2.2 Denmark 3D Printing Filament Market Revenues & Volume, By Aerospace & Defense, 2022 - 2032F |
6.2.3 Denmark 3D Printing Filament Market Revenues & Volume, By Medical & Dental, 2022 - 2032F |
6.2.4 Denmark 3D Printing Filament Market Revenues & Volume, By Automotive, 2022 - 2032F |
6.2.5 Denmark 3D Printing Filament Market Revenues & Volume, By Electronics, 2022 - 2032F |
7 Denmark 3D Printing Filament Market Import-Export Trade Statistics |
7.1 Denmark 3D Printing Filament Market Export to Major Countries |
7.2 Denmark 3D Printing Filament Market Imports from Major Countries |
8 Denmark 3D Printing Filament Market Key Performance Indicators |
8.1 Average selling price of 3D printing filaments in Denmark |
8.2 Number of 3D printing filament manufacturers entering the market |
8.3 Rate of innovation in 3D printing filament materials and technologies |
8.4 Percentage of industrial adoption of 3D printing technology in Denmark |
8.5 Number of patents filed for new 3D printing filament technologies |
9 Denmark 3D Printing Filament Market - Opportunity Assessment |
9.1 Denmark 3D Printing Filament Market Opportunity Assessment, By Type, 2022 & 2032F |
9.2 Denmark 3D Printing Filament Market Opportunity Assessment, By End Use Industry, 2022 & 2032F |
10 Denmark 3D Printing Filament Market - Competitive Landscape |
10.1 Denmark 3D Printing Filament Market Revenue Share, By Companies, 2025 |
10.2 Denmark 3D Printing Filament Market Competitive Benchmarking, By Operating and Technical Parameters |
11 Company Profiles |
12 Recommendations | 13 Disclaimer |
Global Go To Market Strategy - 2030
Export potential enables firms to identify high-growth global markets with greater confidence by combining advanced trade intelligence with a structured quantitative methodology. The framework analyzes emerging demand trends and country-level import patterns while integrating macroeconomic and trade datasets such as GDP and population forecasts, bilateral import–export flows, tariff structures, elasticity differentials between developed and developing economies, geographic distance, and import demand projections. Using weighted trade values from 2020–2024 as the base period to project country-to-country export potential for 2030, these inputs are operationalized through calculated drivers such as gravity model parameters, tariff impact factors, and projected GDP per-capita growth. Through an analysis of hidden potentials, demand hotspots, and market conditions that are most favorable to success, this method enables firms to focus on target countries, maximize returns, and global expansion with data, backed by accuracy.
By factoring in the projected importer demand gap that is currently unmet and could be potential opportunity, it identifies the potential for the Exporter (Country) among 190 countries, against the general trade analysis, which identifies the biggest importer or exporter.
To discover high-growth global markets and optimize your business strategy:
Click Here
Pricing
- Single User License$ 1,995
- Department License$ 2,400
- Site License$ 3,120
- Global License$ 3,795

Leadership Perspectives from Industry Events
Search
Thought Leadership and Analyst Meet


Our Clients
6WResearch In News
- Doha a strategic location for EV manufacturing hub: IPA Qatar
- Demand for luxury TVs surging in the GCC, says Samsung
- Empowering Growth: The Thriving Journey of Bangladesh’s Cable Industry
- Demand for luxury TVs surging in the GCC, says Samsung
- Video call with a traditional healer? Once unthinkable, it’s now common in South Africa
- Intelligent Buildings To Smooth GCC’s Path To Net Zero
Latest Reports
- New Zealand Aseptic Manufacturing Market (2026-2032)
- Netherlands Aseptic Manufacturing Market (2026-2032)
- Nauru Aseptic Manufacturing Market (2026-2032)
- Namibia Aseptic Manufacturing Market (2026-2032)
- Mozambique Aseptic Manufacturing Market (2026-2032)
- Montenegro Aseptic Manufacturing Market (2026-2032)
- Mongolia Aseptic Manufacturing Market (2026-2032)
- Monaco Aseptic Manufacturing Market (2026-2032)
- Micronesia Aseptic Manufacturing Market (2026-2032)
- Mauritius Aseptic Manufacturing Market (2026-2032)
Industry Events and Analyst Meet

HIMTEX 2026

India Refining Summit 2026

India EV Show 2026

EV tech India Expo 2026

Auto Tech Asia 2026
Whitepaper
- Middle East & Africa Commercial Security Market Click here to view more.
- Middle East & Africa Fire Safety Systems & Equipment Market Click here to view more.
- GCC Drone Market Click here to view more.
- Middle East Lighting Fixture Market Click here to view more.
- GCC Physical & Perimeter Security Market Click here to view more.