Denmark Allopurinol Market (2026-2032) | Industry, Outlook, Competitive Landscape, Forecast, Value, Segmentation, Trends, Analysis, Growth, Size & Revenue, Companies, Share
Market Forecast By Drug Class (Antigout Agents, Antihyperuricemic Agents), By Application (Gout, Kidney Stones, Others, Demographic, Adult, Pediatric), By Dosage Form (Intravenous Powder for Injection, Oral Tablet), By End-Users (Clinic, Hospital, Others), By Distribution Channel (Hospital Pharmacy, Retail Pharmacy, Online Pharmacy) And Competitive Landscape
| Product Code: ETC6952533 | Publication Date: Sep 2024 | Updated Date: Apr 2026 | Product Type: Market Research Report | |
| Publisher: 6Wresearch | Author: Sumit Sagar | No. of Pages: 75 | No. of Figures: 35 | No. of Tables: 20 |
Denmark Allopurinol Market Size (2020-2030)
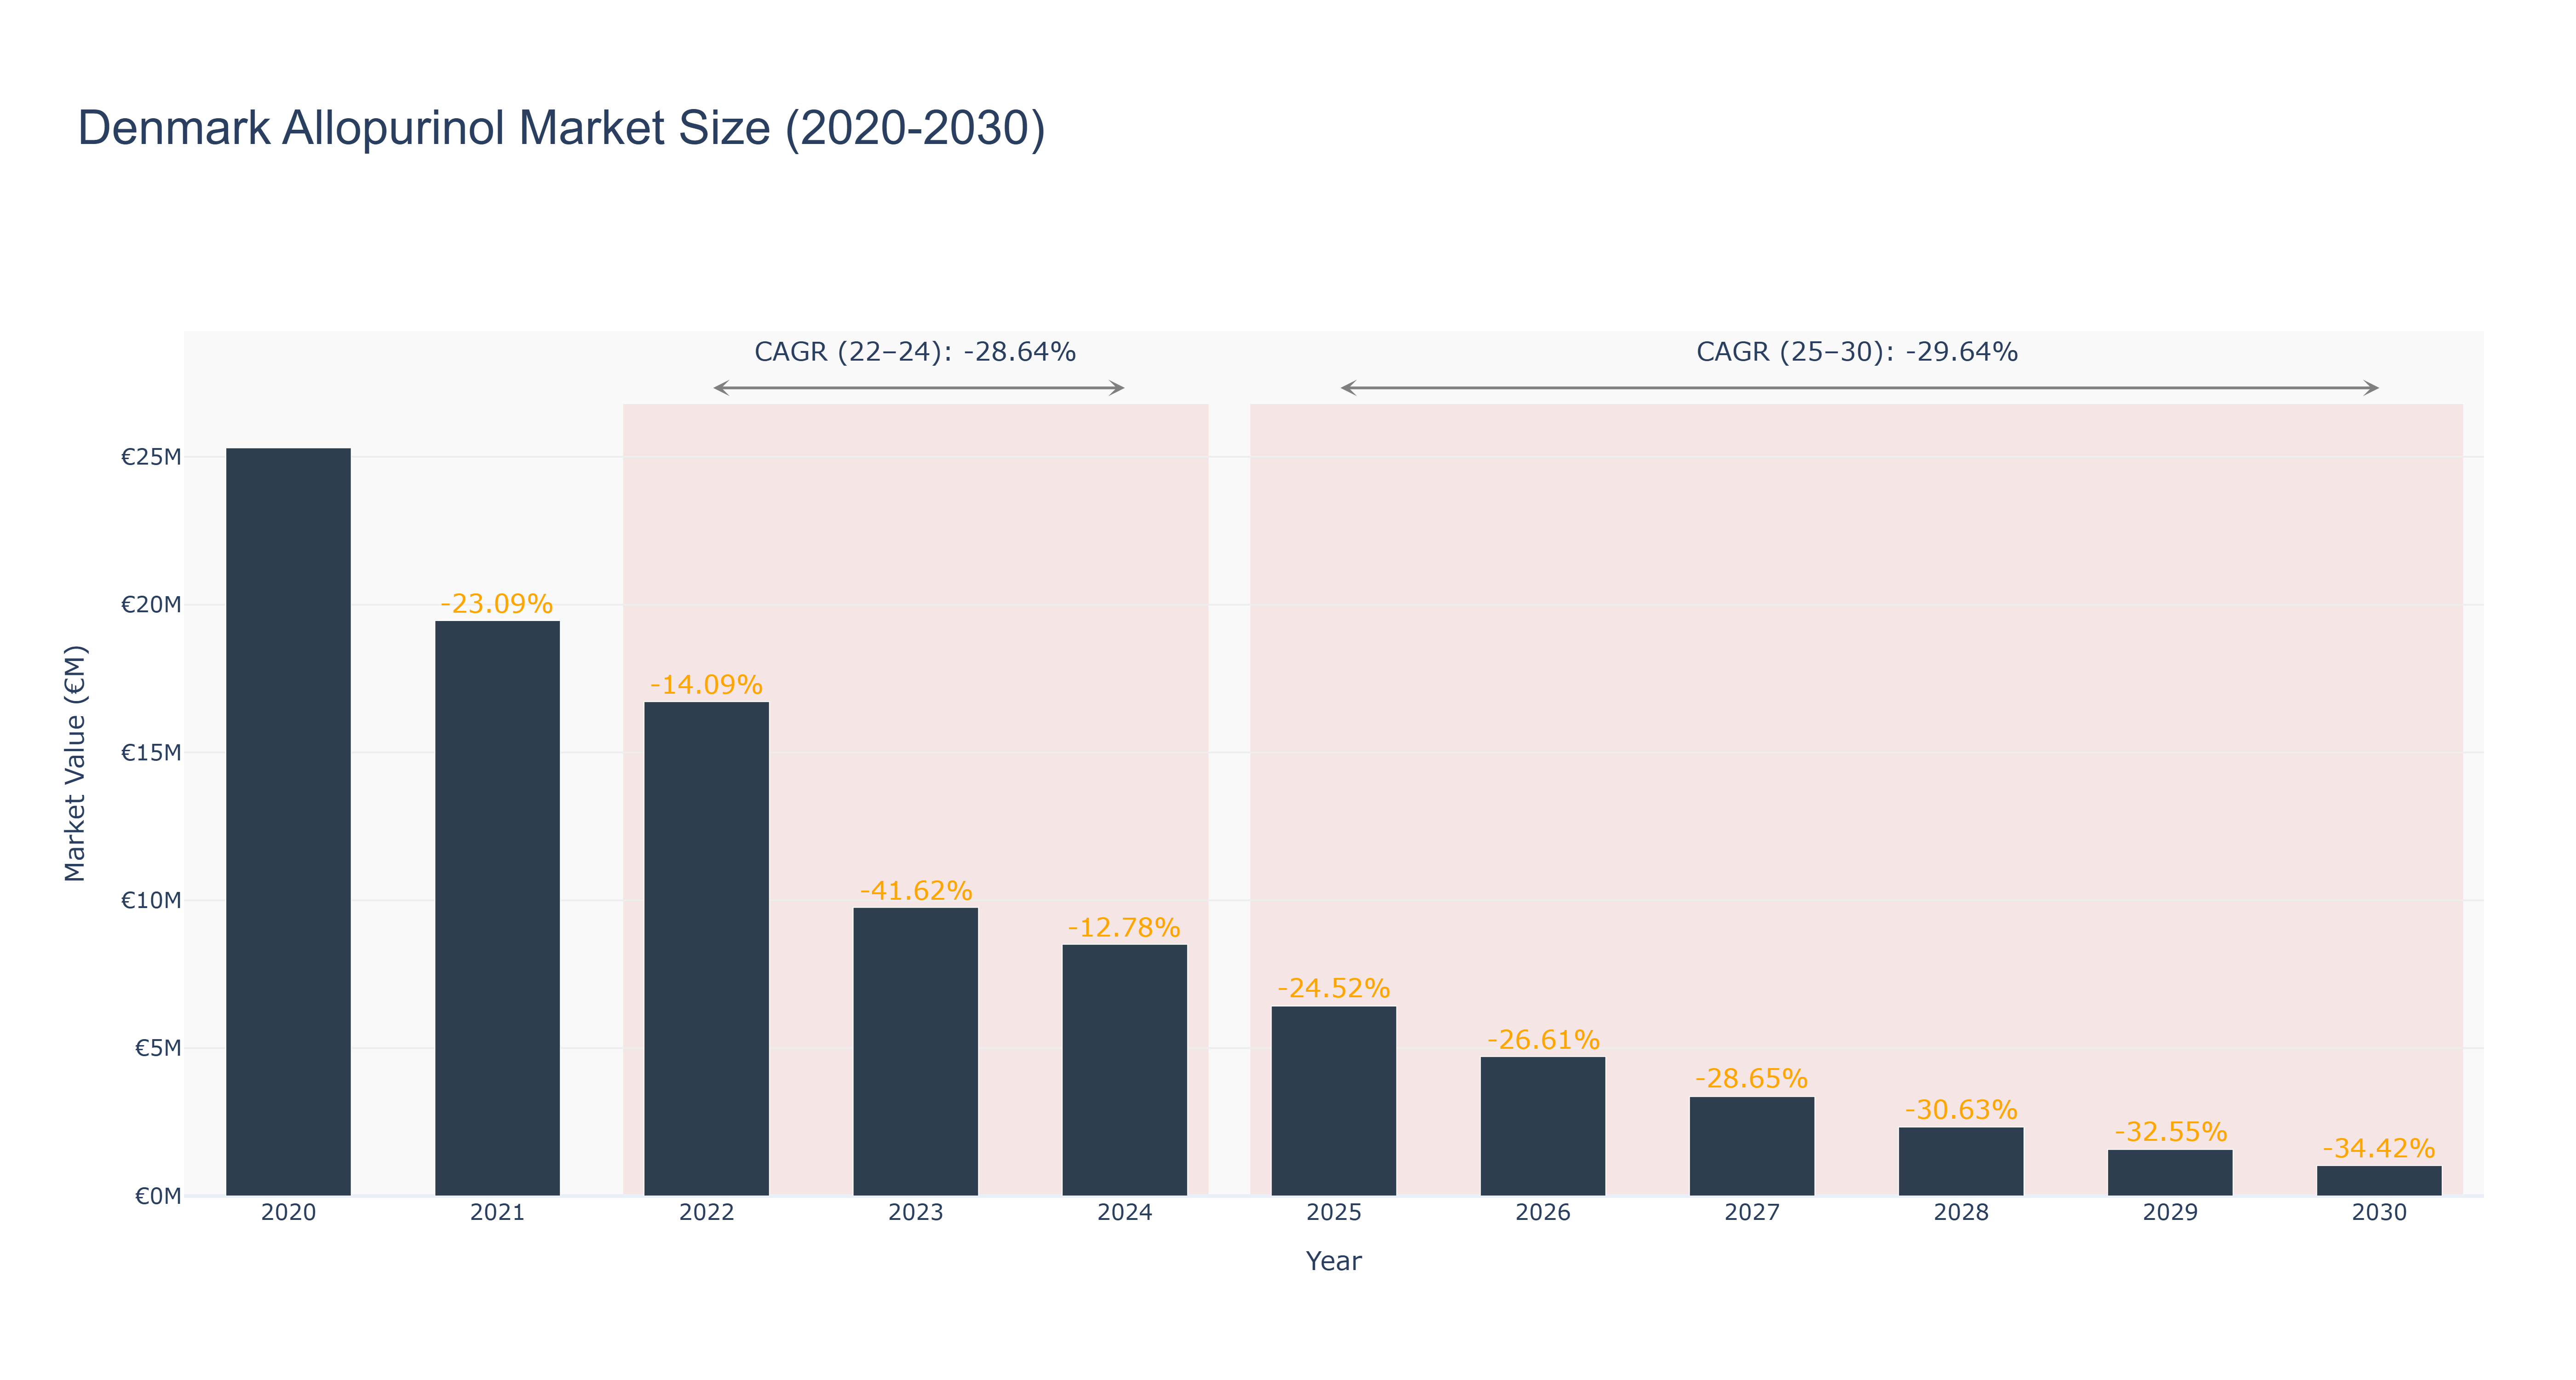
The Denmark Allopurinol Market experienced a peak market size of €25.31 million in 2020 before entering a decline, with actual values dropping to €16.72 million in 2022 and further down to €8.51 million in 2024, reflecting a compound annual growth rate (CAGR) of -28.64% over this period. The forecasted outlook from 2025 to 2030 indicates a continued contraction, with projected market sizes decreasing to €1.03 million by 2030 and a CAGR of -29.64%. This decline can be attributed to factors such as increased competition from alternative therapies, changing treatment guidelines, and a growing emphasis on personalized medicine. Additionally, the declining prevalence of conditions treated by Allopurinol may further exacerbate market challenges. Looking ahead, while no specific upcoming projects have been identified, macroeconomic trends and advancements in treatment options will likely shape the market dynamics in the coming years.
Denmark Allopurinol Market: Production & Trade Performance (2019-2025)
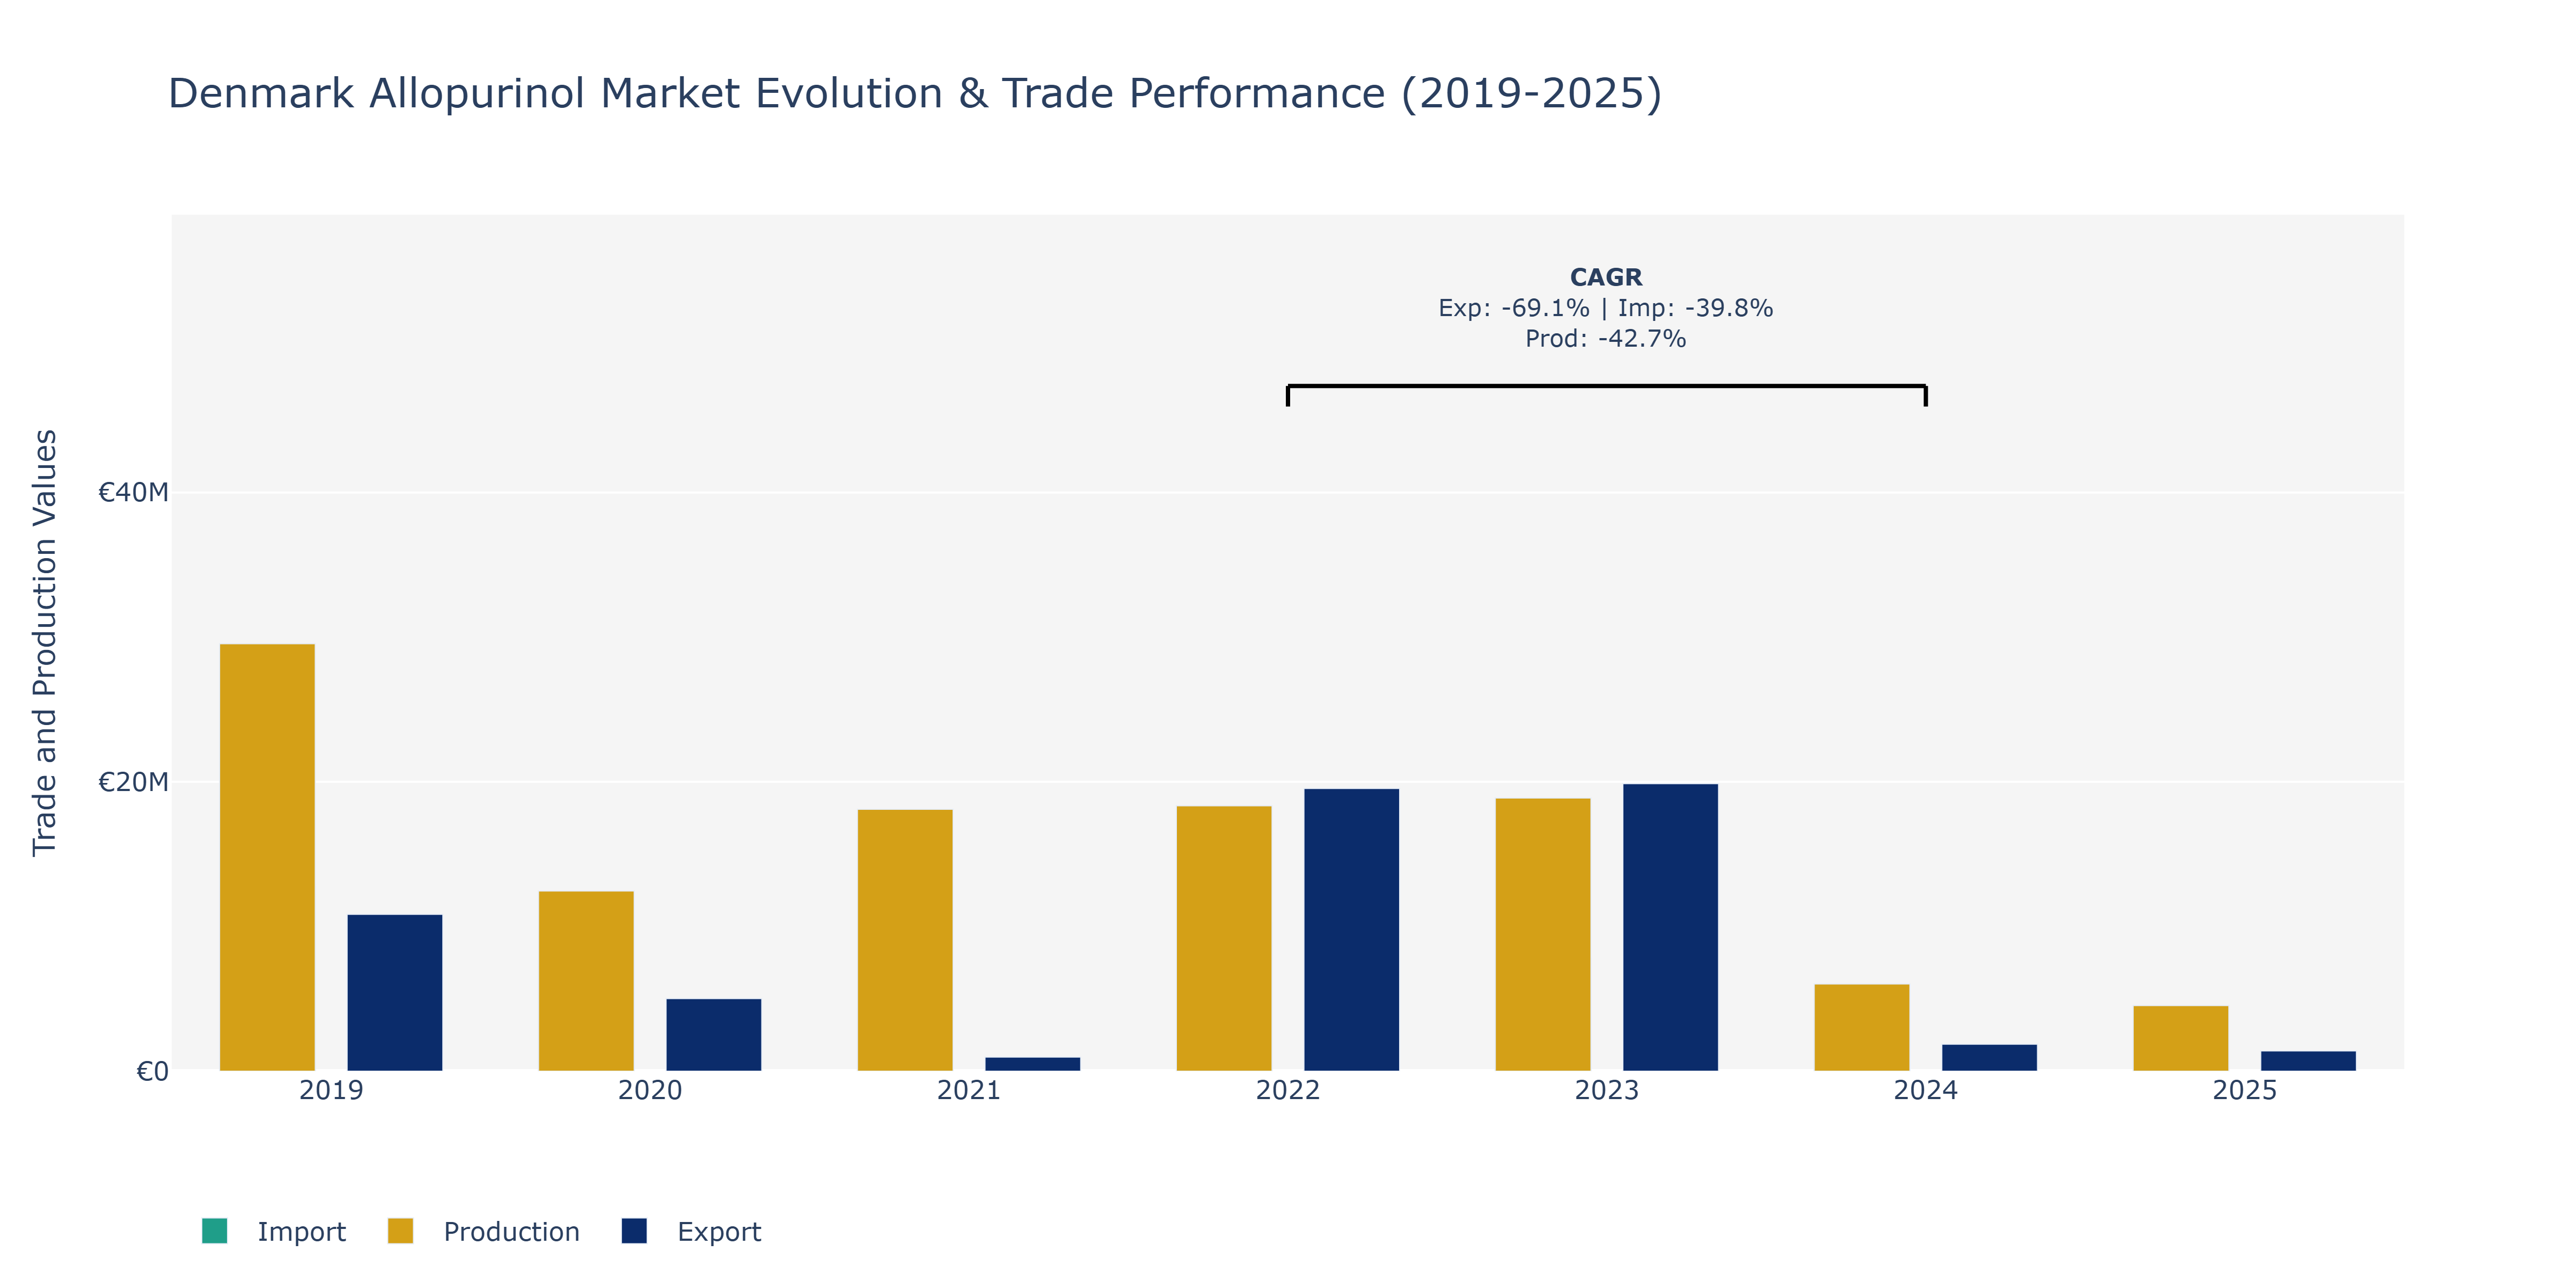
Between 2019 and 2025, the Denmark Allopurinol Market witnessed notable shifts in Exports, Imports, and Production. Exports saw a substantial decrease from €10.84 million in 2019 to around €1.4 million in 2025. This decline could be attributed to increased competition from other markets, changes in global demand, or shifts in pricing strategies. Imports followed a similar downward trend, decreasing from €12.74 million in 2019 to approximately €2.8 million in 2025, indicating a possible decrease in foreign sourcing or lower domestic demand. In contrast, Production showed a decrease from €29.5 million in 2019 to around €4.5 million in 2025, possibly reflecting changes in local manufacturing capabilities or technological advancements impacting production efficiencies. These fluctuations highlight the market's sensitivity to various internal and external factors, such as regulatory changes or evolving treatment preferences, underscoring the need for strategic market positioning and adaptation to sustain growth in the Denmark Allopurinol Market.
Key Highlights of the Report:
- Denmark Allopurinol Market Outlook
- Market Size of Denmark Allopurinol Market, 2025
- Forecast of Denmark Allopurinol Market, 2032
- Historical Data and Forecast of Denmark Allopurinol Revenues & Volume for the Period 2022 - 2032
- Denmark Allopurinol Market Trend Evolution
- Denmark Allopurinol Market Drivers and Challenges
- Denmark Allopurinol Price Trends
- Denmark Allopurinol Porter's Five Forces
- Denmark Allopurinol Industry Life Cycle
- Historical Data and Forecast of Denmark Allopurinol Market Revenues & Volume By Drug Class for the Period 2022 - 2032
- Historical Data and Forecast of Denmark Allopurinol Market Revenues & Volume By Antigout Agents for the Period 2022 - 2032
- Historical Data and Forecast of Denmark Allopurinol Market Revenues & Volume By Antihyperuricemic Agents for the Period 2022 - 2032
- Historical Data and Forecast of Denmark Allopurinol Market Revenues & Volume By Application for the Period 2022 - 2032
- Historical Data and Forecast of Denmark Allopurinol Market Revenues & Volume By Gout for the Period 2022 - 2032
- Historical Data and Forecast of Denmark Allopurinol Market Revenues & Volume By Kidney Stones for the Period 2022 - 2032
- Historical Data and Forecast of Denmark Allopurinol Market Revenues & Volume By Others for the Period 2022 - 2032
- Historical Data and Forecast of Denmark Allopurinol Market Revenues & Volume By Demographic for the Period 2022 - 2032
- Historical Data and Forecast of Denmark Allopurinol Market Revenues & Volume By Adult for the Period 2022 - 2032
- Historical Data and Forecast of Denmark Allopurinol Market Revenues & Volume By Pediatric for the Period 2022 - 2032
- Historical Data and Forecast of Denmark Allopurinol Market Revenues & Volume By Dosage Form for the Period 2022 - 2032
- Historical Data and Forecast of Denmark Allopurinol Market Revenues & Volume By Intravenous Powder for Injection for the Period 2022 - 2032
- Historical Data and Forecast of Denmark Allopurinol Market Revenues & Volume By Oral Tablet for the Period 2022 - 2032
- Historical Data and Forecast of Denmark Allopurinol Market Revenues & Volume By End-Users for the Period 2022 - 2032
- Historical Data and Forecast of Denmark Allopurinol Market Revenues & Volume By Clinic for the Period 2022 - 2032
- Historical Data and Forecast of Denmark Allopurinol Market Revenues & Volume By Hospital for the Period 2022 - 2032
- Historical Data and Forecast of Denmark Allopurinol Market Revenues & Volume By Others for the Period 2022 - 2032
- Historical Data and Forecast of Denmark Allopurinol Market Revenues & Volume By Distribution Channel for the Period 2022 - 2032
- Historical Data and Forecast of Denmark Allopurinol Market Revenues & Volume By Hospital Pharmacy for the Period 2022 - 2032
- Historical Data and Forecast of Denmark Allopurinol Market Revenues & Volume By Retail Pharmacy for the Period 2022 - 2032
- Historical Data and Forecast of Denmark Allopurinol Market Revenues & Volume By Online Pharmacy for the Period 2022 - 2032
- Denmark Allopurinol Import Export Trade Statistics
- Market Opportunity Assessment By Drug Class
- Market Opportunity Assessment By Application
- Market Opportunity Assessment By Dosage Form
- Market Opportunity Assessment By End-Users
- Market Opportunity Assessment By Distribution Channel
- Denmark Allopurinol Top Companies Market Share
- Denmark Allopurinol Competitive Benchmarking By Technical and Operational Parameters
- Denmark Allopurinol Company Profiles
- Denmark Allopurinol Key Strategic Recommendations
Frequently Asked Questions About the Market Study (FAQs):
6Wresearch actively monitors the Denmark Allopurinol Market and publishes its comprehensive annual report, highlighting emerging trends, growth drivers, revenue analysis, and forecast outlook. Our insights help businesses to make data-backed strategic decisions with ongoing market dynamics. Our analysts track relevent industries related to the Denmark Allopurinol Market, allowing our clients with actionable intelligence and reliable forecasts tailored to emerging regional needs.
Yes, we provide customisation as per your requirements. To learn more, feel free to contact us on sales@6wresearch.com
1 Executive Summary |
2 Introduction |
2.1 Key Highlights of the Report |
2.2 Report Description |
2.3 Market Scope & Segmentation |
2.4 Research Methodology |
2.5 Assumptions |
3 Denmark Allopurinol Market Overview |
3.1 Denmark Country Macro Economic Indicators |
3.2 Denmark Allopurinol Market Revenues & Volume, 2022 & 2032F |
3.3 Denmark Allopurinol Market - Industry Life Cycle |
3.4 Denmark Allopurinol Market - Porter's Five Forces |
3.5 Denmark Allopurinol Market Revenues & Volume Share, By Drug Class, 2022 & 2032F |
3.6 Denmark Allopurinol Market Revenues & Volume Share, By Application, 2022 & 2032F |
3.7 Denmark Allopurinol Market Revenues & Volume Share, By Dosage Form, 2022 & 2032F |
3.8 Denmark Allopurinol Market Revenues & Volume Share, By End-Users, 2022 & 2032F |
3.9 Denmark Allopurinol Market Revenues & Volume Share, By Distribution Channel, 2022 & 2032F |
4 Denmark Allopurinol Market Dynamics |
4.1 Impact Analysis |
4.2 Market Drivers |
4.2.1 Increasing prevalence of gout and related conditions in Denmark |
4.2.2 Growing awareness about the benefits of allopurinol in managing gout |
4.2.3 Rising healthcare expenditure and focus on chronic disease management in the country |
4.3 Market Restraints |
4.3.1 Stringent regulatory requirements for drug approval and marketing |
4.3.2 Competition from alternative treatments for gout management |
4.3.3 Pricing pressures and reimbursement challenges in the healthcare system |
5 Denmark Allopurinol Market Trends |
6 Denmark Allopurinol Market, By Types |
6.1 Denmark Allopurinol Market, By Drug Class |
6.1.1 Overview and Analysis |
6.1.2 Denmark Allopurinol Market Revenues & Volume, By Drug Class, 2022 - 2032F |
6.1.3 Denmark Allopurinol Market Revenues & Volume, By Antigout Agents, 2022 - 2032F |
6.1.4 Denmark Allopurinol Market Revenues & Volume, By Antihyperuricemic Agents, 2022 - 2032F |
6.2 Denmark Allopurinol Market, By Application |
6.2.1 Overview and Analysis |
6.2.2 Denmark Allopurinol Market Revenues & Volume, By Gout, 2022 - 2032F |
6.2.3 Denmark Allopurinol Market Revenues & Volume, By Kidney Stones, 2022 - 2032F |
6.2.4 Denmark Allopurinol Market Revenues & Volume, By Others, 2022 - 2032F |
6.2.5 Denmark Allopurinol Market Revenues & Volume, By Demographic, 2022 - 2032F |
6.2.6 Denmark Allopurinol Market Revenues & Volume, By Adult, 2022 - 2032F |
6.2.7 Denmark Allopurinol Market Revenues & Volume, By Pediatric, 2022 - 2032F |
6.3 Denmark Allopurinol Market, By Dosage Form |
6.3.1 Overview and Analysis |
6.3.2 Denmark Allopurinol Market Revenues & Volume, By Intravenous Powder for Injection, 2022 - 2032F |
6.3.3 Denmark Allopurinol Market Revenues & Volume, By Oral Tablet, 2022 - 2032F |
6.4 Denmark Allopurinol Market, By End-Users |
6.4.1 Overview and Analysis |
6.4.2 Denmark Allopurinol Market Revenues & Volume, By Clinic, 2022 - 2032F |
6.4.3 Denmark Allopurinol Market Revenues & Volume, By Hospital, 2022 - 2032F |
6.4.4 Denmark Allopurinol Market Revenues & Volume, By Others, 2022 - 2032F |
6.5 Denmark Allopurinol Market, By Distribution Channel |
6.5.1 Overview and Analysis |
6.5.2 Denmark Allopurinol Market Revenues & Volume, By Hospital Pharmacy, 2022 - 2032F |
6.5.3 Denmark Allopurinol Market Revenues & Volume, By Retail Pharmacy, 2022 - 2032F |
6.5.4 Denmark Allopurinol Market Revenues & Volume, By Online Pharmacy, 2022 - 2032F |
7 Denmark Allopurinol Market Import-Export Trade Statistics |
7.1 Denmark Allopurinol Market Export to Major Countries |
7.2 Denmark Allopurinol Market Imports from Major Countries |
8 Denmark Allopurinol Market Key Performance Indicators |
8.1 Number of gout patients diagnosed annually in Denmark |
8.2 Prescription rates of allopurinol compared to other gout medications |
8.3 Number of healthcare providers trained on the benefits of allopurinol in gout management |
9 Denmark Allopurinol Market - Opportunity Assessment |
9.1 Denmark Allopurinol Market Opportunity Assessment, By Drug Class, 2022 & 2032F |
9.2 Denmark Allopurinol Market Opportunity Assessment, By Application, 2022 & 2032F |
9.3 Denmark Allopurinol Market Opportunity Assessment, By Dosage Form, 2022 & 2032F |
9.4 Denmark Allopurinol Market Opportunity Assessment, By End-Users, 2022 & 2032F |
9.5 Denmark Allopurinol Market Opportunity Assessment, By Distribution Channel, 2022 & 2032F |
10 Denmark Allopurinol Market - Competitive Landscape |
10.1 Denmark Allopurinol Market Revenue Share, By Companies, 2025 |
10.2 Denmark Allopurinol Market Competitive Benchmarking, By Operating and Technical Parameters |
11 Company Profiles |
12 Recommendations |
13 Disclaimer |
Global Go To Market Strategy - 2030
Export potential enables firms to identify high-growth global markets with greater confidence by combining advanced trade intelligence with a structured quantitative methodology. The framework analyzes emerging demand trends and country-level import patterns while integrating macroeconomic and trade datasets such as GDP and population forecasts, bilateral import–export flows, tariff structures, elasticity differentials between developed and developing economies, geographic distance, and import demand projections. Using weighted trade values from 2020–2024 as the base period to project country-to-country export potential for 2030, these inputs are operationalized through calculated drivers such as gravity model parameters, tariff impact factors, and projected GDP per-capita growth. Through an analysis of hidden potentials, demand hotspots, and market conditions that are most favorable to success, this method enables firms to focus on target countries, maximize returns, and global expansion with data, backed by accuracy.
By factoring in the projected importer demand gap that is currently unmet and could be potential opportunity, it identifies the potential for the Exporter (Country) among 190 countries, against the general trade analysis, which identifies the biggest importer or exporter.
To discover high-growth global markets and optimize your business strategy:
Click Here
Pricing
- Single User License$ 1,995
- Department License$ 2,400
- Site License$ 3,120
- Global License$ 3,795

Leadership Perspectives from Industry Events
Search
Thought Leadership and Analyst Meet


Our Clients
6WResearch In News
- Doha a strategic location for EV manufacturing hub: IPA Qatar
- Demand for luxury TVs surging in the GCC, says Samsung
- Empowering Growth: The Thriving Journey of Bangladesh’s Cable Industry
- Demand for luxury TVs surging in the GCC, says Samsung
- Video call with a traditional healer? Once unthinkable, it’s now common in South Africa
- Intelligent Buildings To Smooth GCC’s Path To Net Zero
Latest Reports
- New Zealand Aseptic Manufacturing Market (2026-2032)
- Netherlands Aseptic Manufacturing Market (2026-2032)
- Nauru Aseptic Manufacturing Market (2026-2032)
- Namibia Aseptic Manufacturing Market (2026-2032)
- Mozambique Aseptic Manufacturing Market (2026-2032)
- Montenegro Aseptic Manufacturing Market (2026-2032)
- Mongolia Aseptic Manufacturing Market (2026-2032)
- Monaco Aseptic Manufacturing Market (2026-2032)
- Micronesia Aseptic Manufacturing Market (2026-2032)
- Mauritius Aseptic Manufacturing Market (2026-2032)
Industry Events and Analyst Meet

HIMTEX 2026

India Refining Summit 2026

India EV Show 2026

EV tech India Expo 2026

Auto Tech Asia 2026
Whitepaper
- Middle East & Africa Commercial Security Market Click here to view more.
- Middle East & Africa Fire Safety Systems & Equipment Market Click here to view more.
- GCC Drone Market Click here to view more.
- Middle East Lighting Fixture Market Click here to view more.
- GCC Physical & Perimeter Security Market Click here to view more.