Denmark Candy Market (2025-2031) | Revenue, Growth, Outlook, Industry, Share, Trends, Value, Size, Analysis, Forecast, Segmentation & Companies
Market Forecast By Product Type (Chocolate Candy, Non-Chocolate Candy), By Distribution (Supermarkets and Hypermarkets, Convenience Stores, Specialist Retailers, Online Retail, Others) And Competitive Landscape
| Product Code: ETC5378279 | Publication Date: Nov 2023 | Updated Date: Dec 2025 | Product Type: Market Research Report | |
| Publisher: 6Wresearch | Author: Bhawna Singh | No. of Pages: 60 | No. of Figures: 30 | No. of Tables: 5 |
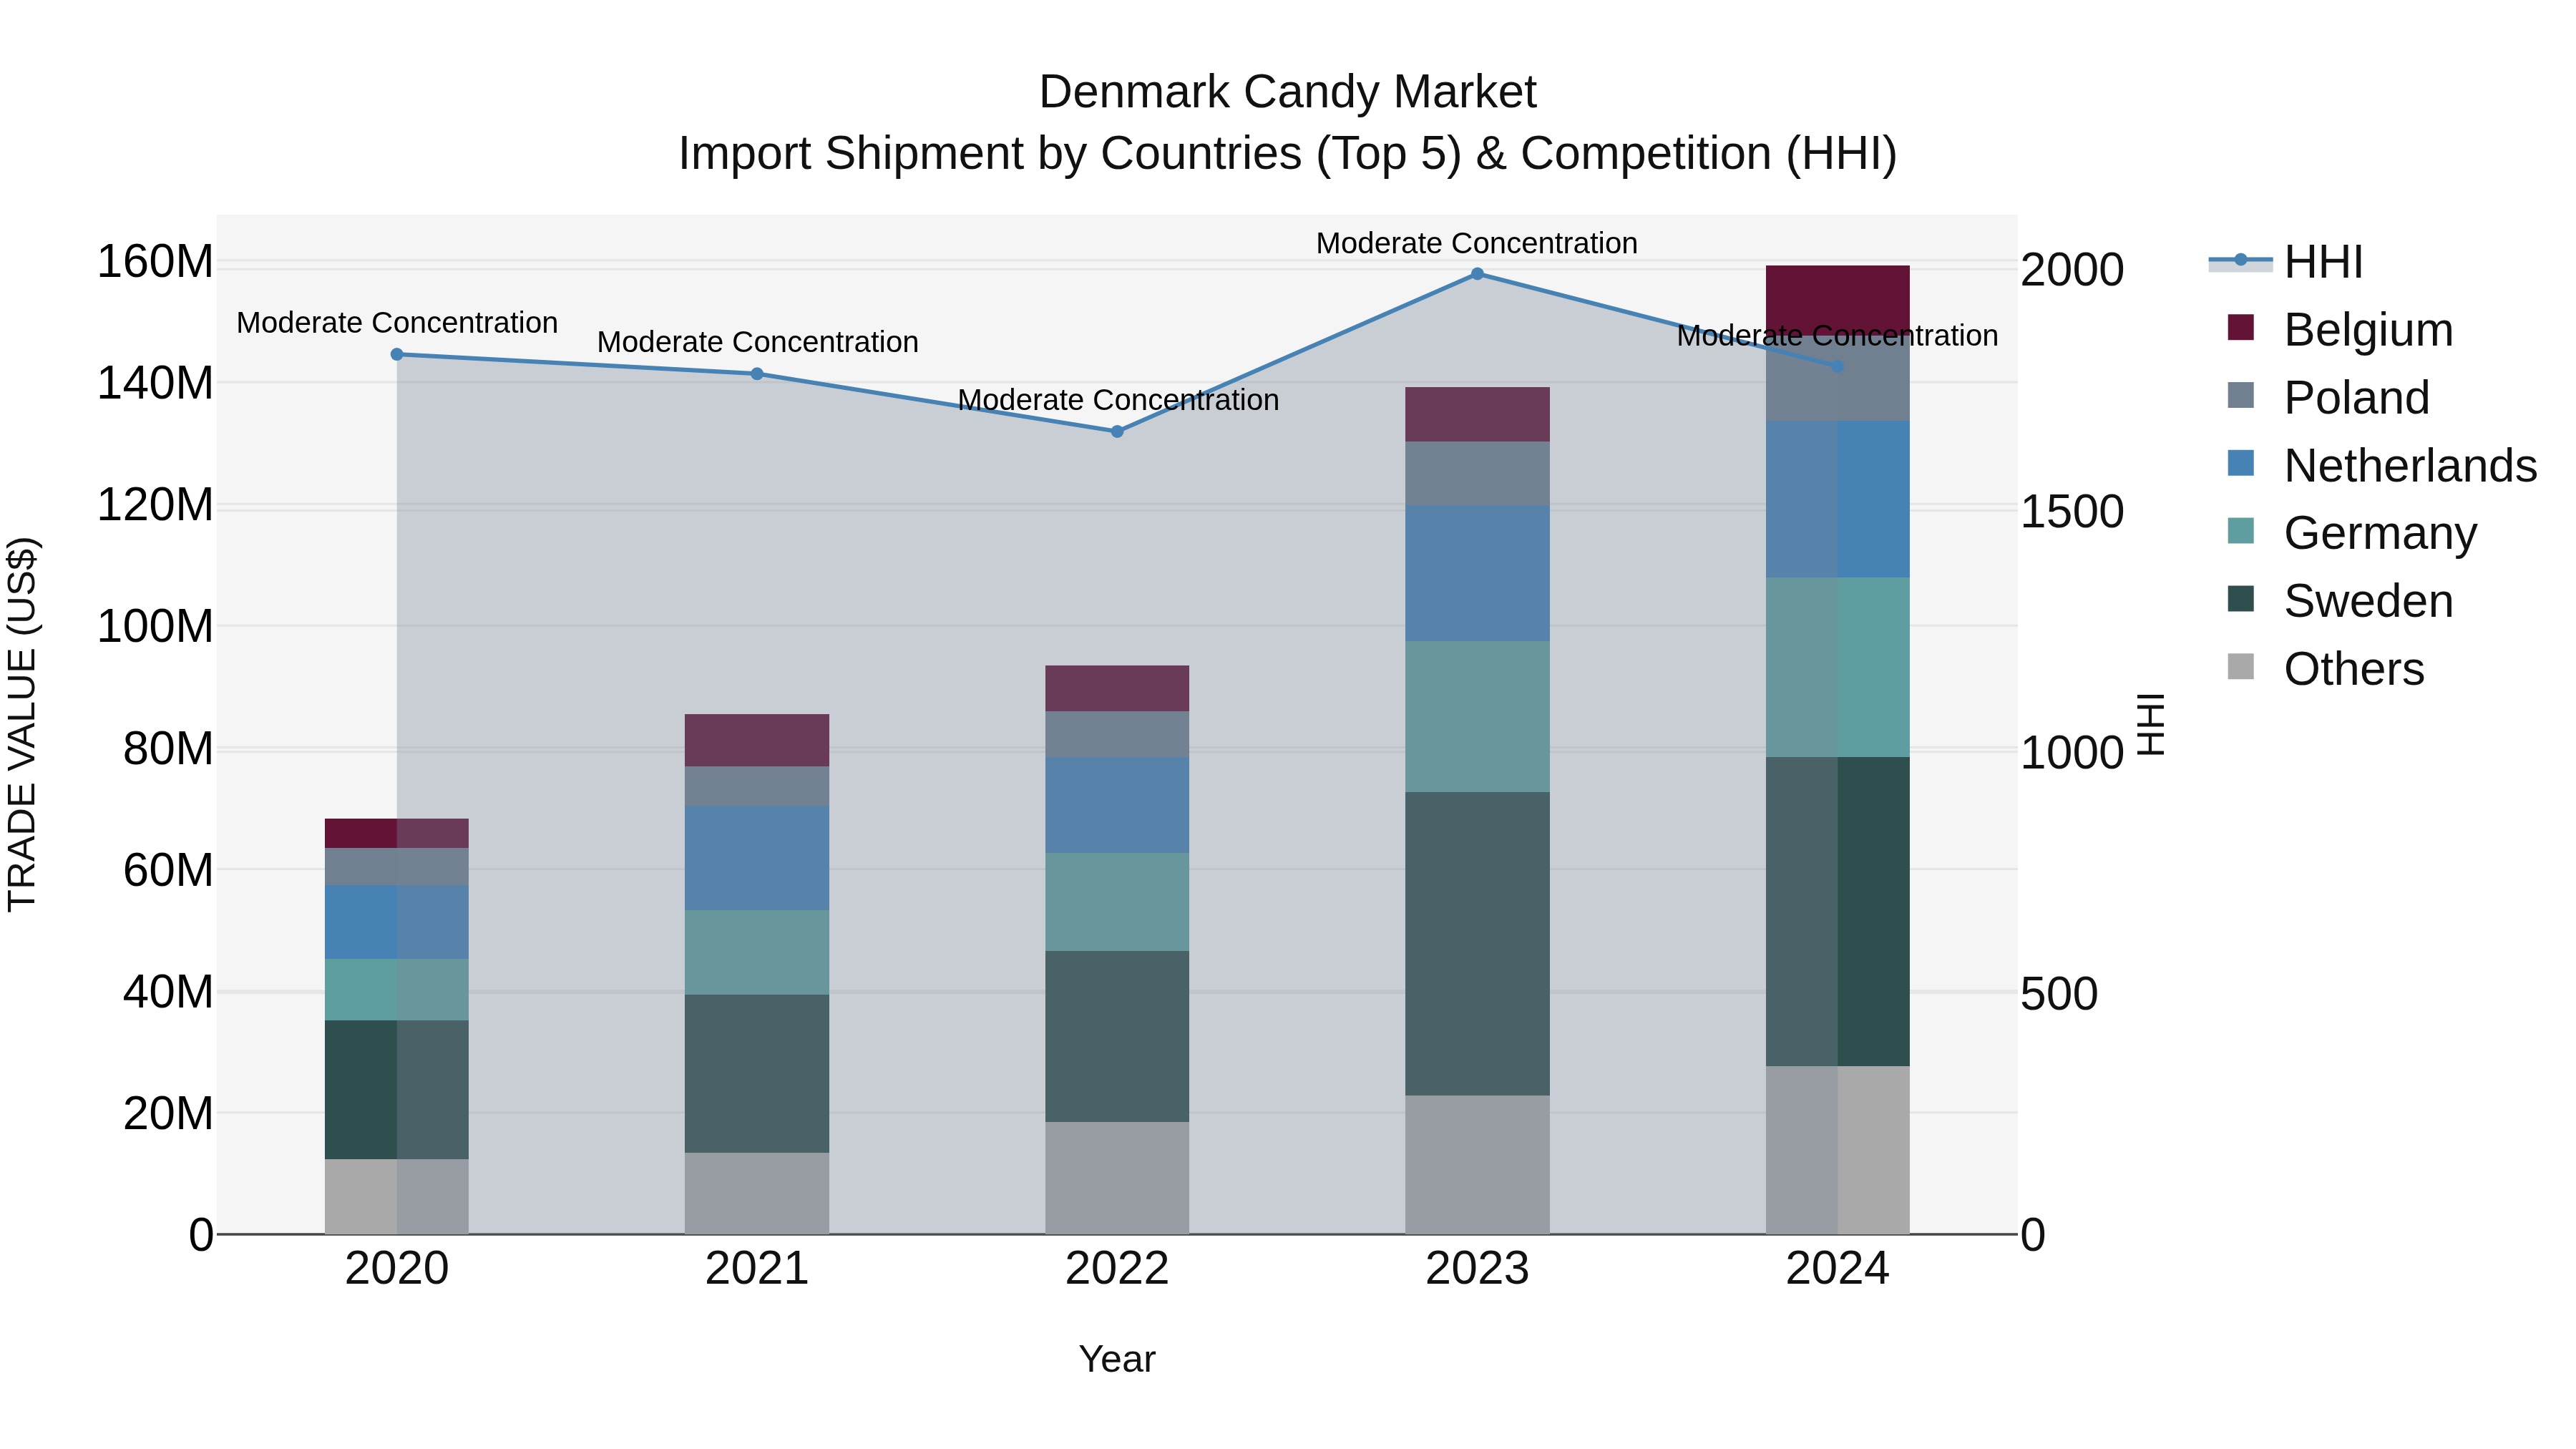
Denmark Candy Market Top 5 Importing Countries and Market Competition (HHI) Analysis
Denmark candy import market continued to show steady growth in 2024, with top exporting countries being Sweden, Germany, Netherlands, Poland, and Belgium. The market concentration, as measured by the Herfindahl-Hirschman Index (HHI), remained at a moderate level, indicating a competitive landscape. The compound annual growth rate (CAGR) for candy imports from 2020 to 2024 stood at an impressive 23.53%, reflecting sustained demand. Furthermore, the growth rate from 2023 to 2024 accelerated to 14.34%, underscoring the increasing popularity of imported candies among Danish consumers.
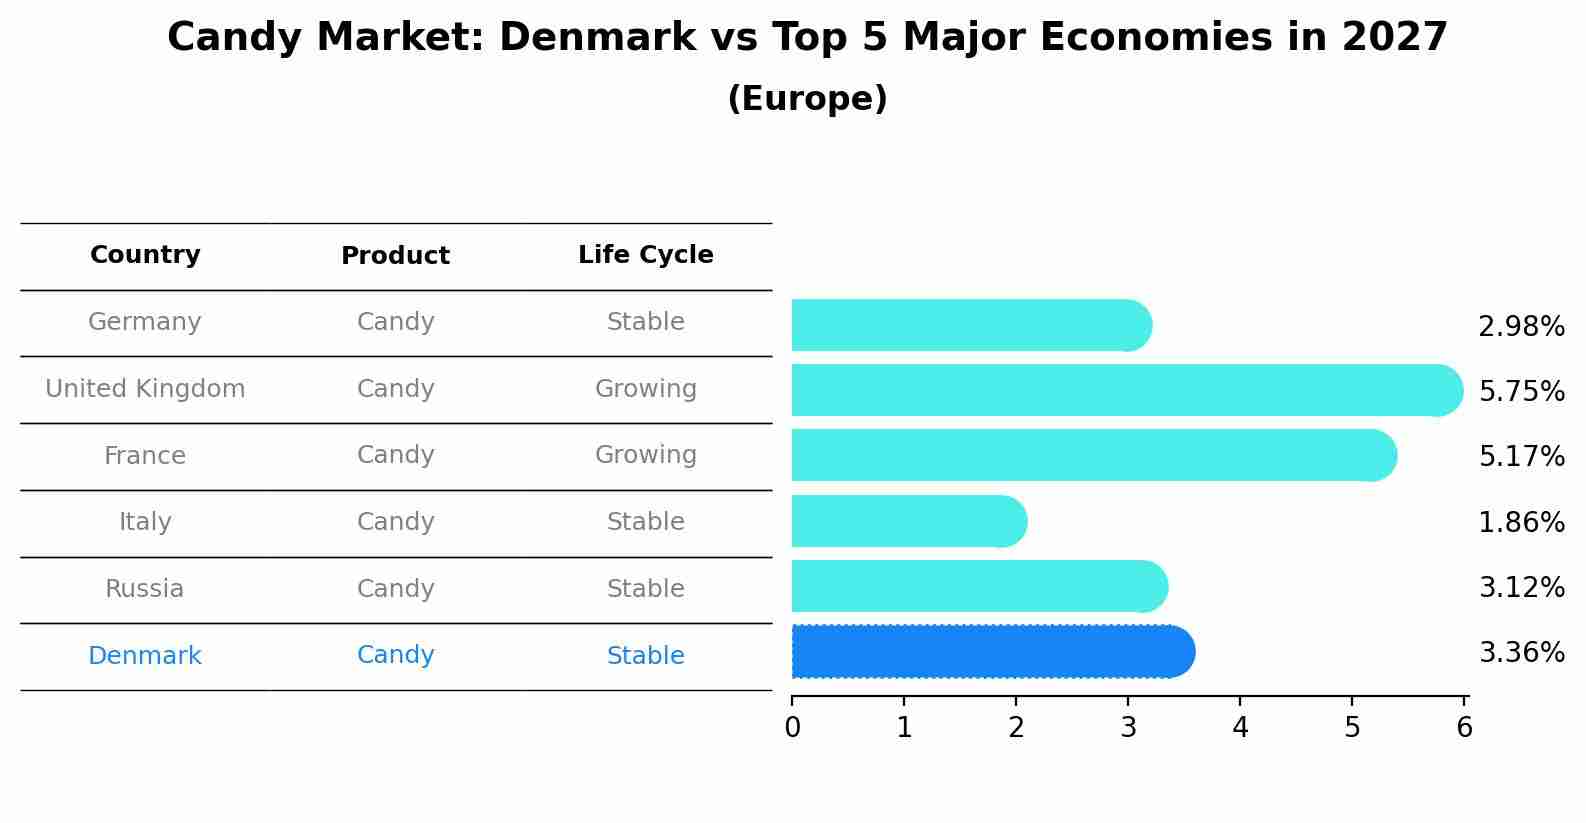
Candy Market: Denmark vs Top 5 Major Economies in 2027 (Europe)
The Candy market in Denmark is projected to grow at a stable growth rate of 3.36% by 2027, highlighting the country's increasing focus on advanced technologies within the Europe region, where Germany holds the dominant position, followed closely by United Kingdom, France, Italy and Russia, shaping overall regional demand.
Denmark Candy Market Overview
Denmark`s candy market is well-established, with a variety of local and international brands catering to the nation`s love for sweets. Seasonal demand peaks during holidays and festivals, while the market sees continuous innovation in flavors, packaging, and healthier alternatives.
Drivers of the market
The candy market in Denmark is benefiting from the growing demand for indulgent treats and innovative confectionery products. Seasonal and festive demand, along with the popularity of premium and artisanal candies, is driving the market forward. In addition, manufacturers are introducing new flavors and healthier options, such as sugar-free or reduced-sugar candies, to cater to the health-conscious segment. The increasing focus on convenient, on-the-go snacks is also contributing to the candy markets growth, as well as the trend of gifting premium confectionery.
Challenges of the market
The candy market in Denmark faces challenges from changing consumer preferences toward healthier snacks and the need for compliance with food safety regulations. Manufacturers must innovate to meet these demands while managing production costs, which can be significant.
Government Policy of the market
The Danish governments health policies and regulations on food safety significantly influence the candy market. Policies aimed at reducing sugar consumption and promoting healthier alternatives impact the demand for traditional confectionery products. Additionally, strict EU regulations on food additives, labeling, and marketing practices shape the production and sale of candy in Denmark, pushing manufacturers to innovate with healthier and more sustainable options.
Key Highlights of the Report:
- Denmark Candy Market Outlook
- Market Size of Denmark Candy Market, 2024
- Forecast of Denmark Candy Market, 2031
- Historical Data and Forecast of Denmark Candy Revenues & Volume for the Period 2021-2031
- Denmark Candy Market Trend Evolution
- Denmark Candy Market Drivers and Challenges
- Denmark Candy Price Trends
- Denmark Candy Porter`s Five Forces
- Denmark Candy Industry Life Cycle
- Historical Data and Forecast of Denmark Candy Market Revenues & Volume By Product Type for the Period 2021-2031
- Historical Data and Forecast of Denmark Candy Market Revenues & Volume By Chocolate Candy for the Period 2021-2031
- Historical Data and Forecast of Denmark Candy Market Revenues & Volume By Non-Chocolate Candy for the Period 2021-2031
- Historical Data and Forecast of Denmark Candy Market Revenues & Volume By Distribution for the Period 2021-2031
- Historical Data and Forecast of Denmark Candy Market Revenues & Volume By Supermarkets and Hypermarkets for the Period 2021-2031
- Historical Data and Forecast of Denmark Candy Market Revenues & Volume By Convenience Stores for the Period 2021-2031
- Historical Data and Forecast of Denmark Candy Market Revenues & Volume By Specialist Retailers for the Period 2021-2031
- Historical Data and Forecast of Denmark Candy Market Revenues & Volume By Online Retail for the Period 2021-2031
- Historical Data and Forecast of Denmark Candy Market Revenues & Volume By Others for the Period 2021-2031
- Denmark Candy Import Export Trade Statistics
- Market Opportunity Assessment By Product Type
- Market Opportunity Assessment By Distribution
- Denmark Candy Top Companies Market Share
- Denmark Candy Competitive Benchmarking By Technical and Operational Parameters
- Denmark Candy Company Profiles
- Denmark Candy Key Strategic Recommendations
Frequently Asked Questions About the Market Study (FAQs):
6Wresearch actively monitors the Denmark Candy Market and publishes its comprehensive annual report, highlighting emerging trends, growth drivers, revenue analysis, and forecast outlook. Our insights help businesses to make data-backed strategic decisions with ongoing market dynamics. Our analysts track relevent industries related to the Denmark Candy Market, allowing our clients with actionable intelligence and reliable forecasts tailored to emerging regional needs.
Yes, we provide customisation as per your requirements. To learn more, feel free to contact us on sales@6wresearch.com
1 Executive Summary |
2 Introduction |
2.1 Key Highlights of the Report |
2.2 Report Description |
2.3 Market Scope & Segmentation |
2.4 Research Methodology |
2.5 Assumptions |
3 Denmark Candy Market Overview |
3.1 Denmark Country Macro Economic Indicators |
3.2 Denmark Candy Market Revenues & Volume, 2021 & 2031F |
3.3 Denmark Candy Market - Industry Life Cycle |
3.4 Denmark Candy Market - Porter's Five Forces |
3.5 Denmark Candy Market Revenues & Volume Share, By Product Type, 2021 & 2031F |
3.6 Denmark Candy Market Revenues & Volume Share, By Distribution, 2021 & 2031F |
4 Denmark Candy Market Dynamics |
4.1 Impact Analysis |
4.2 Market Drivers |
4.2.1 Growing consumer preference for indulgent and premium confectionery products |
4.2.2 Increasing demand for organic and natural ingredients in candies |
4.2.3 Rising disposable income and changing lifestyles leading to higher spending on confectionery items |
4.3 Market Restraints |
4.3.1 Health concerns related to sugar consumption impacting the sales of traditional candies |
4.3.2 Fluctuating prices of raw materials affecting production costs |
4.3.3 Intense competition from substitute products like healthier snacks and treats |
5 Denmark Candy Market Trends |
6 Denmark Candy Market Segmentations |
6.1 Denmark Candy Market, By Product Type |
6.1.1 Overview and Analysis |
6.1.2 Denmark Candy Market Revenues & Volume, By Chocolate Candy, 2021-2031F |
6.1.3 Denmark Candy Market Revenues & Volume, By Non-Chocolate Candy, 2021-2031F |
6.2 Denmark Candy Market, By Distribution |
6.2.1 Overview and Analysis |
6.2.2 Denmark Candy Market Revenues & Volume, By Supermarkets and Hypermarkets, 2021-2031F |
6.2.3 Denmark Candy Market Revenues & Volume, By Convenience Stores, 2021-2031F |
6.2.4 Denmark Candy Market Revenues & Volume, By Specialist Retailers, 2021-2031F |
6.2.5 Denmark Candy Market Revenues & Volume, By Online Retail, 2021-2031F |
6.2.6 Denmark Candy Market Revenues & Volume, By Others, 2021-2031F |
7 Denmark Candy Market Import-Export Trade Statistics |
7.1 Denmark Candy Market Export to Major Countries |
7.2 Denmark Candy Market Imports from Major Countries |
8 Denmark Candy Market Key Performance Indicators |
8.1 Percentage of sales from premium and organic candy products |
8.2 Consumer satisfaction scores related to taste, quality, and packaging of candies |
8.3 Number of new product launches and innovations in the candy market |
9 Denmark Candy Market - Opportunity Assessment |
9.1 Denmark Candy Market Opportunity Assessment, By Product Type, 2021 & 2031F |
9.2 Denmark Candy Market Opportunity Assessment, By Distribution, 2021 & 2031F |
10 Denmark Candy Market - Competitive Landscape |
10.1 Denmark Candy Market Revenue Share, By Companies, 2024 |
10.2 Denmark Candy Market Competitive Benchmarking, By Operating and Technical Parameters |
11 Company Profiles |
12 Recommendations | 13 Disclaimer |
Export potential assessment - trade Analytics for 2030
Export potential enables firms to identify high-growth global markets with greater confidence by combining advanced trade intelligence with a structured quantitative methodology. The framework analyzes emerging demand trends and country-level import patterns while integrating macroeconomic and trade datasets such as GDP and population forecasts, bilateral import–export flows, tariff structures, elasticity differentials between developed and developing economies, geographic distance, and import demand projections. Using weighted trade values from 2020–2024 as the base period to project country-to-country export potential for 2030, these inputs are operationalized through calculated drivers such as gravity model parameters, tariff impact factors, and projected GDP per-capita growth. Through an analysis of hidden potentials, demand hotspots, and market conditions that are most favorable to success, this method enables firms to focus on target countries, maximize returns, and global expansion with data, backed by accuracy.
By factoring in the projected importer demand gap that is currently unmet and could be potential opportunity, it identifies the potential for the Exporter (Country) among 190 countries, against the general trade analysis, which identifies the biggest importer or exporter.
To discover high-growth global markets and optimize your business strategy:
Click Here
Pricing
- Single User License$ 1,995
- Department License$ 2,400
- Site License$ 3,120
- Global License$ 3,795

Search
Thought Leadership and Analyst Meet


Our Clients
Latest Reports
- United Kingdom (UK) Long-term Care Insurance Market (2026-2032) | Growth, Share, Consumer Insights, Drivers, Opportunities, Competition, Pricing Analysis, Segments, Restraints, Companies, Competitive, Value, Outlook, Size, Demand, Analysis, Challenges, Strategic Insights, Investment Trends, Revenue, Trends, Supply, Forecast
- United Kingdom (UK) Long Term Care Market (2026-2032) | Companies, Outlook, Analysis, Trends, Value, Revenue, Segmentation, Share, Forecast, Competitive Landscape, Growth, Size & Forecast
- Iraq Insulation and Waterproofing Market (2026-2032) | Outlook, Drivers, Growth, Size, Share, Industry, Revenue, Trends, Demand, Competitive, Strategic Insights, Opportunities, Segments, Companies, Challenges, Strategy, Consumer Insights, Analysis, Investment Trends, Value, Segmentation, Forecast, Restraints
- India Switchgear Market Outlook (2026 - 2032) | Size, Share, Trends, Growth, Revenue, Forecast, Analysis, Value, Outlook
- Pakistan Contraceptive Implants Market (2025-2031) | Demand, Growth, Size, Share, Industry, Pricing Analysis, Competitive, Strategic Insights, Strategy, Consumer Insights, Analysis, Investment Trends, Opportunities, Revenue, Segments, Value, Segmentation, Supply, Forecast, Restraints, Outlook, Competition, Drivers, Trends, Companies, Challenges
- Sri Lanka Packaging Market (2026-2032) | Outlook, Competition, Drivers, Trends, Demand, Pricing Analysis, Competitive, Strategic Insights, Companies, Challenges, Strategy, Consumer Insights, Analysis, Investment Trends, Opportunities, Growth, Size, Share, Industry, Revenue, Segments, Value, Segmentation, Supply, Forecast, Restraints
- India Kids Watches Market (2026-2032) | Strategy, Consumer Insights, Analysis, Investment Trends, Opportunities, Growth, Size, Share, Industry, Revenue, Segments, Value, Segmentation, Supply, Forecast, Restraints, Outlook, Competition, Drivers, Trends, Demand, Pricing Analysis, Competitive, Strategic Insights, Companies, Challenges
- Saudi Arabia Core Assurance Service Market (2025-2031) | Strategy, Consumer Insights, Analysis, Investment Trends, Opportunities, Growth, Size, Share, Industry, Revenue, Segments, Value, Segmentation, Supply, Forecast, Restraints, Outlook, Competition, Drivers, Trends, Demand, Pricing Analysis, Competitive, Strategic Insights, Companies, Challenges
- Romania Uninterruptible Power Supply (UPS) Market (2026-2032) | Industry, Analysis, Revenue, Size, Forecast, Outlook, Value, Trends, Share, Growth & Companies
- Saudi Arabia Car Window Tinting Film, Paint Protection Film (PPF), and Ceramic Coating Market (2025-2031) | Strategy, Consumer Insights, Analysis, Investment Trends, Opportunities, Growth, Size, Share, Industry, Revenue, Segments, Value, Segmentation, Supply, Forecast, Restraints, Outlook, Competition, Drivers, Trends, Demand, Pricing Analysis, Competitive, Strategic Insights, Companies, Challenges
Industry Events and Analyst Meet

India EV Show 2026

EV tech India Expo 2026

Auto Tech Asia 2026

Battery Tech India 2026

Smart Production Solutions Guangzhou 2026
Whitepaper
- Middle East & Africa Commercial Security Market Click here to view more.
- Middle East & Africa Fire Safety Systems & Equipment Market Click here to view more.
- GCC Drone Market Click here to view more.
- Middle East Lighting Fixture Market Click here to view more.
- GCC Physical & Perimeter Security Market Click here to view more.
6WResearch In News
- Doha a strategic location for EV manufacturing hub: IPA Qatar
- Demand for luxury TVs surging in the GCC, says Samsung
- Empowering Growth: The Thriving Journey of Bangladesh’s Cable Industry
- Demand for luxury TVs surging in the GCC, says Samsung
- Video call with a traditional healer? Once unthinkable, it’s now common in South Africa
- Intelligent Buildings To Smooth GCC’s Path To Net Zero