Denmark Deboning Equipment Market (2026-2032) | Share, Trends, Industry, Analysis, Forecast, Competitive Landscape, Segmentation, Outlook, Size & Revenue, Companies, Value, Growth
Market Forecast By Type (Chicken Meat, Turkey Meat, Duck Meat), By Product Type (FreshProcessed, Raw Cooked, Pre-Cooked, Raw Fermented Sausages, Cured, Dried), By Automation (Fully Automated Line, Semi-Automated Line), By Livestock (Poultry, Swine, Bovine, Seafood) And Competitive Landscape
| Product Code: ETC6957446 | Publication Date: Sep 2024 | Updated Date: Apr 2026 | Product Type: Market Research Report | |
| Publisher: 6Wresearch | Author: Sumit Sagar | No. of Pages: 75 | No. of Figures: 35 | No. of Tables: 20 |
Denmark Deboning Equipment Market Size (2020-2030)
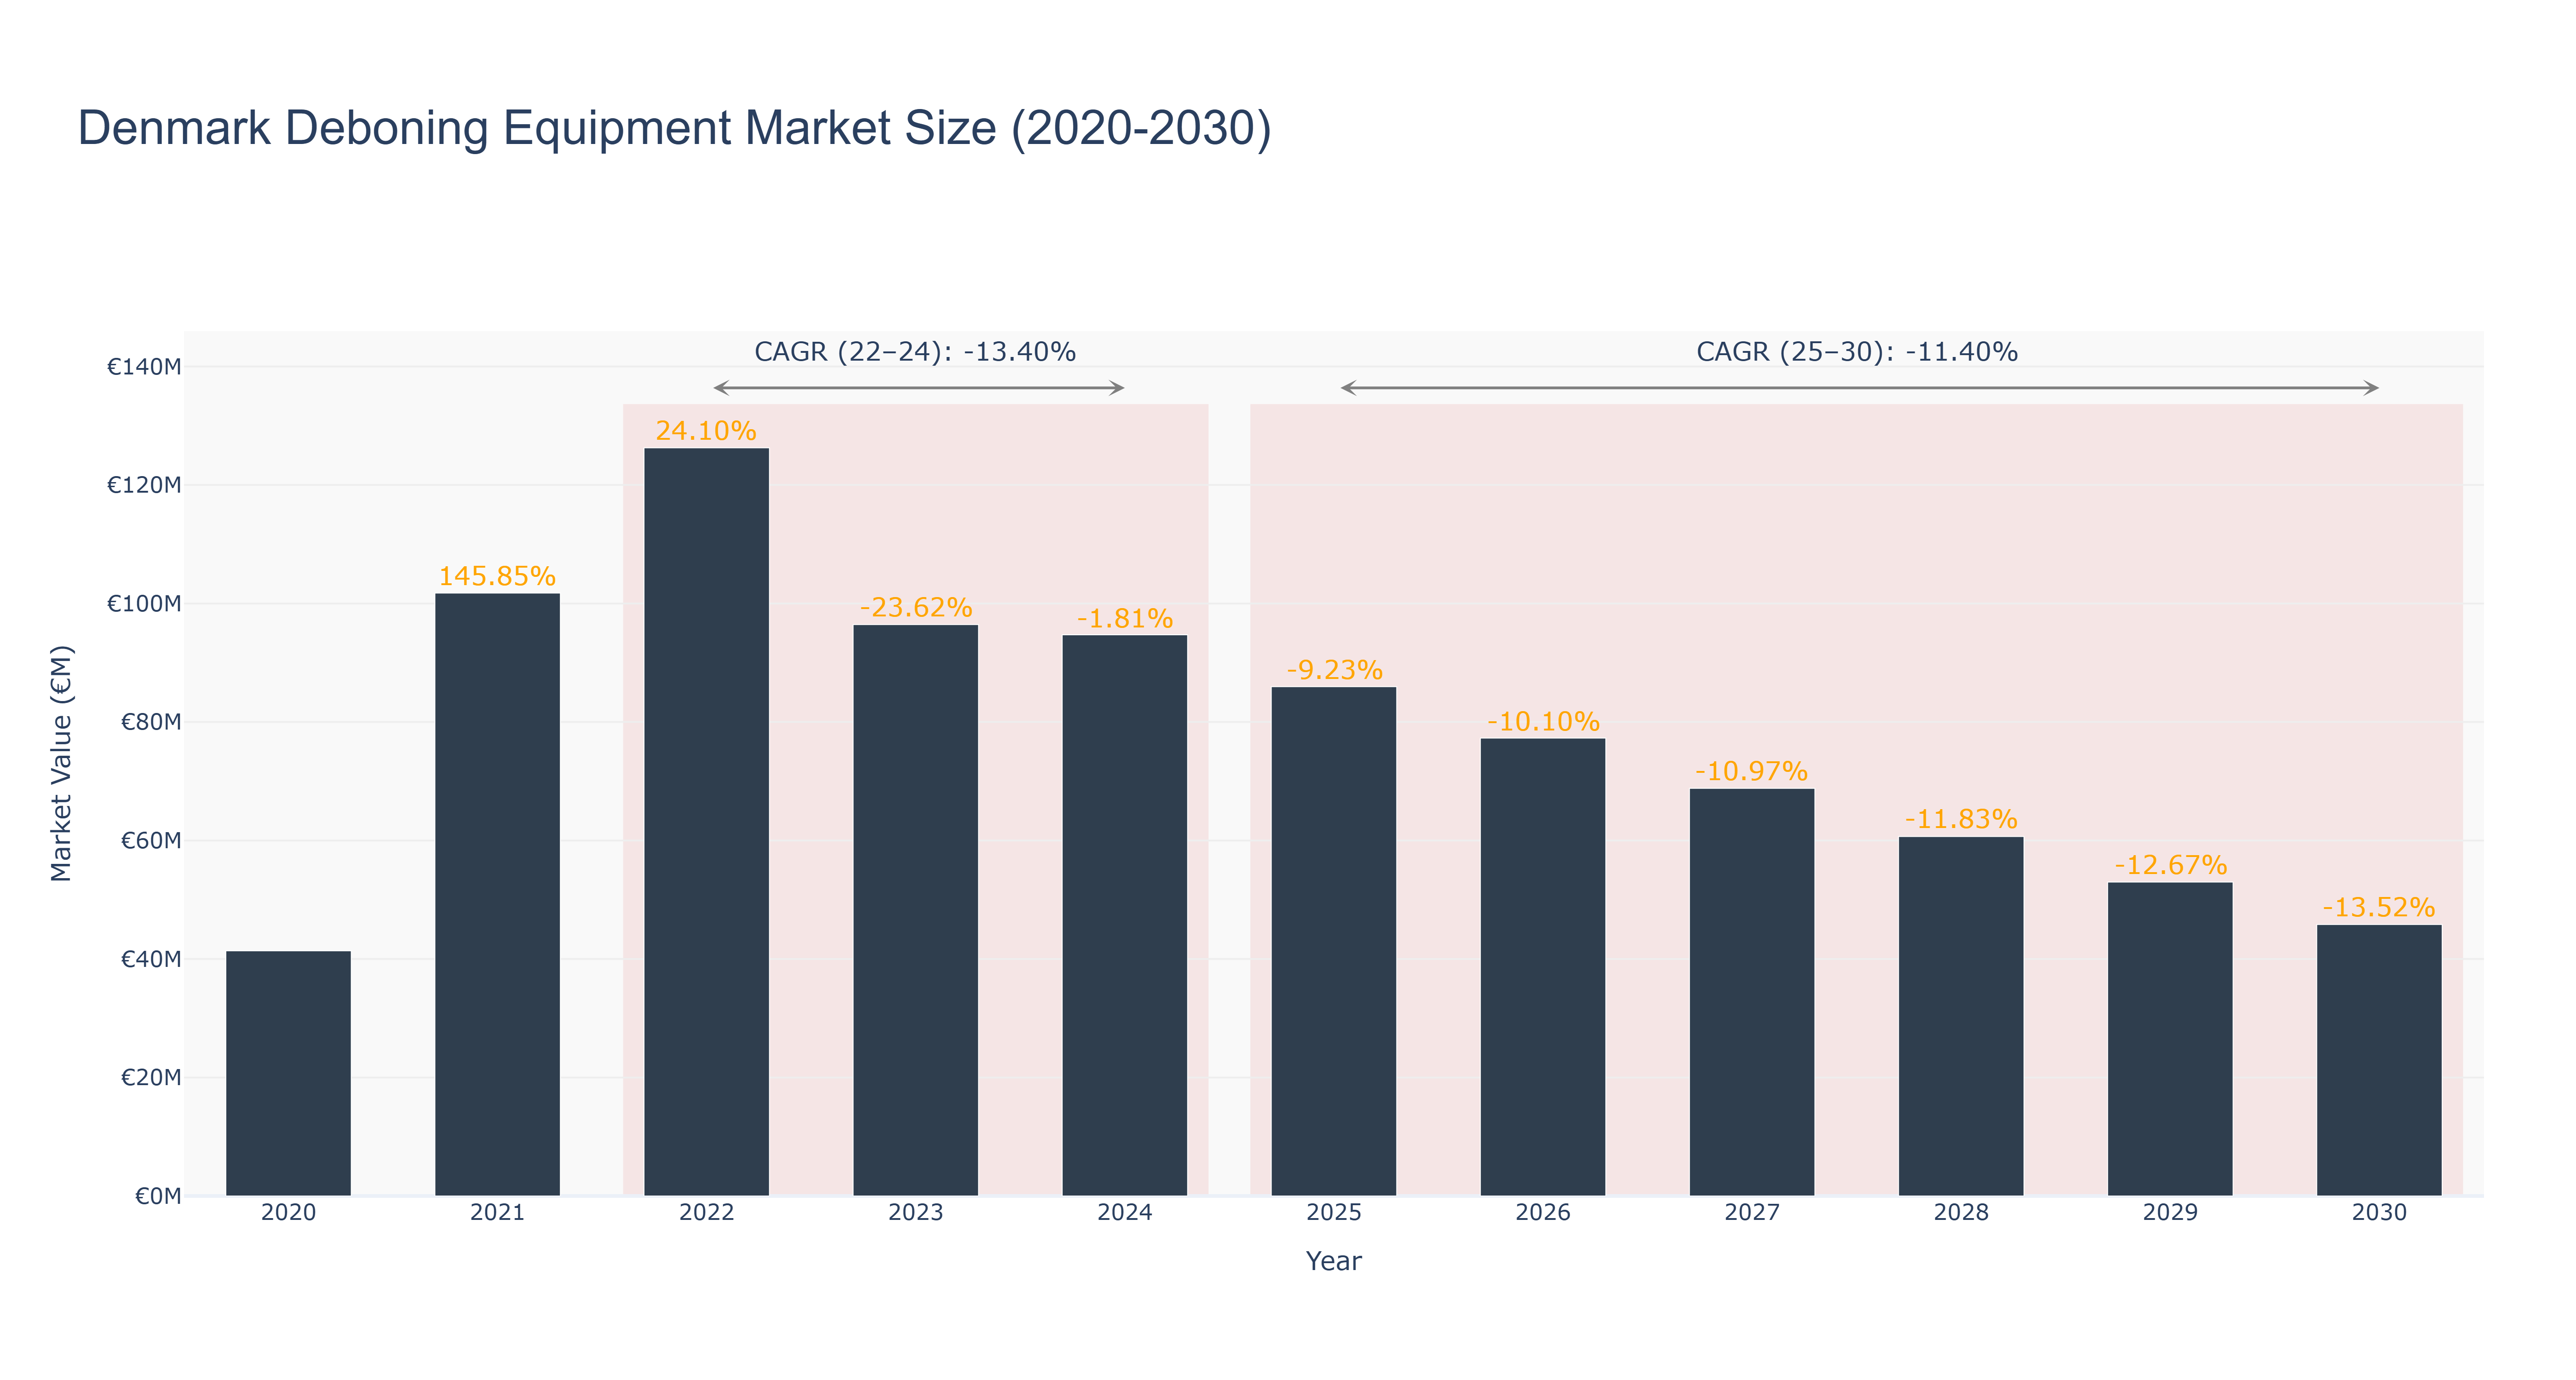
The Denmark Deboning Equipment Market peaked in 2022 with a market size of €126.28 million. However, the market witnessed a decline in subsequent years, with the market size dropping to €77.29 million in 2026. The forecasted trend indicates a continued decrease in market size, with a projected size of €45.82 million in 2030. The CAGR for the period 2022-24 stands at -13.40%, while the CAGR for 2025-30 is estimated at -11.40%. The downward trend can be attributed to factors such as changing consumer preferences, increased competition, and technological advancements impacting demand. Despite the challenging market conditions, upcoming developments in sustainable deboning technologies are expected to drive innovation and potentially revitalize the market in the near future.
Denmark Deboning Equipment Market: Production & Trade Performance (2019-2025)
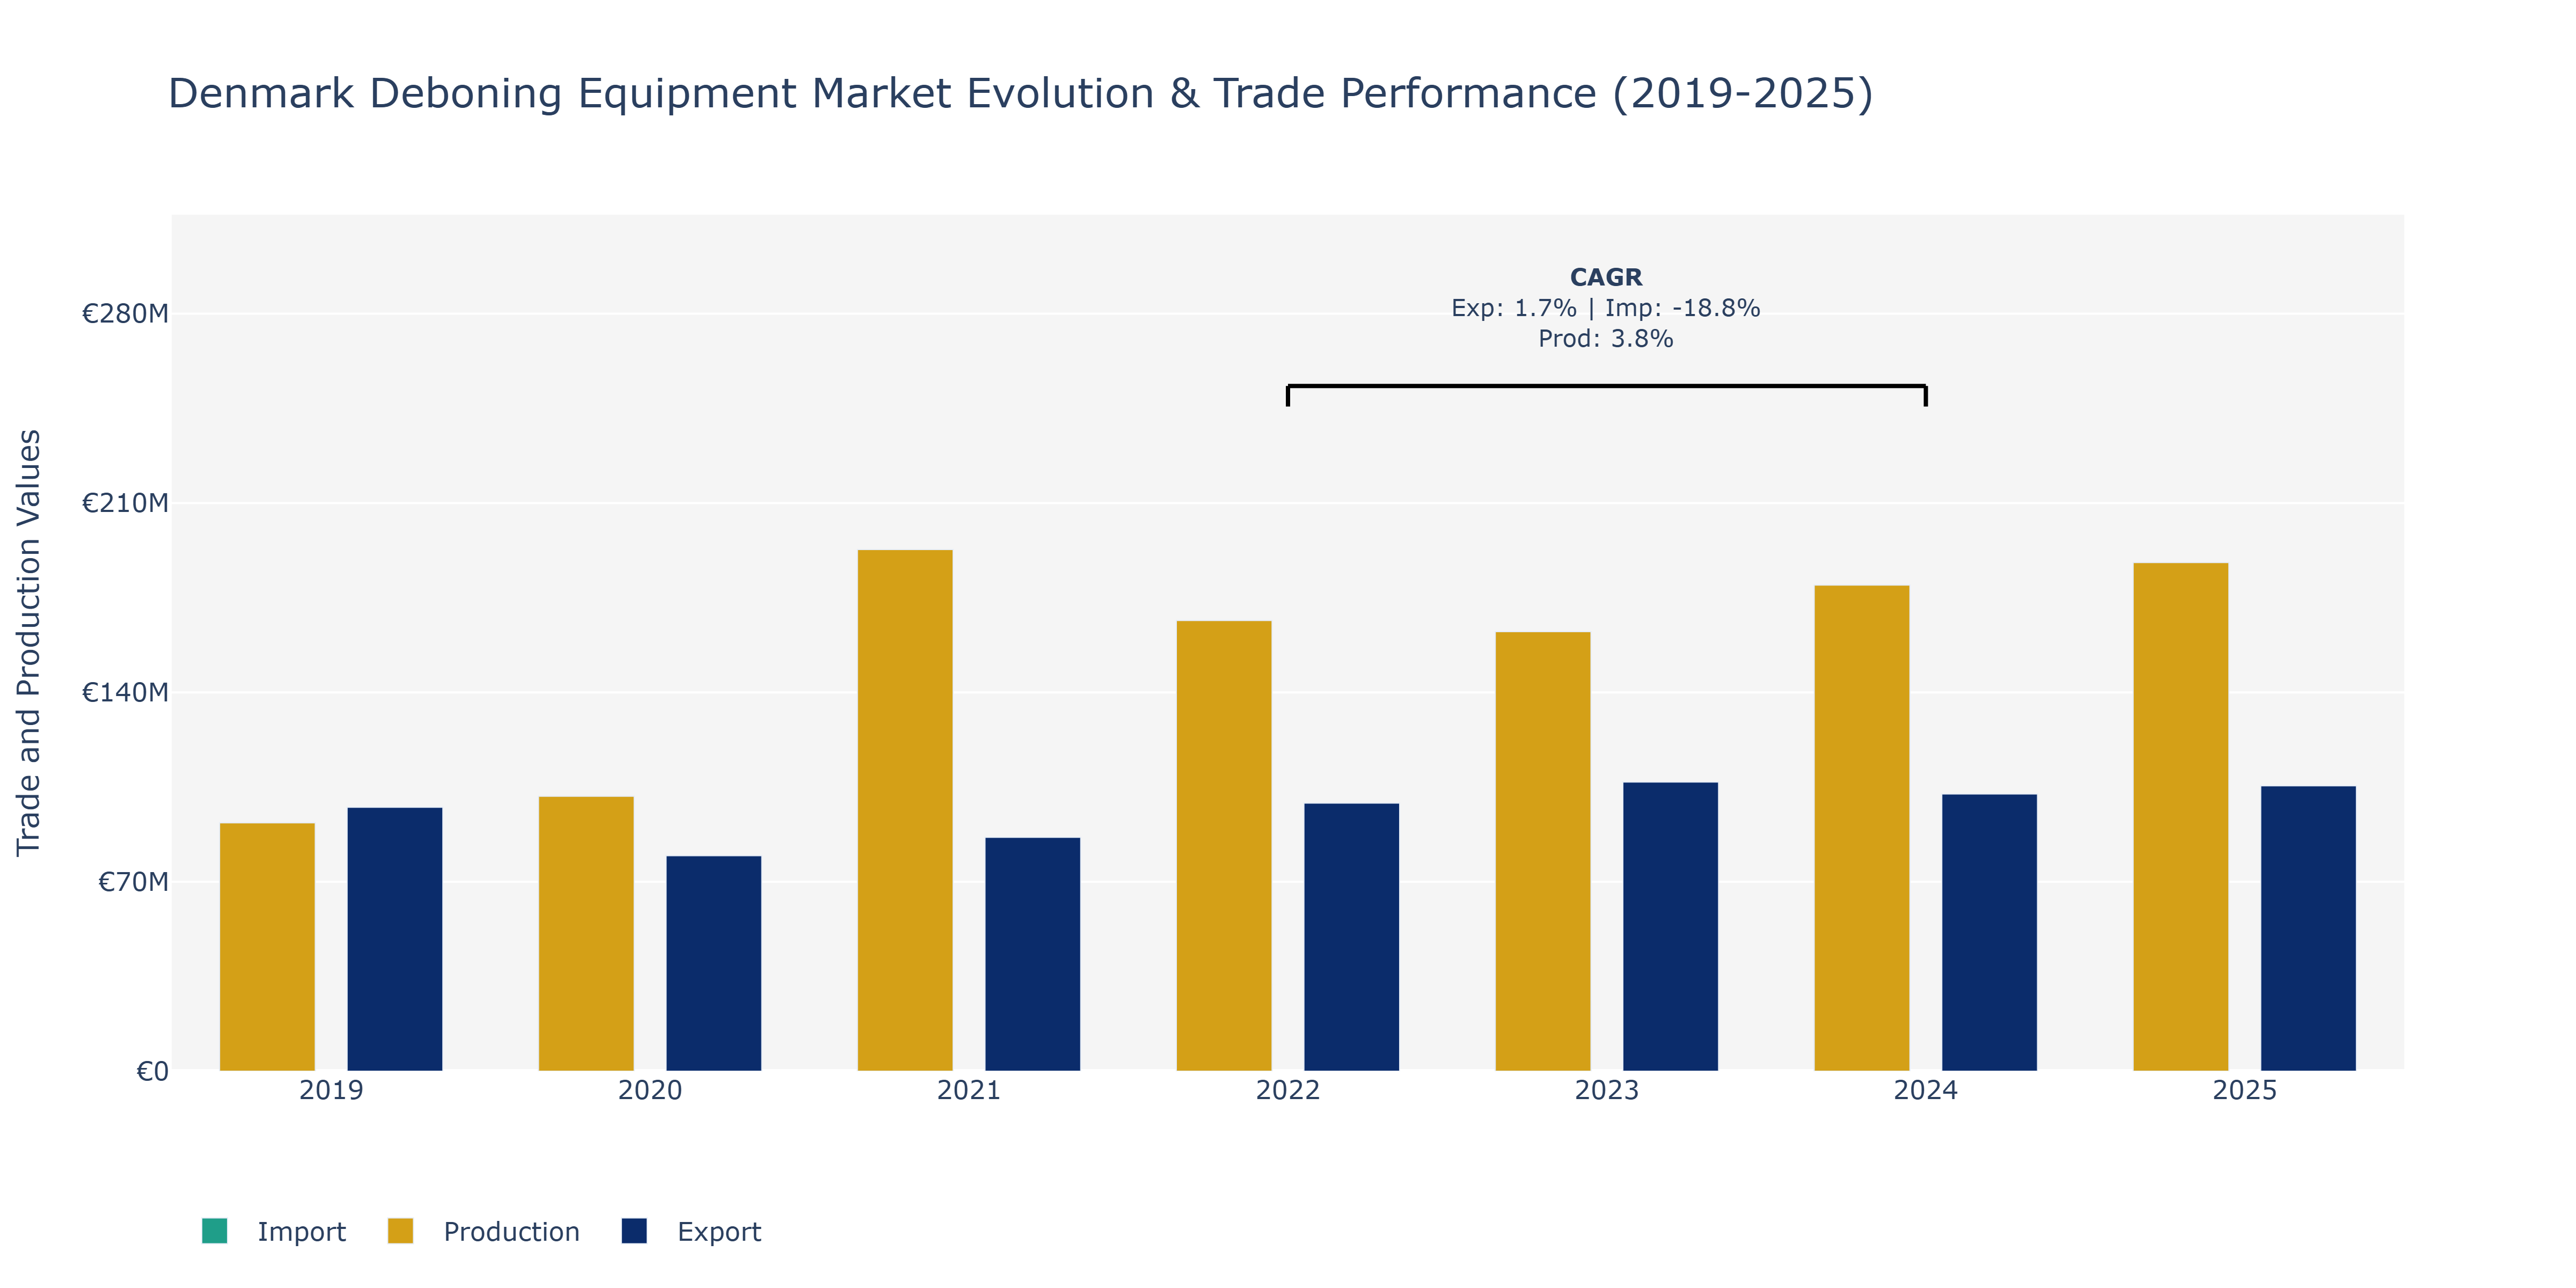
Between 2019 and 2025, Denmark's Deboning Equipment Market displayed notable dynamics in exports, imports, and production. Export value saw a downward trend from €97.56 million in 2019 to a low of €79.63 million in 2020 before gradually recovering, reaching a peak of €105.46 million in 2025. In contrast, imports fluctuated, hitting a low point in 2025 at €18.34 million after peaking at €33.34 million in 2021. This decline could be attributed to a shift towards domestic production or changes in sourcing strategies due to global economic conditions. However, the local production of deboning equipment showed steady growth over the years, increasing from €91.77 million in 2019 to its highest point of €188.01 million in 2025. This growth might be due to increased demand for processed meat products globally, leading to expanded production capacities in Denmark. Such trends align with the rising consumer preference for convenience foods and the automation of meat processing technologies in the industry.
Key Highlights of the Report:
- Denmark Deboning Equipment Market Outlook
- Market Size of Denmark Deboning Equipment Market, 2025
- Forecast of Denmark Deboning Equipment Market, 2032
- Historical Data and Forecast of Denmark Deboning Equipment Revenues & Volume for the Period 2022 - 2032
- Denmark Deboning Equipment Market Trend Evolution
- Denmark Deboning Equipment Market Drivers and Challenges
- Denmark Deboning Equipment Price Trends
- Denmark Deboning Equipment Porter's Five Forces
- Denmark Deboning Equipment Industry Life Cycle
- Historical Data and Forecast of Denmark Deboning Equipment Market Revenues & Volume By Type for the Period 2022 - 2032
- Historical Data and Forecast of Denmark Deboning Equipment Market Revenues & Volume By Chicken Meat for the Period 2022 - 2032
- Historical Data and Forecast of Denmark Deboning Equipment Market Revenues & Volume By Turkey Meat for the Period 2022 - 2032
- Historical Data and Forecast of Denmark Deboning Equipment Market Revenues & Volume By Duck Meat for the Period 2022 - 2032
- Historical Data and Forecast of Denmark Deboning Equipment Market Revenues & Volume By Product Type for the Period 2022 - 2032
- Historical Data and Forecast of Denmark Deboning Equipment Market Revenues & Volume By FreshProcessed for the Period 2022 - 2032
- Historical Data and Forecast of Denmark Deboning Equipment Market Revenues & Volume By Raw Cooked for the Period 2022 - 2032
- Historical Data and Forecast of Denmark Deboning Equipment Market Revenues & Volume By Pre-Cooked for the Period 2022 - 2032
- Historical Data and Forecast of Denmark Deboning Equipment Market Revenues & Volume By Raw Fermented Sausages for the Period 2022 - 2032
- Historical Data and Forecast of Denmark Deboning Equipment Market Revenues & Volume By Cured for the Period 2022 - 2032
- Historical Data and Forecast of Denmark Deboning Equipment Market Revenues & Volume By Dried for the Period 2022 - 2032
- Historical Data and Forecast of Denmark Deboning Equipment Market Revenues & Volume By Automation for the Period 2022 - 2032
- Historical Data and Forecast of Denmark Deboning Equipment Market Revenues & Volume By Fully Automated Line for the Period 2022 - 2032
- Historical Data and Forecast of Denmark Deboning Equipment Market Revenues & Volume By Semi-Automated Line for the Period 2022 - 2032
- Historical Data and Forecast of Denmark Deboning Equipment Market Revenues & Volume By Livestock for the Period 2022 - 2032
- Historical Data and Forecast of Denmark Deboning Equipment Market Revenues & Volume By Poultry for the Period 2022 - 2032
- Historical Data and Forecast of Denmark Deboning Equipment Market Revenues & Volume By Swine for the Period 2022 - 2032
- Historical Data and Forecast of Denmark Deboning Equipment Market Revenues & Volume By Bovine for the Period 2022 - 2032
- Historical Data and Forecast of Denmark Deboning Equipment Market Revenues & Volume By Seafood for the Period 2022 - 2032
- Denmark Deboning Equipment Import Export Trade Statistics
- Market Opportunity Assessment By Type
- Market Opportunity Assessment By Product Type
- Market Opportunity Assessment By Automation
- Market Opportunity Assessment By Livestock
- Denmark Deboning Equipment Top Companies Market Share
- Denmark Deboning Equipment Competitive Benchmarking By Technical and Operational Parameters
- Denmark Deboning Equipment Company Profiles
- Denmark Deboning Equipment Key Strategic Recommendations
Frequently Asked Questions About the Market Study (FAQs):
6Wresearch actively monitors the Denmark Deboning Equipment Market and publishes its comprehensive annual report, highlighting emerging trends, growth drivers, revenue analysis, and forecast outlook. Our insights help businesses to make data-backed strategic decisions with ongoing market dynamics. Our analysts track relevent industries related to the Denmark Deboning Equipment Market, allowing our clients with actionable intelligence and reliable forecasts tailored to emerging regional needs.
Yes, we provide customisation as per your requirements. To learn more, feel free to contact us on sales@6wresearch.com
1 Executive Summary |
2 Introduction |
2.1 Key Highlights of the Report |
2.2 Report Description |
2.3 Market Scope & Segmentation |
2.4 Research Methodology |
2.5 Assumptions |
3 Denmark Deboning Equipment Market Overview |
3.1 Denmark Country Macro Economic Indicators |
3.2 Denmark Deboning Equipment Market Revenues & Volume, 2022 & 2032F |
3.3 Denmark Deboning Equipment Market - Industry Life Cycle |
3.4 Denmark Deboning Equipment Market - Porter's Five Forces |
3.5 Denmark Deboning Equipment Market Revenues & Volume Share, By Type, 2022 & 2032F |
3.6 Denmark Deboning Equipment Market Revenues & Volume Share, By Product Type, 2022 & 2032F |
3.7 Denmark Deboning Equipment Market Revenues & Volume Share, By Automation, 2022 & 2032F |
3.8 Denmark Deboning Equipment Market Revenues & Volume Share, By Livestock, 2022 & 2032F |
4 Denmark Deboning Equipment Market Dynamics |
4.1 Impact Analysis |
4.2 Market Drivers |
4.2.1 Increasing demand for processed meat products in Denmark |
4.2.2 Technological advancements in deboning equipment leading to higher efficiency and productivity |
4.2.3 Government initiatives promoting automation and modernization in the food processing industry |
4.3 Market Restraints |
4.3.1 High initial investment and maintenance costs of deboning equipment |
4.3.2 Stringent regulations and standards governing food safety and hygiene in Denmark |
5 Denmark Deboning Equipment Market Trends |
6 Denmark Deboning Equipment Market, By Types |
6.1 Denmark Deboning Equipment Market, By Type |
6.1.1 Overview and Analysis |
6.1.2 Denmark Deboning Equipment Market Revenues & Volume, By Type, 2022 - 2032F |
6.1.3 Denmark Deboning Equipment Market Revenues & Volume, By Chicken Meat, 2022 - 2032F |
6.1.4 Denmark Deboning Equipment Market Revenues & Volume, By Turkey Meat, 2022 - 2032F |
6.1.5 Denmark Deboning Equipment Market Revenues & Volume, By Duck Meat, 2022 - 2032F |
6.2 Denmark Deboning Equipment Market, By Product Type |
6.2.1 Overview and Analysis |
6.2.2 Denmark Deboning Equipment Market Revenues & Volume, By FreshProcessed, 2022 - 2032F |
6.2.3 Denmark Deboning Equipment Market Revenues & Volume, By Raw Cooked, 2022 - 2032F |
6.2.4 Denmark Deboning Equipment Market Revenues & Volume, By Pre-Cooked, 2022 - 2032F |
6.2.5 Denmark Deboning Equipment Market Revenues & Volume, By Raw Fermented Sausages, 2022 - 2032F |
6.2.6 Denmark Deboning Equipment Market Revenues & Volume, By Cured, 2022 - 2032F |
6.2.7 Denmark Deboning Equipment Market Revenues & Volume, By Dried, 2022 - 2032F |
6.3 Denmark Deboning Equipment Market, By Automation |
6.3.1 Overview and Analysis |
6.3.2 Denmark Deboning Equipment Market Revenues & Volume, By Fully Automated Line, 2022 - 2032F |
6.3.3 Denmark Deboning Equipment Market Revenues & Volume, By Semi-Automated Line, 2022 - 2032F |
6.4 Denmark Deboning Equipment Market, By Livestock |
6.4.1 Overview and Analysis |
6.4.2 Denmark Deboning Equipment Market Revenues & Volume, By Poultry, 2022 - 2032F |
6.4.3 Denmark Deboning Equipment Market Revenues & Volume, By Swine, 2022 - 2032F |
6.4.4 Denmark Deboning Equipment Market Revenues & Volume, By Bovine, 2022 - 2032F |
6.4.5 Denmark Deboning Equipment Market Revenues & Volume, By Seafood, 2022 - 2032F |
7 Denmark Deboning Equipment Market Import-Export Trade Statistics |
7.1 Denmark Deboning Equipment Market Export to Major Countries |
7.2 Denmark Deboning Equipment Market Imports from Major Countries |
8 Denmark Deboning Equipment Market Key Performance Indicators |
8.1 Percentage increase in adoption of automated deboning equipment |
8.2 Average processing time reduction achieved by using modern deboning equipment |
8.3 Percentage improvement in yield and efficiency of deboning processes |
8.4 Number of new product developments enabled by advanced deboning technology |
8.5 Rate of compliance with food safety regulations and standards |
9 Denmark Deboning Equipment Market - Opportunity Assessment |
9.1 Denmark Deboning Equipment Market Opportunity Assessment, By Type, 2022 & 2032F |
9.2 Denmark Deboning Equipment Market Opportunity Assessment, By Product Type, 2022 & 2032F |
9.3 Denmark Deboning Equipment Market Opportunity Assessment, By Automation, 2022 & 2032F |
9.4 Denmark Deboning Equipment Market Opportunity Assessment, By Livestock, 2022 & 2032F |
10 Denmark Deboning Equipment Market - Competitive Landscape |
10.1 Denmark Deboning Equipment Market Revenue Share, By Companies, 2025 |
10.2 Denmark Deboning Equipment Market Competitive Benchmarking, By Operating and Technical Parameters |
11 Company Profiles |
12 Recommendations |
13 Disclaimer |
Global Go To Market Strategy - 2030
Export potential enables firms to identify high-growth global markets with greater confidence by combining advanced trade intelligence with a structured quantitative methodology. The framework analyzes emerging demand trends and country-level import patterns while integrating macroeconomic and trade datasets such as GDP and population forecasts, bilateral import–export flows, tariff structures, elasticity differentials between developed and developing economies, geographic distance, and import demand projections. Using weighted trade values from 2020–2024 as the base period to project country-to-country export potential for 2030, these inputs are operationalized through calculated drivers such as gravity model parameters, tariff impact factors, and projected GDP per-capita growth. Through an analysis of hidden potentials, demand hotspots, and market conditions that are most favorable to success, this method enables firms to focus on target countries, maximize returns, and global expansion with data, backed by accuracy.
By factoring in the projected importer demand gap that is currently unmet and could be potential opportunity, it identifies the potential for the Exporter (Country) among 190 countries, against the general trade analysis, which identifies the biggest importer or exporter.
To discover high-growth global markets and optimize your business strategy:
Click Here
Pricing
- Single User License$ 1,995
- Department License$ 2,400
- Site License$ 3,120
- Global License$ 3,795

Leadership Perspectives from Industry Events
Search
Thought Leadership and Analyst Meet


Our Clients
6WResearch In News
- Doha a strategic location for EV manufacturing hub: IPA Qatar
- Demand for luxury TVs surging in the GCC, says Samsung
- Empowering Growth: The Thriving Journey of Bangladesh’s Cable Industry
- Demand for luxury TVs surging in the GCC, says Samsung
- Video call with a traditional healer? Once unthinkable, it’s now common in South Africa
- Intelligent Buildings To Smooth GCC’s Path To Net Zero
Latest Reports
- New Zealand Aseptic Manufacturing Market (2026-2032)
- Netherlands Aseptic Manufacturing Market (2026-2032)
- Nauru Aseptic Manufacturing Market (2026-2032)
- Namibia Aseptic Manufacturing Market (2026-2032)
- Mozambique Aseptic Manufacturing Market (2026-2032)
- Montenegro Aseptic Manufacturing Market (2026-2032)
- Mongolia Aseptic Manufacturing Market (2026-2032)
- Monaco Aseptic Manufacturing Market (2026-2032)
- Micronesia Aseptic Manufacturing Market (2026-2032)
- Mauritius Aseptic Manufacturing Market (2026-2032)
Industry Events and Analyst Meet

HIMTEX 2026

India Refining Summit 2026

India EV Show 2026

EV tech India Expo 2026

Auto Tech Asia 2026
Whitepaper
- Middle East & Africa Commercial Security Market Click here to view more.
- Middle East & Africa Fire Safety Systems & Equipment Market Click here to view more.
- GCC Drone Market Click here to view more.
- Middle East Lighting Fixture Market Click here to view more.
- GCC Physical & Perimeter Security Market Click here to view more.