Denmark Direct Reduced Iron (DRI) Market (2026-2032) | Companies, Analysis, Competitive Landscape, Size & Revenue, Segmentation, Value, Trends, Share, Industry, Growth, Outlook, Forecast
Market Forecast By Form (Pellets, Lumps), By Production Process (Gas-based, Coal-based), By Grade (Grade A (FeM 81% Min), Grade B (FeM 78 To 80 %), Grade C (FeM < 78%)) And Competitive Landscape
| Product Code: ETC6957761 | Publication Date: Sep 2024 | Updated Date: Apr 2026 | Product Type: Market Research Report | |
| Publisher: 6Wresearch | Author: Sumit Sagar | No. of Pages: 75 | No. of Figures: 35 | No. of Tables: 20 |
Denmark Direct Reduced Iron (Dri) Market Size (2020-2030)
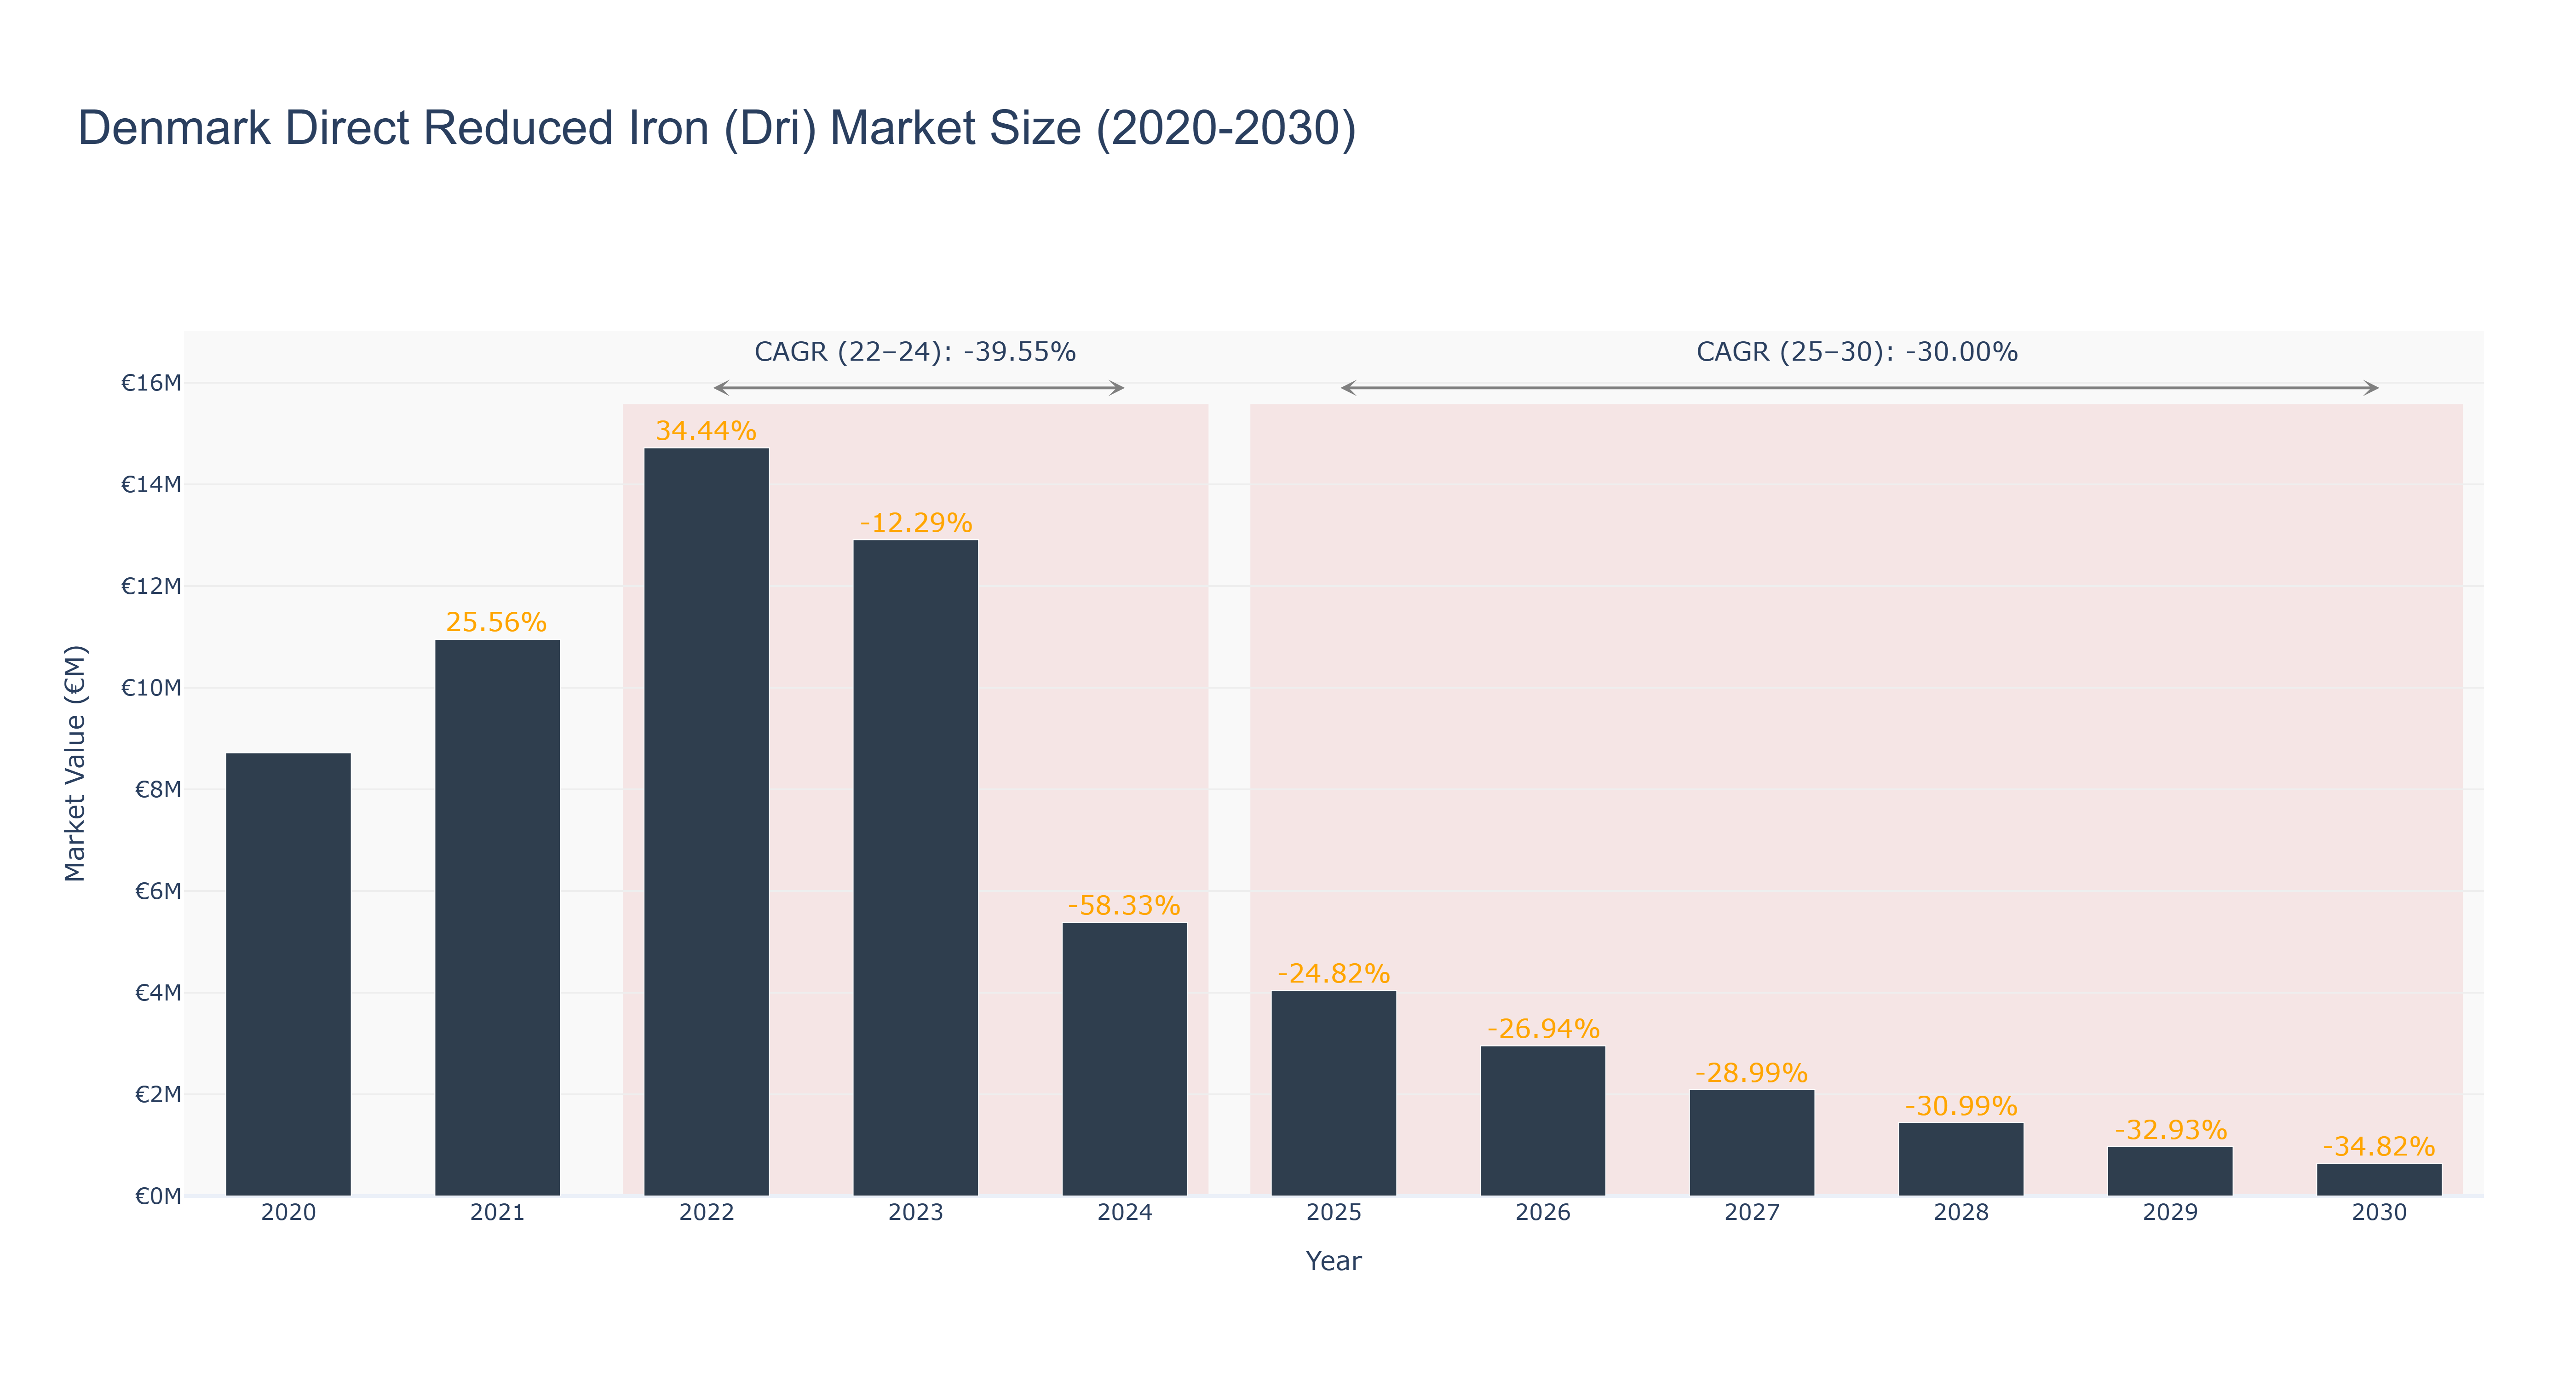
Denmark Direct Reduced Iron (DRI) Market experienced a peak market size of €14.72 million in 2022. The actual market size saw a significant decline from 2020 to 2024, dropping from €8.72 million to €5.38 million due to a negative growth trend. Forecasted market sizes from 2025 to 2030 continue to decrease, with the market expected to reach €0.63 million in 2030. The CAGR for the period 2022-24 was -39.55%, while for 2025-30, it stands at -30.0%. The downturn in the market can be attributed to various factors such as changing consumer preferences, economic conditions, and technological advancements in alternative industries. Looking ahead, Denmark is focusing on sustainable energy projects to boost its economy, with initiatives in renewable energy and green technology set to drive future growth in the DRI market.
Denmark Direct Reduced Iron (Dri) Market: Production & Trade Performance (2019-2025)
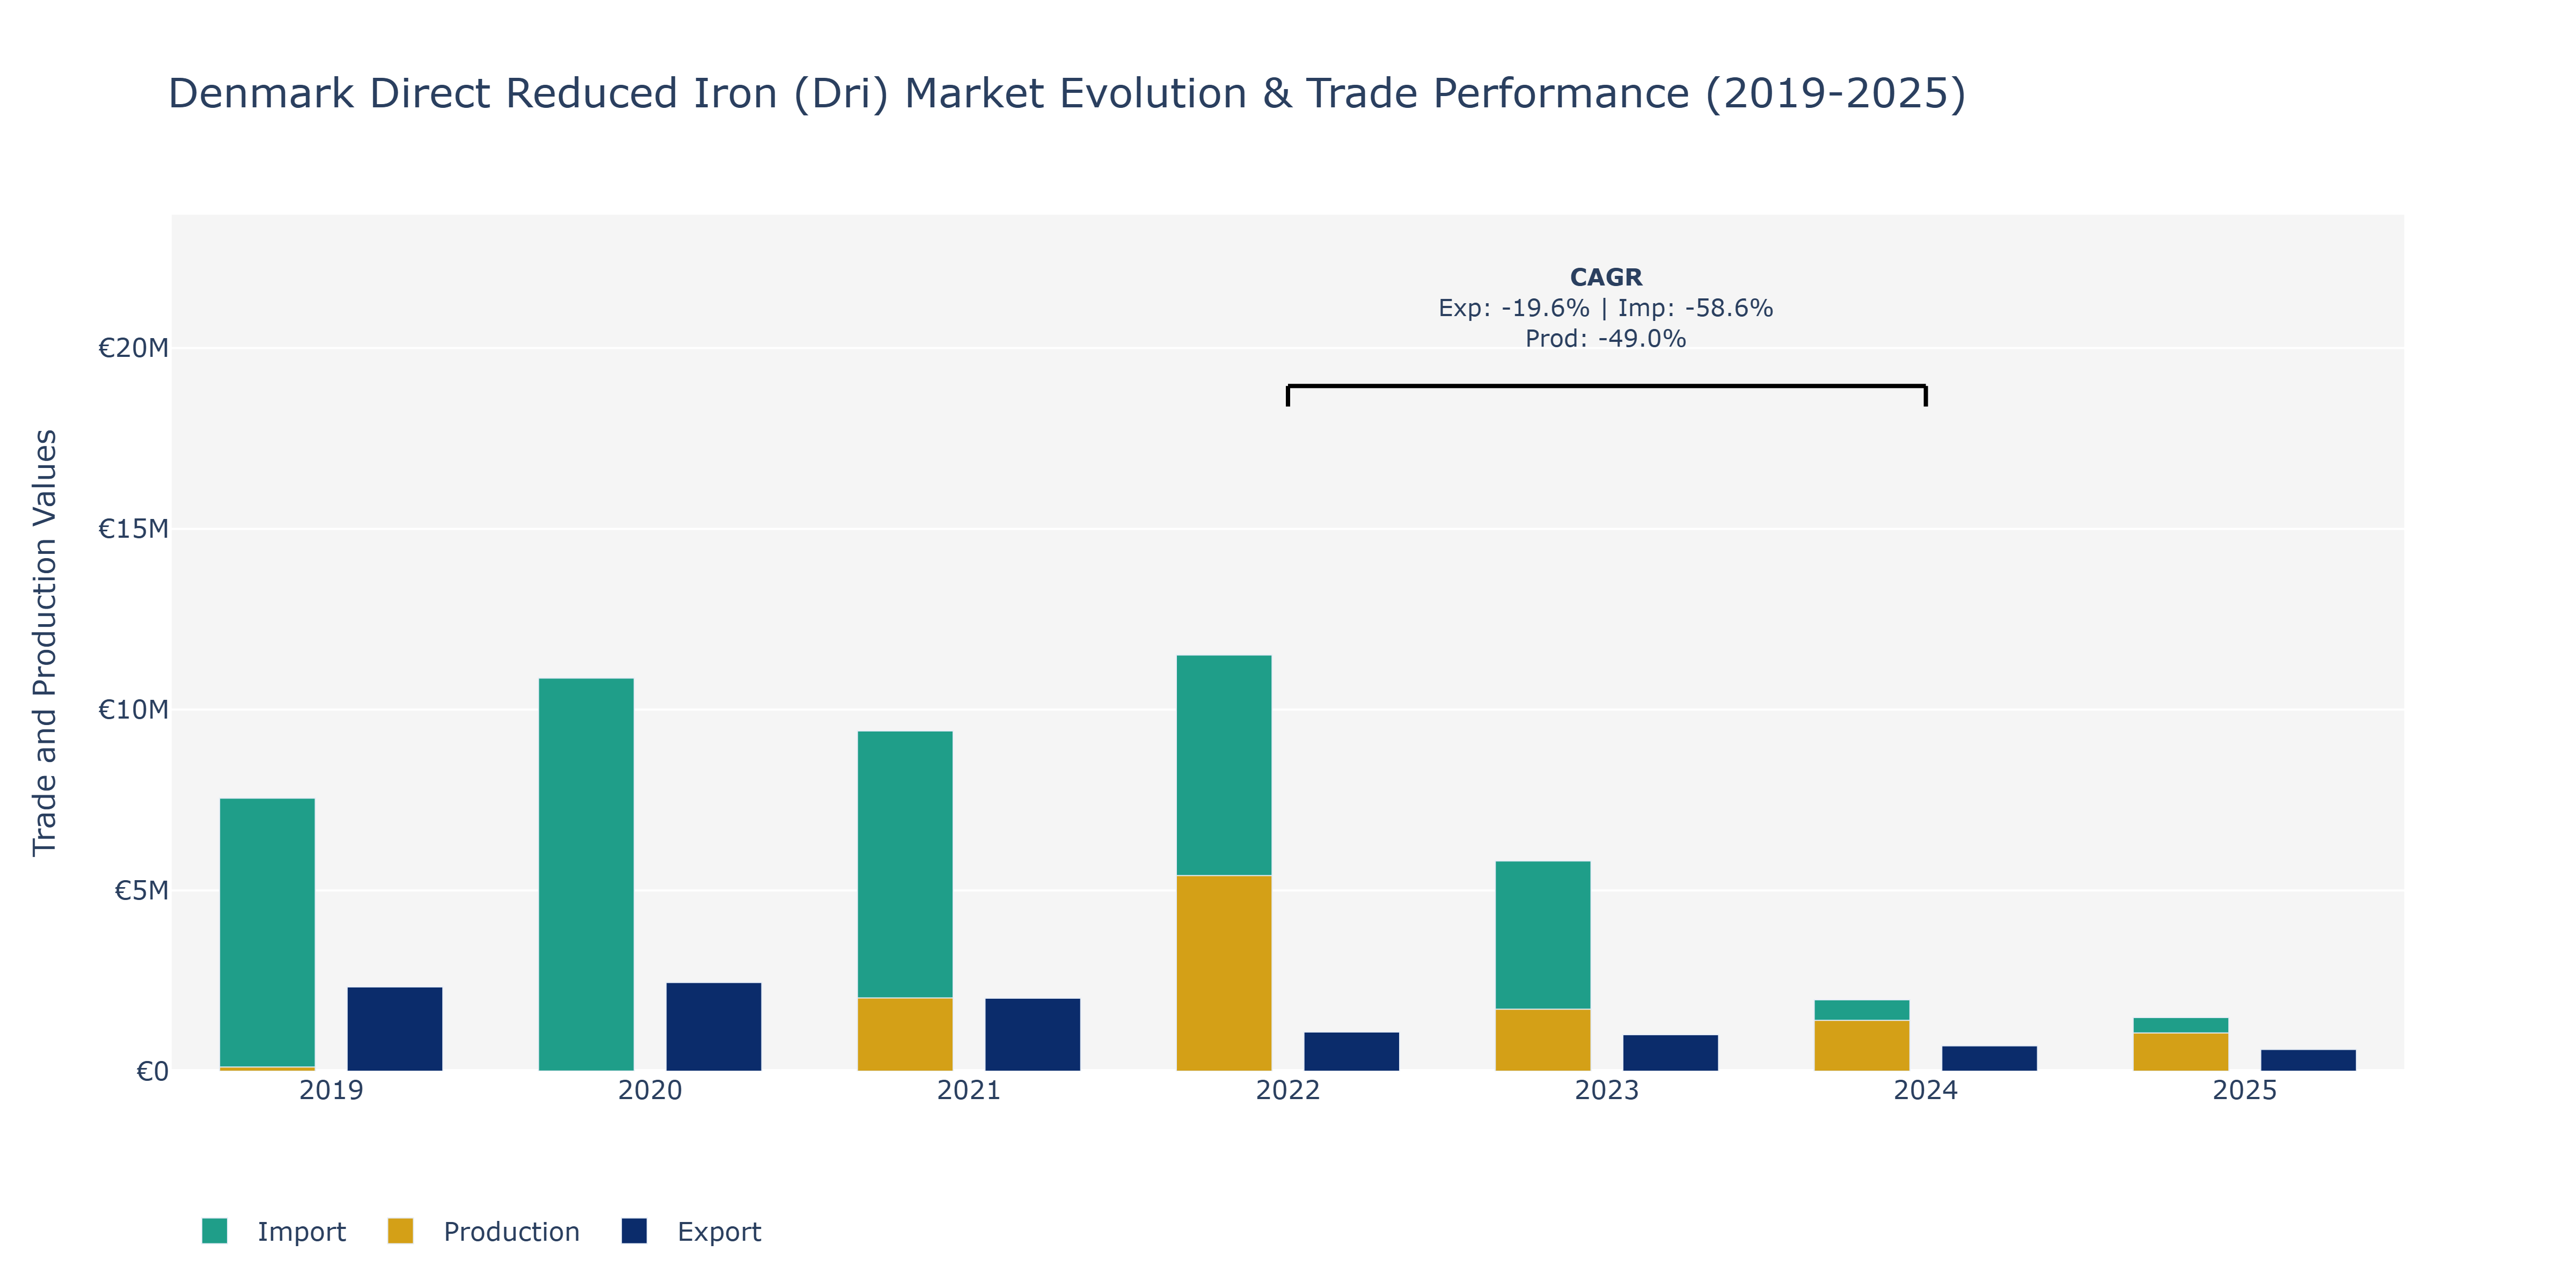
In the Denmark Direct Reduced Iron (DRI) market, exports demonstrated a fluctuating pattern over the years, starting at €2.33 million in 2019, increasing slightly in 2020 to €2.45 million, then declining notably in the following years, reaching €0.60 million in 2025. Imports, on the other hand, showed consistent growth from €7.55 million in 2019 to €11.51 million in 2022 before dropping to €1.48 million in 2025. Production saw a substantial increase from €0.11 million in 2019 to €2.03 million in 2021, followed by a decline to €1.06 million in 2025. The rise in production can be attributed to growing demand for DRI in the steel industry, while fluctuations in exports and imports could be influenced by changes in global market conditions, trade policies, and economic factors impacting the industry. This aligns with the broader trends of the steel market where supply chain disruptions and trade tensions can significantly impact trade flows and production levels.
Key Highlights of the Report:
- Denmark Direct Reduced Iron (DRI) Market Outlook
- Market Size of Denmark Direct Reduced Iron (DRI) Market, 2025
- Forecast of Denmark Direct Reduced Iron (DRI) Market, 2032
- Historical Data and Forecast of Denmark Direct Reduced Iron (DRI) Revenues & Volume for the Period 2022 - 2032
- Denmark Direct Reduced Iron (DRI) Market Trend Evolution
- Denmark Direct Reduced Iron (DRI) Market Drivers and Challenges
- Denmark Direct Reduced Iron (DRI) Price Trends
- Denmark Direct Reduced Iron (DRI) Porter's Five Forces
- Denmark Direct Reduced Iron (DRI) Industry Life Cycle
- Historical Data and Forecast of Denmark Direct Reduced Iron (DRI) Market Revenues & Volume By Form for the Period 2022 - 2032
- Historical Data and Forecast of Denmark Direct Reduced Iron (DRI) Market Revenues & Volume By Pellets for the Period 2022 - 2032
- Historical Data and Forecast of Denmark Direct Reduced Iron (DRI) Market Revenues & Volume By Lumps for the Period 2022 - 2032
- Historical Data and Forecast of Denmark Direct Reduced Iron (DRI) Market Revenues & Volume By Production Process for the Period 2022 - 2032
- Historical Data and Forecast of Denmark Direct Reduced Iron (DRI) Market Revenues & Volume By Gas-based for the Period 2022 - 2032
- Historical Data and Forecast of Denmark Direct Reduced Iron (DRI) Market Revenues & Volume By Coal-based for the Period 2022 - 2032
- Historical Data and Forecast of Denmark Direct Reduced Iron (DRI) Market Revenues & Volume By Grade for the Period 2022 - 2032
- Historical Data and Forecast of Denmark Direct Reduced Iron (DRI) Market Revenues & Volume By Grade A (FeM 81% Min) for the Period 2022 - 2032
- Historical Data and Forecast of Denmark Direct Reduced Iron (DRI) Market Revenues & Volume By Grade B (FeM 78 To 80 %) for the Period 2022 - 2032
- Historical Data and Forecast of Denmark Direct Reduced Iron (DRI) Market Revenues & Volume By Grade C (FeM < 78%) for the Period 2022 - 2032
- Denmark Direct Reduced Iron (DRI) Import Export Trade Statistics
- Market Opportunity Assessment By Form
- Market Opportunity Assessment By Production Process
- Market Opportunity Assessment By Grade
- Denmark Direct Reduced Iron (DRI) Top Companies Market Share
- Denmark Direct Reduced Iron (DRI) Competitive Benchmarking By Technical and Operational Parameters
- Denmark Direct Reduced Iron (DRI) Company Profiles
- Denmark Direct Reduced Iron (DRI) Key Strategic Recommendations
Frequently Asked Questions About the Market Study (FAQs):
6Wresearch actively monitors the Denmark Direct Reduced Iron (DRI) Market and publishes its comprehensive annual report, highlighting emerging trends, growth drivers, revenue analysis, and forecast outlook. Our insights help businesses to make data-backed strategic decisions with ongoing market dynamics. Our analysts track relevent industries related to the Denmark Direct Reduced Iron (DRI) Market, allowing our clients with actionable intelligence and reliable forecasts tailored to emerging regional needs.
Yes, we provide customisation as per your requirements. To learn more, feel free to contact us on sales@6wresearch.com
1 Executive Summary |
2 Introduction |
2.1 Key Highlights of the Report |
2.2 Report Description |
2.3 Market Scope & Segmentation |
2.4 Research Methodology |
2.5 Assumptions |
3 Denmark Direct Reduced Iron (DRI) Market Overview |
3.1 Denmark Country Macro Economic Indicators |
3.2 Denmark Direct Reduced Iron (DRI) Market Revenues & Volume, 2022 & 2032F |
3.3 Denmark Direct Reduced Iron (DRI) Market - Industry Life Cycle |
3.4 Denmark Direct Reduced Iron (DRI) Market - Porter's Five Forces |
3.5 Denmark Direct Reduced Iron (DRI) Market Revenues & Volume Share, By Form, 2022 & 2032F |
3.6 Denmark Direct Reduced Iron (DRI) Market Revenues & Volume Share, By Production Process, 2022 & 2032F |
3.7 Denmark Direct Reduced Iron (DRI) Market Revenues & Volume Share, By Grade, 2022 & 2032F |
4 Denmark Direct Reduced Iron (DRI) Market Dynamics |
4.1 Impact Analysis |
4.2 Market Drivers |
4.2.1 Growing demand for steel production in Denmark and Europe |
4.2.2 Favorable government regulations promoting the use of direct reduced iron (DRI) as a cleaner alternative to traditional iron production methods |
4.2.3 Increasing focus on sustainable and environmentally friendly production processes in the steel industry |
4.3 Market Restraints |
4.3.1 Fluctuating raw material prices impacting the cost of DRI production |
4.3.2 Competition from alternative iron production methods such as blast furnaces |
4.3.3 Technological challenges in scaling up DRI production capacities |
5 Denmark Direct Reduced Iron (DRI) Market Trends |
6 Denmark Direct Reduced Iron (DRI) Market, By Types |
6.1 Denmark Direct Reduced Iron (DRI) Market, By Form |
6.1.1 Overview and Analysis |
6.1.2 Denmark Direct Reduced Iron (DRI) Market Revenues & Volume, By Form, 2022 - 2032F |
6.1.3 Denmark Direct Reduced Iron (DRI) Market Revenues & Volume, By Pellets, 2022 - 2032F |
6.1.4 Denmark Direct Reduced Iron (DRI) Market Revenues & Volume, By Lumps, 2022 - 2032F |
6.2 Denmark Direct Reduced Iron (DRI) Market, By Production Process |
6.2.1 Overview and Analysis |
6.2.2 Denmark Direct Reduced Iron (DRI) Market Revenues & Volume, By Gas-based, 2022 - 2032F |
6.2.3 Denmark Direct Reduced Iron (DRI) Market Revenues & Volume, By Coal-based, 2022 - 2032F |
6.3 Denmark Direct Reduced Iron (DRI) Market, By Grade |
6.3.1 Overview and Analysis |
6.3.2 Denmark Direct Reduced Iron (DRI) Market Revenues & Volume, By Grade A (FeM 81% Min), 2022 - 2032F |
6.3.3 Denmark Direct Reduced Iron (DRI) Market Revenues & Volume, By Grade B (FeM 78 To 80 %), 2022 - 2032F |
6.3.4 Denmark Direct Reduced Iron (DRI) Market Revenues & Volume, By Grade C (FeM < 78%), 2022 - 2032F |
7 Denmark Direct Reduced Iron (DRI) Market Import-Export Trade Statistics |
7.1 Denmark Direct Reduced Iron (DRI) Market Export to Major Countries |
7.2 Denmark Direct Reduced Iron (DRI) Market Imports from Major Countries |
8 Denmark Direct Reduced Iron (DRI) Market Key Performance Indicators |
8.1 Energy efficiency of DRI production processes |
8.2 Carbon emissions reduction achieved by using DRI compared to traditional methods |
8.3 Investment in research and development for DRI technology improvements |
9 Denmark Direct Reduced Iron (DRI) Market - Opportunity Assessment |
9.1 Denmark Direct Reduced Iron (DRI) Market Opportunity Assessment, By Form, 2022 & 2032F |
9.2 Denmark Direct Reduced Iron (DRI) Market Opportunity Assessment, By Production Process, 2022 & 2032F |
9.3 Denmark Direct Reduced Iron (DRI) Market Opportunity Assessment, By Grade, 2022 & 2032F |
10 Denmark Direct Reduced Iron (DRI) Market - Competitive Landscape |
10.1 Denmark Direct Reduced Iron (DRI) Market Revenue Share, By Companies, 2025 |
10.2 Denmark Direct Reduced Iron (DRI) Market Competitive Benchmarking, By Operating and Technical Parameters |
11 Company Profiles |
12 Recommendations |
13 Disclaimer |
Global Go To Market Strategy - 2030
Export potential enables firms to identify high-growth global markets with greater confidence by combining advanced trade intelligence with a structured quantitative methodology. The framework analyzes emerging demand trends and country-level import patterns while integrating macroeconomic and trade datasets such as GDP and population forecasts, bilateral import–export flows, tariff structures, elasticity differentials between developed and developing economies, geographic distance, and import demand projections. Using weighted trade values from 2020–2024 as the base period to project country-to-country export potential for 2030, these inputs are operationalized through calculated drivers such as gravity model parameters, tariff impact factors, and projected GDP per-capita growth. Through an analysis of hidden potentials, demand hotspots, and market conditions that are most favorable to success, this method enables firms to focus on target countries, maximize returns, and global expansion with data, backed by accuracy.
By factoring in the projected importer demand gap that is currently unmet and could be potential opportunity, it identifies the potential for the Exporter (Country) among 190 countries, against the general trade analysis, which identifies the biggest importer or exporter.
To discover high-growth global markets and optimize your business strategy:
Click Here
Pricing
- Single User License$ 1,995
- Department License$ 2,400
- Site License$ 3,120
- Global License$ 3,795

Leadership Perspectives from Industry Events
Search
Thought Leadership and Analyst Meet


Our Clients
6WResearch In News
- Doha a strategic location for EV manufacturing hub: IPA Qatar
- Demand for luxury TVs surging in the GCC, says Samsung
- Empowering Growth: The Thriving Journey of Bangladesh’s Cable Industry
- Demand for luxury TVs surging in the GCC, says Samsung
- Video call with a traditional healer? Once unthinkable, it’s now common in South Africa
- Intelligent Buildings To Smooth GCC’s Path To Net Zero
Latest Reports
- New Zealand Aseptic Manufacturing Market (2026-2032)
- Netherlands Aseptic Manufacturing Market (2026-2032)
- Nauru Aseptic Manufacturing Market (2026-2032)
- Namibia Aseptic Manufacturing Market (2026-2032)
- Mozambique Aseptic Manufacturing Market (2026-2032)
- Montenegro Aseptic Manufacturing Market (2026-2032)
- Mongolia Aseptic Manufacturing Market (2026-2032)
- Monaco Aseptic Manufacturing Market (2026-2032)
- Micronesia Aseptic Manufacturing Market (2026-2032)
- Mauritius Aseptic Manufacturing Market (2026-2032)
Industry Events and Analyst Meet

HIMTEX 2026

India Refining Summit 2026

India EV Show 2026

EV tech India Expo 2026

Auto Tech Asia 2026
Whitepaper
- Middle East & Africa Commercial Security Market Click here to view more.
- Middle East & Africa Fire Safety Systems & Equipment Market Click here to view more.
- GCC Drone Market Click here to view more.
- Middle East Lighting Fixture Market Click here to view more.
- GCC Physical & Perimeter Security Market Click here to view more.