Denmark Ferro Silicon Zirconium Market (2025-2031) | Companies, Industry, Growth, Trends, Forecast, Revenue, Share, Analysis, Outlook, Value, Segmentation & Size
Market Forecast By Type (Zr45%-55%, Zr35%-45%, Zr30%-40%), By Application (Welding Material, Spraying, Powder Metallurgy) And Competitive Landscape
| Product Code: ETC4921823 | Publication Date: Nov 2023 | Updated Date: Dec 2025 | Product Type: Market Research Report | |
| Publisher: 6Wresearch | Author: Sachin Kumar Rai | No. of Pages: 60 | No. of Figures: 30 | No. of Tables: 5 |
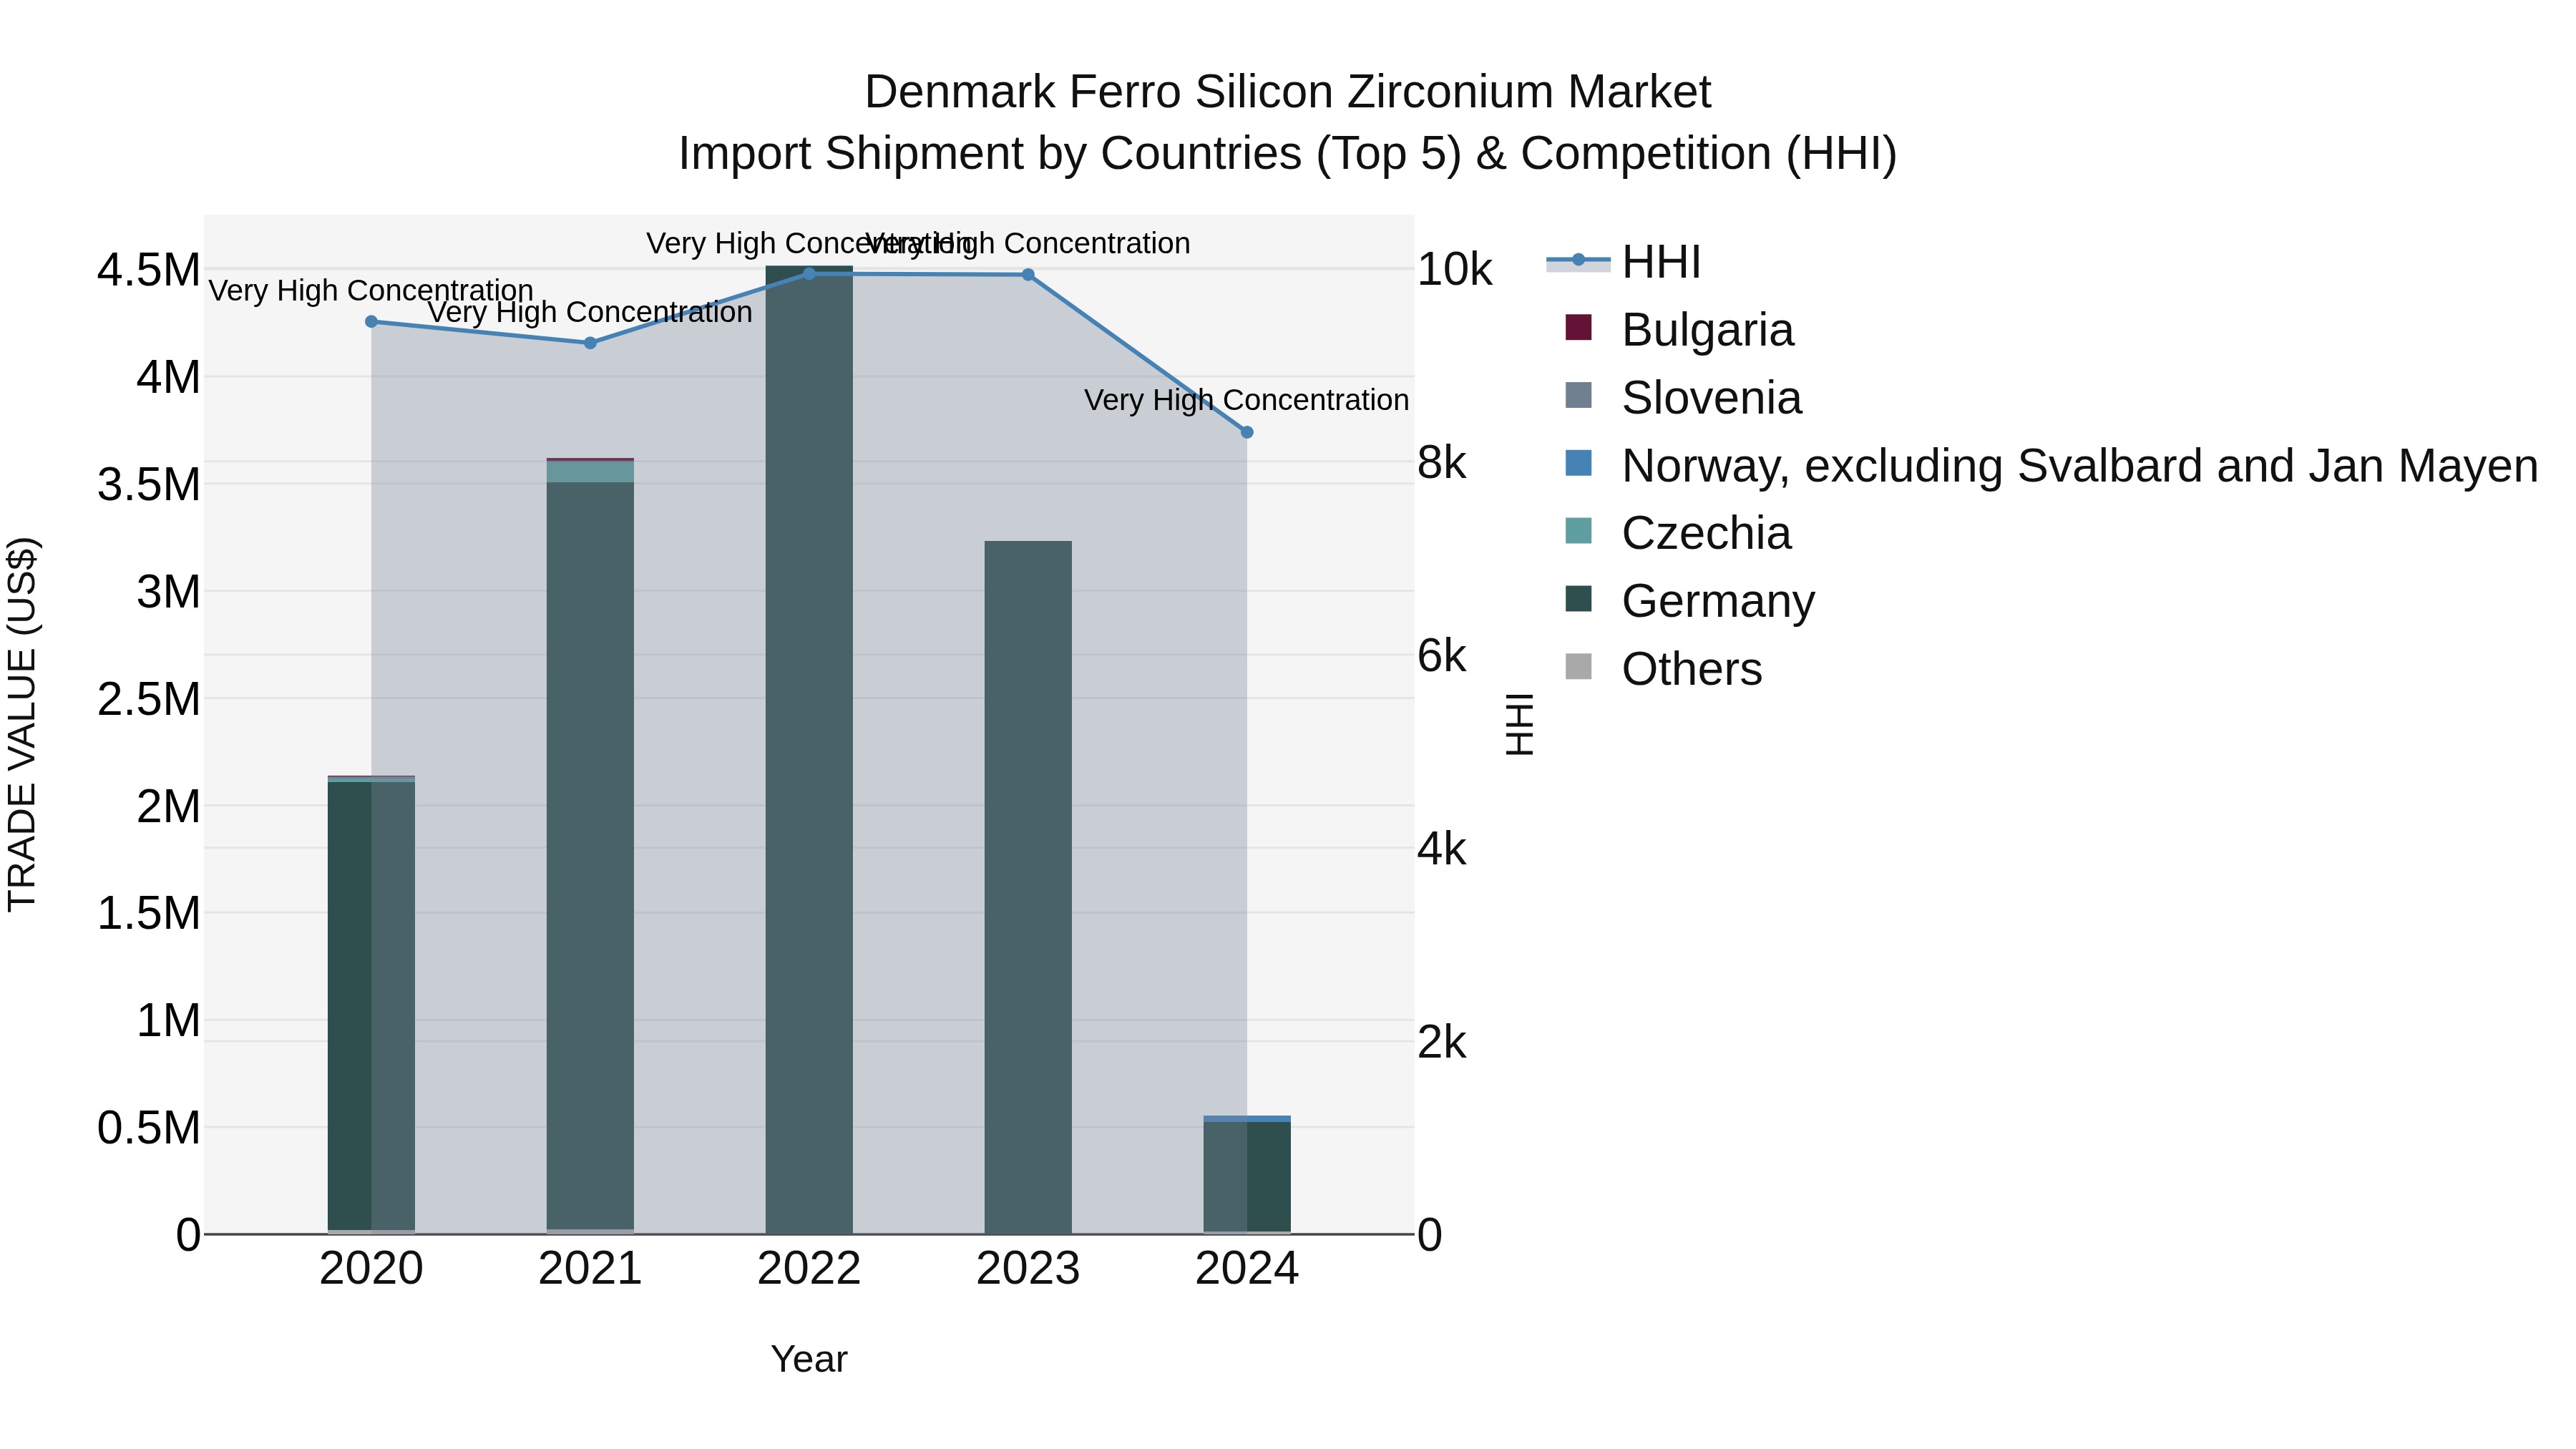
Denmark Ferro Silicon Zirconium Market Top 5 Importing Countries and Market Competition (HHI) Analysis
Denmark ferro silicon zirconium import shipments in 2024 continued to be dominated by key exporting countries such as Germany, Norway (excluding Svalbard and Jan Mayen), Sweden, China, and the USA. The Herfindahl-Hirschman Index (HHI) indicated a high level of market concentration throughout the year. However, the compound annual growth rate (CAGR) from 2020 to 2024 saw a significant decline of -28.72%, with a sharp negative growth rate of -82.92% from 2023 to 2024, reflecting potential challenges or shifts in the market dynamics for ferro silicon zirconium imports in Denmark.
Denmark Ferro Silicon Zirconium Market Overview
The Denmark ferro silicon zirconium market is characterized by its use as an additive in steel production to improve grain refinement and enhance mechanical properties. The market is driven by demand from the steel and foundry industries, which seek to produce high-quality, durable steel products for various applications, including construction and manufacturing.
Drivers of the market
The Denmark ferro silicon zirconium market is driven by its extensive use in the steel and foundry industries as a deoxidizer and grain refiner. The increasing demand for high-quality steel and the need for improved mechanical properties in cast iron products are key factors driving the market. Additionally, the growth of the automotive and construction sectors, which require high-strength and durable materials, supports the demand for ferro silicon zirconium.
Challenges of the market
The ferro silicon zirconium market faces challenges stemming from the fluctuating prices of raw materials and competition from alternative alloys. As industries seek more cost-effective solutions, manufacturers must demonstrate the unique benefits of ferro silicon zirconium to maintain market share. Additionally, environmental regulations surrounding the production processes may impose additional operational costs. The global supply chain dynamics, influenced by geopolitical factors, can also disrupt availability and pricing.
Government Policy of the market
The ferro silicon zirconium market in Denmark is influenced by environmental regulations that require sustainable practices in metallurgy. The government promotes the recycling of metal and encourages the use of cleaner production methods. Financial incentives for research in reducing emissions during the production of ferro alloys are also part of the governments strategy to support this market.
Key Highlights of the Report:
- Denmark Ferro Silicon Zirconium Market Outlook
- Market Size of Denmark Ferro Silicon Zirconium Market, 2024
- Forecast of Denmark Ferro Silicon Zirconium Market, 2031
- Historical Data and Forecast of Denmark Ferro Silicon Zirconium Revenues & Volume for the Period 2021-2031
- Denmark Ferro Silicon Zirconium Market Trend Evolution
- Denmark Ferro Silicon Zirconium Market Drivers and Challenges
- Denmark Ferro Silicon Zirconium Price Trends
- Denmark Ferro Silicon Zirconium Porter`s Five Forces
- Denmark Ferro Silicon Zirconium Industry Life Cycle
- Historical Data and Forecast of Denmark Ferro Silicon Zirconium Market Revenues & Volume By Type for the Period 2021-2031
- Historical Data and Forecast of Denmark Ferro Silicon Zirconium Market Revenues & Volume By Zr45%-55% for the Period 2021-2031
- Historical Data and Forecast of Denmark Ferro Silicon Zirconium Market Revenues & Volume By Zr35%-45% for the Period 2021-2031
- Historical Data and Forecast of Denmark Ferro Silicon Zirconium Market Revenues & Volume By Zr30%-40% for the Period 2021-2031
- Historical Data and Forecast of Denmark Ferro Silicon Zirconium Market Revenues & Volume By Application for the Period 2021-2031
- Historical Data and Forecast of Denmark Ferro Silicon Zirconium Market Revenues & Volume By Welding Material for the Period 2021-2031
- Historical Data and Forecast of Denmark Ferro Silicon Zirconium Market Revenues & Volume By Spraying for the Period 2021-2031
- Historical Data and Forecast of Denmark Ferro Silicon Zirconium Market Revenues & Volume By Powder Metallurgy for the Period 2021-2031
- Denmark Ferro Silicon Zirconium Import Export Trade Statistics
- Market Opportunity Assessment By Type
- Market Opportunity Assessment By Application
- Denmark Ferro Silicon Zirconium Top Companies Market Share
- Denmark Ferro Silicon Zirconium Competitive Benchmarking By Technical and Operational Parameters
- Denmark Ferro Silicon Zirconium Company Profiles
- Denmark Ferro Silicon Zirconium Key Strategic Recommendations
Frequently Asked Questions About the Market Study (FAQs):
6Wresearch actively monitors the Denmark Ferro Silicon Zirconium Market and publishes its comprehensive annual report, highlighting emerging trends, growth drivers, revenue analysis, and forecast outlook. Our insights help businesses to make data-backed strategic decisions with ongoing market dynamics. Our analysts track relevent industries related to the Denmark Ferro Silicon Zirconium Market, allowing our clients with actionable intelligence and reliable forecasts tailored to emerging regional needs.
Yes, we provide customisation as per your requirements. To learn more, feel free to contact us on sales@6wresearch.com
1 Executive Summary |
2 Introduction |
2.1 Key Highlights of the Report |
2.2 Report Description |
2.3 Market Scope & Segmentation |
2.4 Research Methodology |
2.5 Assumptions |
3 Denmark Ferro Silicon Zirconium Market Overview |
3.1 Denmark Country Macro Economic Indicators |
3.2 Denmark Ferro Silicon Zirconium Market Revenues & Volume, 2021 & 2031F |
3.3 Denmark Ferro Silicon Zirconium Market - Industry Life Cycle |
3.4 Denmark Ferro Silicon Zirconium Market - Porter's Five Forces |
3.5 Denmark Ferro Silicon Zirconium Market Revenues & Volume Share, By Type, 2021 & 2031F |
3.6 Denmark Ferro Silicon Zirconium Market Revenues & Volume Share, By Application, 2021 & 2031F |
4 Denmark Ferro Silicon Zirconium Market Dynamics |
4.1 Impact Analysis |
4.2 Market Drivers |
4.2.1 Growing demand for steel production in Denmark |
4.2.2 Increasing use of ferro silicon zirconium in the automotive industry for manufacturing lightweight and durable components |
4.2.3 Rise in construction activities and infrastructure development projects in Denmark |
4.3 Market Restraints |
4.3.1 Volatility in raw material prices impacting production costs |
4.3.2 Environmental regulations and sustainability concerns affecting the production processes |
4.3.3 Competition from alternative materials impacting the market demand |
5 Denmark Ferro Silicon Zirconium Market Trends |
6 Denmark Ferro Silicon Zirconium Market Segmentations |
6.1 Denmark Ferro Silicon Zirconium Market, By Type |
6.1.1 Overview and Analysis |
6.1.2 Denmark Ferro Silicon Zirconium Market Revenues & Volume, By Zr45%-55%, 2021-2031F |
6.1.3 Denmark Ferro Silicon Zirconium Market Revenues & Volume, By Zr35%-45%, 2021-2031F |
6.1.4 Denmark Ferro Silicon Zirconium Market Revenues & Volume, By Zr30%-40%, 2021-2031F |
6.2 Denmark Ferro Silicon Zirconium Market, By Application |
6.2.1 Overview and Analysis |
6.2.2 Denmark Ferro Silicon Zirconium Market Revenues & Volume, By Welding Material, 2021-2031F |
6.2.3 Denmark Ferro Silicon Zirconium Market Revenues & Volume, By Spraying, 2021-2031F |
6.2.4 Denmark Ferro Silicon Zirconium Market Revenues & Volume, By Powder Metallurgy, 2021-2031F |
7 Denmark Ferro Silicon Zirconium Market Import-Export Trade Statistics |
7.1 Denmark Ferro Silicon Zirconium Market Export to Major Countries |
7.2 Denmark Ferro Silicon Zirconium Market Imports from Major Countries |
8 Denmark Ferro Silicon Zirconium Market Key Performance Indicators |
8.1 Average selling price of ferro silicon zirconium in Denmark |
8.2 Percentage of ferro silicon zirconium used in the steel industry in Denmark |
8.3 Number of new construction projects utilizing ferro silicon zirconium in Denmark |
9 Denmark Ferro Silicon Zirconium Market - Opportunity Assessment |
9.1 Denmark Ferro Silicon Zirconium Market Opportunity Assessment, By Type, 2021 & 2031F |
9.2 Denmark Ferro Silicon Zirconium Market Opportunity Assessment, By Application, 2021 & 2031F |
10 Denmark Ferro Silicon Zirconium Market - Competitive Landscape |
10.1 Denmark Ferro Silicon Zirconium Market Revenue Share, By Companies, 2024 |
10.2 Denmark Ferro Silicon Zirconium Market Competitive Benchmarking, By Operating and Technical Parameters |
11 Company Profiles |
12 Recommendations | 13 Disclaimer |
Global Go To Market Strategy - 2030
Export potential enables firms to identify high-growth global markets with greater confidence by combining advanced trade intelligence with a structured quantitative methodology. The framework analyzes emerging demand trends and country-level import patterns while integrating macroeconomic and trade datasets such as GDP and population forecasts, bilateral import–export flows, tariff structures, elasticity differentials between developed and developing economies, geographic distance, and import demand projections. Using weighted trade values from 2020–2024 as the base period to project country-to-country export potential for 2030, these inputs are operationalized through calculated drivers such as gravity model parameters, tariff impact factors, and projected GDP per-capita growth. Through an analysis of hidden potentials, demand hotspots, and market conditions that are most favorable to success, this method enables firms to focus on target countries, maximize returns, and global expansion with data, backed by accuracy.
By factoring in the projected importer demand gap that is currently unmet and could be potential opportunity, it identifies the potential for the Exporter (Country) among 190 countries, against the general trade analysis, which identifies the biggest importer or exporter.
To discover high-growth global markets and optimize your business strategy:
Click Here
Pricing
- Single User License$ 1,995
- Department License$ 2,400
- Site License$ 3,120
- Global License$ 3,795

Leadership Perspectives from Industry Events
Search
Thought Leadership and Analyst Meet


Our Clients
6WResearch In News
- India Export Attractiveness Tracker 2026
- India Air Conditioner Market Set for Strong Rebound in 2026 After Weather-Led Correction and GST-Driven Recovery: 6Wresearch
- ADAS in India: How Automatic Emergency Braking, Blind Spot Detection & Driver Monitoring are Transforming Road Safety
- Doha a strategic location for EV manufacturing hub: IPA Qatar
- Demand for luxury TVs surging in the GCC, says Samsung
- Empowering Growth: The Thriving Journey of Bangladesh’s Cable Industry
Latest Reports
- Nicaragua RPG Gaming Market (2026-2032)
- New Zealand RPG Gaming Market (2026-2032)
- Netherlands RPG Gaming Market (2026-2032)
- Nauru RPG Gaming Market (2026-2032)
- Namibia RPG Gaming Market (2026-2032)
- Mozambique RPG Gaming Market (2026-2032)
- Montenegro RPG Gaming Market (2026-2032)
- Mongolia RPG Gaming Market (2026-2032)
- Monaco RPG Gaming Market (2026-2032)
- Micronesia RPG Gaming Market (2026-2032)
Industry Events and Analyst Meet

EV India Expo 2026

HIMTEX 2026

India Refining Summit 2026

India EV Show 2026

EV tech India Expo 2026
Whitepaper
- Middle East & Africa Commercial Security Market Click here to view more.
- Middle East & Africa Fire Safety Systems & Equipment Market Click here to view more.
- GCC Drone Market Click here to view more.
- Middle East Lighting Fixture Market Click here to view more.
- GCC Physical & Perimeter Security Market Click here to view more.