Denmark Flash Field Programmable Gate Array Market (2025-2031) | Industry, Trends, Segmentation, Companies, Competitive Landscape, Forecast, Value, Analysis, Growth, Share, Outlook, Size & Revenue
Market Forecast By Node Size (Less Than 28 NM, 2890 NM, More Than 90 NM), By Configuration (Low-End FPGA, Mid-Range FPGA, High-End FPGA), By Vertical (Telecommunications, Consumer Electronics, Test, Military and Aerospace, Industrial, Automotive, Healthcare, Multimedia) And Competitive Landscape
| Product Code: ETC6959481 | Publication Date: Sep 2024 | Updated Date: Dec 2025 | Product Type: Market Research Report | |
| Publisher: 6Wresearch | Author: Vasudha | No. of Pages: 75 | No. of Figures: 35 | No. of Tables: 20 |
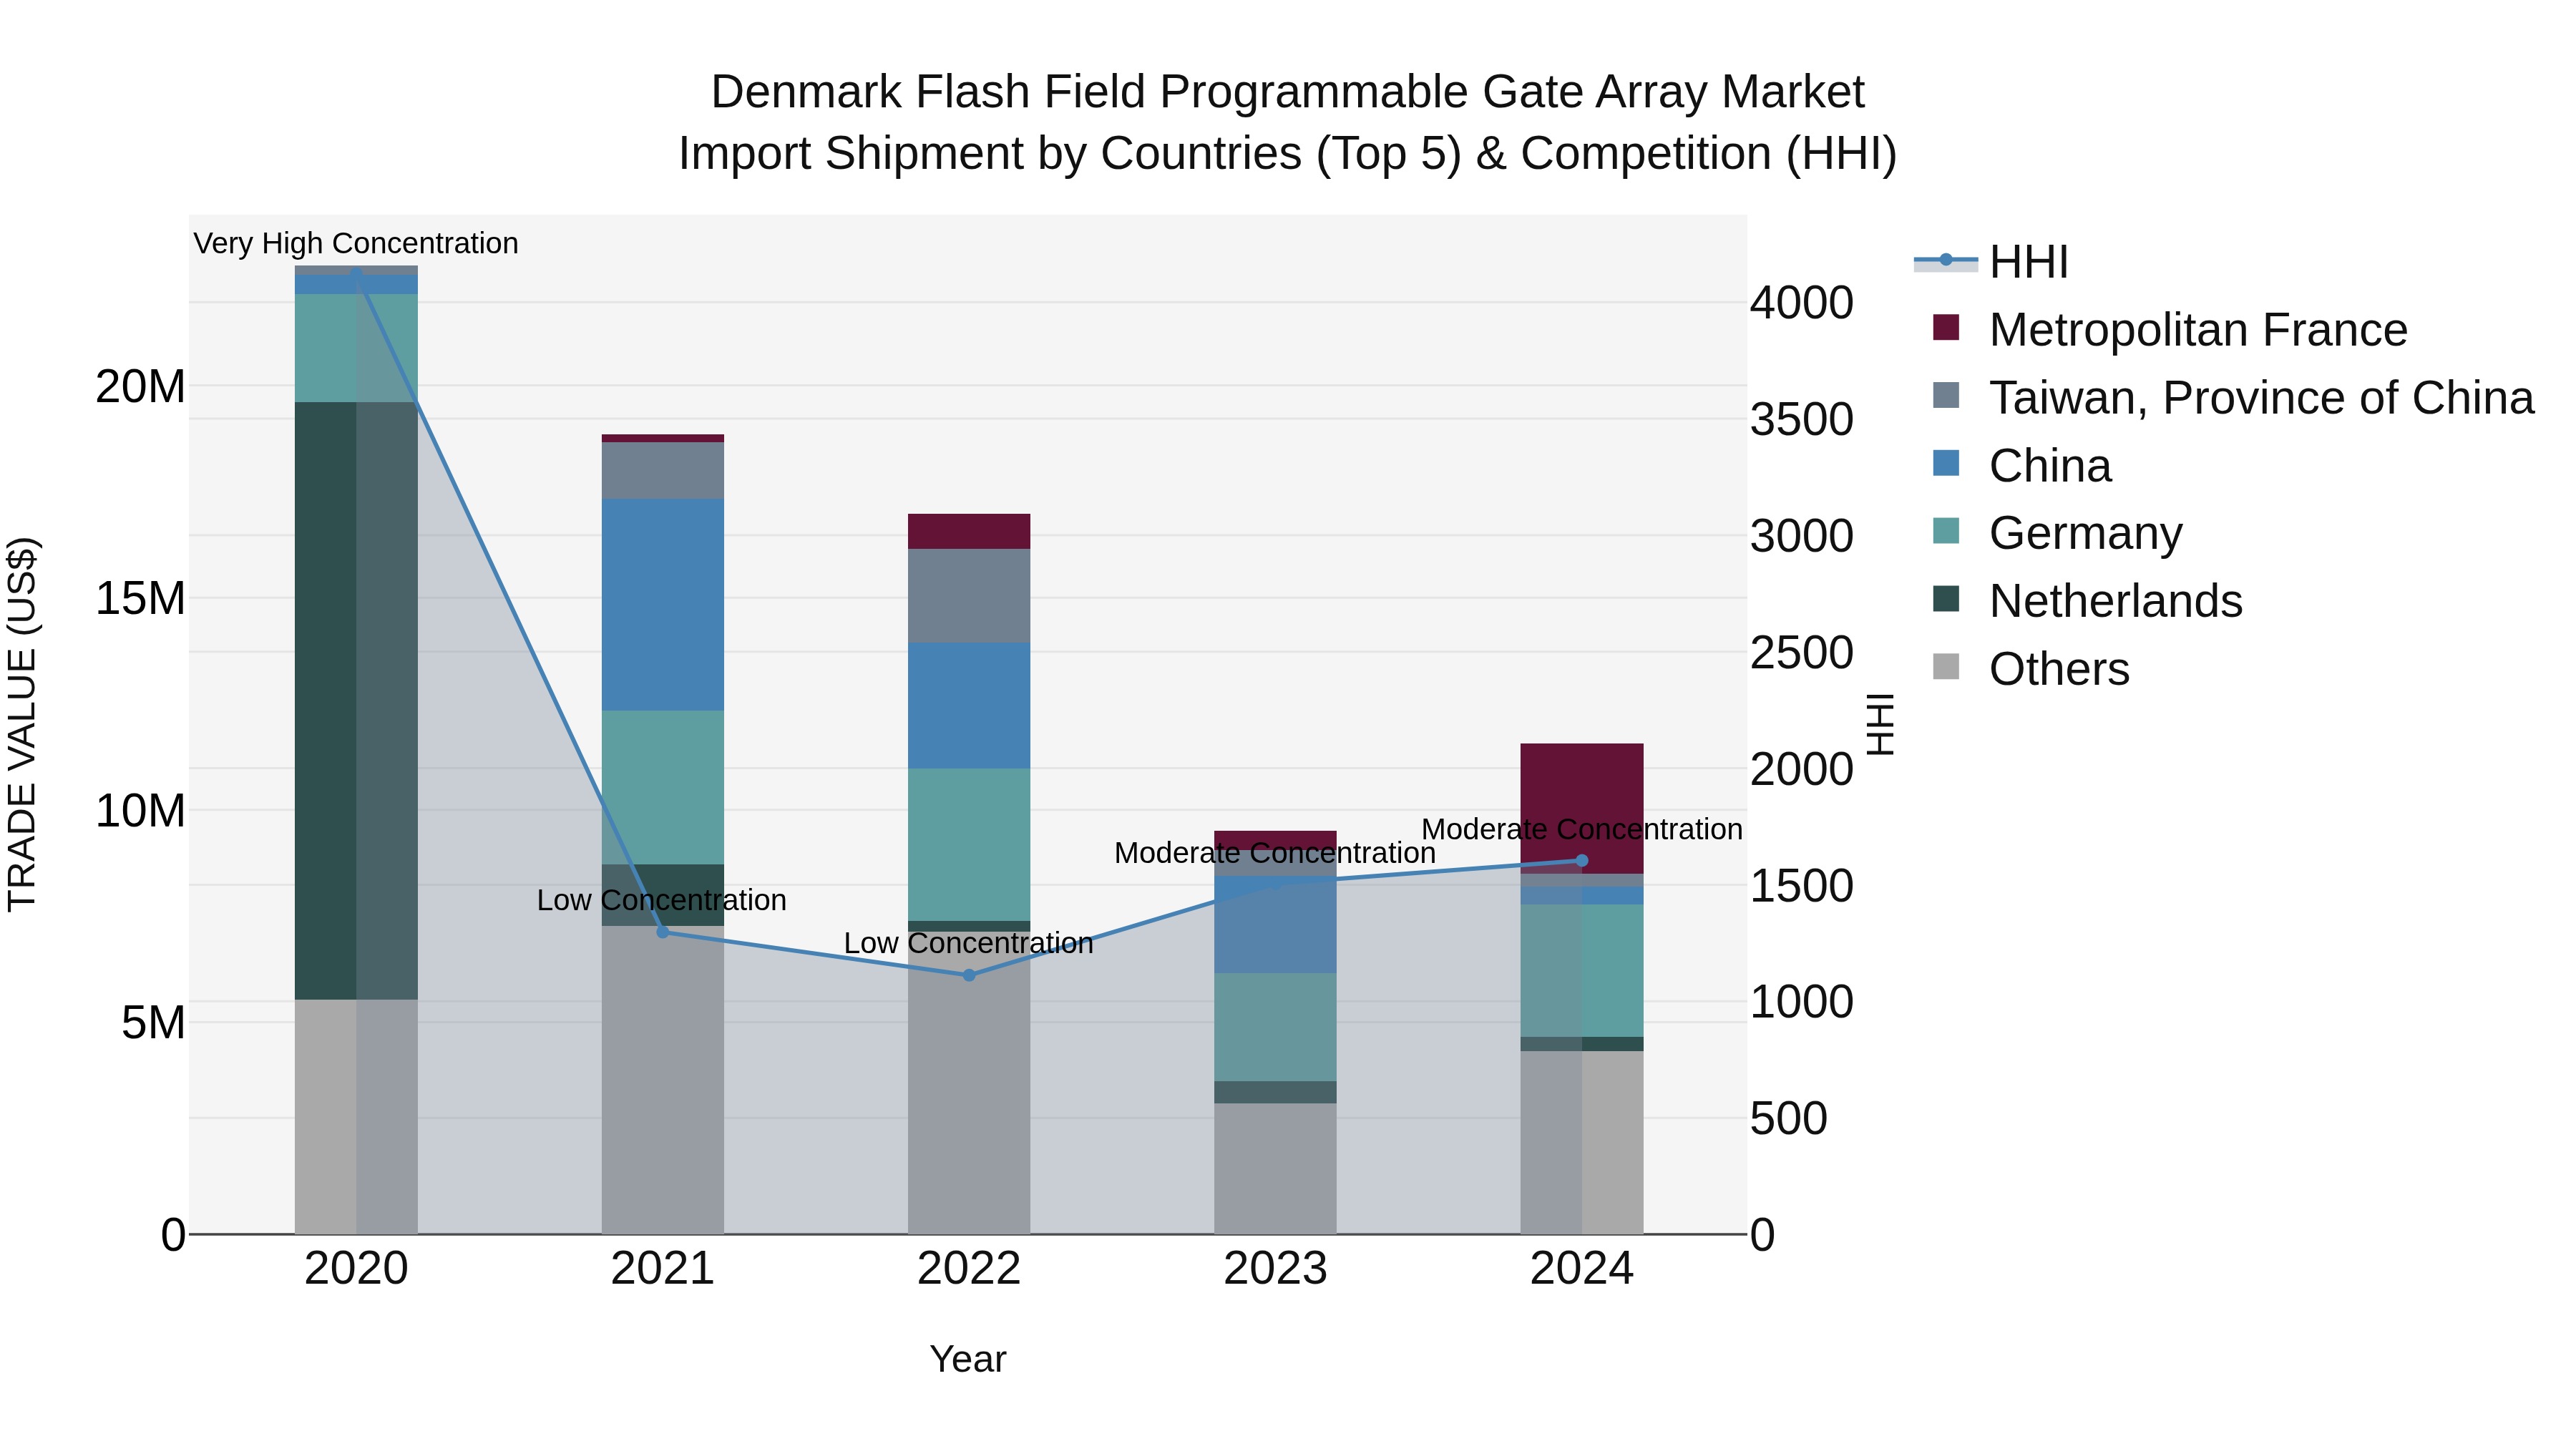
Denmark Flash Field Programmable Gate Array Market Top 5 Importing Countries and Market Competition (HHI) Analysis
In 2024, Denmark saw steady imports of field programmable gate arrays from top countries like Germany, Metropolitan France, Belgium, Poland, and Ireland. Despite a moderate concentration of the Herfindahl-Hirschman Index (HHI), the market experienced a negative compound annual growth rate (CAGR) of -15.62% from 2020 to 2024. However, there was a notable growth rebound in 2024 with a positive growth rate of 21.69% from the previous year, indicating a potential resurgence in demand for these products in the Danish market.
Key Highlights of the Report:
- Denmark Flash Field Programmable Gate Array Market Outlook
- Market Size of Denmark Flash Field Programmable Gate Array Market, 2024
- Forecast of Denmark Flash Field Programmable Gate Array Market, 2031
- Historical Data and Forecast of Denmark Flash Field Programmable Gate Array Revenues & Volume for the Period 2021- 2031
- Denmark Flash Field Programmable Gate Array Market Trend Evolution
- Denmark Flash Field Programmable Gate Array Market Drivers and Challenges
- Denmark Flash Field Programmable Gate Array Price Trends
- Denmark Flash Field Programmable Gate Array Porter's Five Forces
- Denmark Flash Field Programmable Gate Array Industry Life Cycle
- Historical Data and Forecast of Denmark Flash Field Programmable Gate Array Market Revenues & Volume By Node Size for the Period 2021- 2031
- Historical Data and Forecast of Denmark Flash Field Programmable Gate Array Market Revenues & Volume By Less Than 28 NM for the Period 2021- 2031
- Historical Data and Forecast of Denmark Flash Field Programmable Gate Array Market Revenues & Volume By 2890 NM for the Period 2021- 2031
- Historical Data and Forecast of Denmark Flash Field Programmable Gate Array Market Revenues & Volume By More Than 90 NM for the Period 2021- 2031
- Historical Data and Forecast of Denmark Flash Field Programmable Gate Array Market Revenues & Volume By Configuration for the Period 2021- 2031
- Historical Data and Forecast of Denmark Flash Field Programmable Gate Array Market Revenues & Volume By Low-End FPGA for the Period 2021- 2031
- Historical Data and Forecast of Denmark Flash Field Programmable Gate Array Market Revenues & Volume By Mid-Range FPGA for the Period 2021- 2031
- Historical Data and Forecast of Denmark Flash Field Programmable Gate Array Market Revenues & Volume By High-End FPGA for the Period 2021- 2031
- Historical Data and Forecast of Denmark Flash Field Programmable Gate Array Market Revenues & Volume By Vertical for the Period 2021- 2031
- Historical Data and Forecast of Denmark Flash Field Programmable Gate Array Market Revenues & Volume By Telecommunications for the Period 2021- 2031
- Historical Data and Forecast of Denmark Flash Field Programmable Gate Array Market Revenues & Volume By Consumer Electronics for the Period 2021- 2031
- Historical Data and Forecast of Denmark Flash Field Programmable Gate Array Market Revenues & Volume By Test for the Period 2021- 2031
- Historical Data and Forecast of Denmark Flash Field Programmable Gate Array Market Revenues & Volume By Military and Aerospace for the Period 2021- 2031
- Historical Data and Forecast of Denmark Flash Field Programmable Gate Array Market Revenues & Volume By Industrial for the Period 2021- 2031
- Historical Data and Forecast of Denmark Flash Field Programmable Gate Array Market Revenues & Volume By Automotive for the Period 2021- 2031
- Historical Data and Forecast of Denmark Flash Field Programmable Gate Array Market Revenues & Volume By Healthcare for the Period 2021- 2031
- Historical Data and Forecast of Denmark Flash Field Programmable Gate Array Market Revenues & Volume By Multimedia for the Period 2021- 2031
- Denmark Flash Field Programmable Gate Array Import Export Trade Statistics
- Market Opportunity Assessment By Node Size
- Market Opportunity Assessment By Configuration
- Market Opportunity Assessment By Vertical
- Denmark Flash Field Programmable Gate Array Top Companies Market Share
- Denmark Flash Field Programmable Gate Array Competitive Benchmarking By Technical and Operational Parameters
- Denmark Flash Field Programmable Gate Array Company Profiles
- Denmark Flash Field Programmable Gate Array Key Strategic Recommendations
Frequently Asked Questions About the Market Study (FAQs):
6Wresearch actively monitors the Denmark Flash Field Programmable Gate Array Market and publishes its comprehensive annual report, highlighting emerging trends, growth drivers, revenue analysis, and forecast outlook. Our insights help businesses to make data-backed strategic decisions with ongoing market dynamics. Our analysts track relevent industries related to the Denmark Flash Field Programmable Gate Array Market, allowing our clients with actionable intelligence and reliable forecasts tailored to emerging regional needs.
Yes, we provide customisation as per your requirements. To learn more, feel free to contact us on sales@6wresearch.com
1 Executive Summary |
2 Introduction |
2.1 Key Highlights of the Report |
2.2 Report Description |
2.3 Market Scope & Segmentation |
2.4 Research Methodology |
2.5 Assumptions |
3 Denmark Flash Field Programmable Gate Array Market Overview |
3.1 Denmark Country Macro Economic Indicators |
3.2 Denmark Flash Field Programmable Gate Array Market Revenues & Volume, 2021 & 2031F |
3.3 Denmark Flash Field Programmable Gate Array Market - Industry Life Cycle |
3.4 Denmark Flash Field Programmable Gate Array Market - Porter's Five Forces |
3.5 Denmark Flash Field Programmable Gate Array Market Revenues & Volume Share, By Node Size, 2021 & 2031F |
3.6 Denmark Flash Field Programmable Gate Array Market Revenues & Volume Share, By Configuration, 2021 & 2031F |
3.7 Denmark Flash Field Programmable Gate Array Market Revenues & Volume Share, By Vertical, 2021 & 2031F |
4 Denmark Flash Field Programmable Gate Array Market Dynamics |
4.1 Impact Analysis |
4.2 Market Drivers |
4.2.1 Increasing demand for high-performance computing solutions in industries such as automotive, telecommunications, and healthcare. |
4.2.2 Growing adoption of IoT devices and applications driving the need for FPGAs for customization and flexibility. |
4.2.3 Government initiatives and investments in research and development of advanced technologies such as 5G, AI, and machine learning. |
4.3 Market Restraints |
4.3.1 High initial investment costs associated with FPGA technology may limit adoption among small and medium-sized enterprises. |
4.3.2 Complexity in programming and designing FPGAs leading to a shortage of skilled professionals in the market. |
4.3.3 Competition from alternative technologies such as Application-Specific Integrated Circuits (ASICs) and System on Chip (SoC) solutions. |
5 Denmark Flash Field Programmable Gate Array Market Trends |
6 Denmark Flash Field Programmable Gate Array Market, By Types |
6.1 Denmark Flash Field Programmable Gate Array Market, By Node Size |
6.1.1 Overview and Analysis |
6.1.2 Denmark Flash Field Programmable Gate Array Market Revenues & Volume, By Node Size, 2021- 2031F |
6.1.3 Denmark Flash Field Programmable Gate Array Market Revenues & Volume, By Less Than 28 NM, 2021- 2031F |
6.1.4 Denmark Flash Field Programmable Gate Array Market Revenues & Volume, By 2890 NM, 2021- 2031F |
6.1.5 Denmark Flash Field Programmable Gate Array Market Revenues & Volume, By More Than 90 NM, 2021- 2031F |
6.2 Denmark Flash Field Programmable Gate Array Market, By Configuration |
6.2.1 Overview and Analysis |
6.2.2 Denmark Flash Field Programmable Gate Array Market Revenues & Volume, By Low-End FPGA, 2021- 2031F |
6.2.3 Denmark Flash Field Programmable Gate Array Market Revenues & Volume, By Mid-Range FPGA, 2021- 2031F |
6.2.4 Denmark Flash Field Programmable Gate Array Market Revenues & Volume, By High-End FPGA, 2021- 2031F |
6.3 Denmark Flash Field Programmable Gate Array Market, By Vertical |
6.3.1 Overview and Analysis |
6.3.2 Denmark Flash Field Programmable Gate Array Market Revenues & Volume, By Telecommunications, 2021- 2031F |
6.3.3 Denmark Flash Field Programmable Gate Array Market Revenues & Volume, By Consumer Electronics, 2021- 2031F |
6.3.4 Denmark Flash Field Programmable Gate Array Market Revenues & Volume, By Test, 2021- 2031F |
6.3.5 Denmark Flash Field Programmable Gate Array Market Revenues & Volume, By Military and Aerospace, 2021- 2031F |
6.3.6 Denmark Flash Field Programmable Gate Array Market Revenues & Volume, By Industrial, 2021- 2031F |
6.3.7 Denmark Flash Field Programmable Gate Array Market Revenues & Volume, By Automotive, 2021- 2031F |
6.3.8 Denmark Flash Field Programmable Gate Array Market Revenues & Volume, By Multimedia, 2021- 2031F |
6.3.9 Denmark Flash Field Programmable Gate Array Market Revenues & Volume, By Multimedia, 2021- 2031F |
7 Denmark Flash Field Programmable Gate Array Market Import-Export Trade Statistics |
7.1 Denmark Flash Field Programmable Gate Array Market Export to Major Countries |
7.2 Denmark Flash Field Programmable Gate Array Market Imports from Major Countries |
8 Denmark Flash Field Programmable Gate Array Market Key Performance Indicators |
8.1 FPGA design efficiency rate (measuring the time taken to design and implement FPGA solutions). |
8.2 FPGA programming learning curve (tracking the time taken for new engineers to become proficient in FPGA programming). |
8.3 FPGA utilization rate in key industries (monitoring the percentage of FPGAs deployed in target industries like automotive, telecommunications, and healthcare). |
9 Denmark Flash Field Programmable Gate Array Market - Opportunity Assessment |
9.1 Denmark Flash Field Programmable Gate Array Market Opportunity Assessment, By Node Size, 2021 & 2031F |
9.2 Denmark Flash Field Programmable Gate Array Market Opportunity Assessment, By Configuration, 2021 & 2031F |
9.3 Denmark Flash Field Programmable Gate Array Market Opportunity Assessment, By Vertical, 2021 & 2031F |
10 Denmark Flash Field Programmable Gate Array Market - Competitive Landscape |
10.1 Denmark Flash Field Programmable Gate Array Market Revenue Share, By Companies, 2024 |
10.2 Denmark Flash Field Programmable Gate Array Market Competitive Benchmarking, By Operating and Technical Parameters |
11 Company Profiles |
12 Recommendations |
13 Disclaimer |
Export potential assessment - trade Analytics for 2030
Export potential enables firms to identify high-growth global markets with greater confidence by combining advanced trade intelligence with a structured quantitative methodology. The framework analyzes emerging demand trends and country-level import patterns while integrating macroeconomic and trade datasets such as GDP and population forecasts, bilateral import–export flows, tariff structures, elasticity differentials between developed and developing economies, geographic distance, and import demand projections. Using weighted trade values from 2020–2024 as the base period to project country-to-country export potential for 2030, these inputs are operationalized through calculated drivers such as gravity model parameters, tariff impact factors, and projected GDP per-capita growth. Through an analysis of hidden potentials, demand hotspots, and market conditions that are most favorable to success, this method enables firms to focus on target countries, maximize returns, and global expansion with data, backed by accuracy.
By factoring in the projected importer demand gap that is currently unmet and could be potential opportunity, it identifies the potential for the Exporter (Country) among 190 countries, against the general trade analysis, which identifies the biggest importer or exporter.
To discover high-growth global markets and optimize your business strategy:
Click Here
Pricing
- Single User License$ 1,995
- Department License$ 2,400
- Site License$ 3,120
- Global License$ 3,795

Search
Thought Leadership and Analyst Meet


Our Clients
Latest Reports
- United Kingdom (UK) Long-term Care Insurance Market (2026-2032) | Growth, Share, Consumer Insights, Drivers, Opportunities, Competition, Pricing Analysis, Segments, Restraints, Companies, Competitive, Value, Outlook, Size, Demand, Analysis, Challenges, Strategic Insights, Investment Trends, Revenue, Trends, Supply, Forecast
- United Kingdom (UK) Long Term Care Market (2026-2032) | Companies, Outlook, Analysis, Trends, Value, Revenue, Segmentation, Share, Forecast, Competitive Landscape, Growth, Size & Forecast
- Iraq Insulation and Waterproofing Market (2026-2032) | Outlook, Drivers, Growth, Size, Share, Industry, Revenue, Trends, Demand, Competitive, Strategic Insights, Opportunities, Segments, Companies, Challenges, Strategy, Consumer Insights, Analysis, Investment Trends, Value, Segmentation, Forecast, Restraints
- India Switchgear Market Outlook (2026 - 2032) | Size, Share, Trends, Growth, Revenue, Forecast, Analysis, Value, Outlook
- Pakistan Contraceptive Implants Market (2025-2031) | Demand, Growth, Size, Share, Industry, Pricing Analysis, Competitive, Strategic Insights, Strategy, Consumer Insights, Analysis, Investment Trends, Opportunities, Revenue, Segments, Value, Segmentation, Supply, Forecast, Restraints, Outlook, Competition, Drivers, Trends, Companies, Challenges
- Sri Lanka Packaging Market (2026-2032) | Outlook, Competition, Drivers, Trends, Demand, Pricing Analysis, Competitive, Strategic Insights, Companies, Challenges, Strategy, Consumer Insights, Analysis, Investment Trends, Opportunities, Growth, Size, Share, Industry, Revenue, Segments, Value, Segmentation, Supply, Forecast, Restraints
- India Kids Watches Market (2026-2032) | Strategy, Consumer Insights, Analysis, Investment Trends, Opportunities, Growth, Size, Share, Industry, Revenue, Segments, Value, Segmentation, Supply, Forecast, Restraints, Outlook, Competition, Drivers, Trends, Demand, Pricing Analysis, Competitive, Strategic Insights, Companies, Challenges
- Saudi Arabia Core Assurance Service Market (2025-2031) | Strategy, Consumer Insights, Analysis, Investment Trends, Opportunities, Growth, Size, Share, Industry, Revenue, Segments, Value, Segmentation, Supply, Forecast, Restraints, Outlook, Competition, Drivers, Trends, Demand, Pricing Analysis, Competitive, Strategic Insights, Companies, Challenges
- Romania Uninterruptible Power Supply (UPS) Market (2026-2032) | Industry, Analysis, Revenue, Size, Forecast, Outlook, Value, Trends, Share, Growth & Companies
- Saudi Arabia Car Window Tinting Film, Paint Protection Film (PPF), and Ceramic Coating Market (2025-2031) | Strategy, Consumer Insights, Analysis, Investment Trends, Opportunities, Growth, Size, Share, Industry, Revenue, Segments, Value, Segmentation, Supply, Forecast, Restraints, Outlook, Competition, Drivers, Trends, Demand, Pricing Analysis, Competitive, Strategic Insights, Companies, Challenges
Industry Events and Analyst Meet

India EV Show 2026

EV tech India Expo 2026

Auto Tech Asia 2026

Battery Tech India 2026

Smart Production Solutions Guangzhou 2026
Whitepaper
- Middle East & Africa Commercial Security Market Click here to view more.
- Middle East & Africa Fire Safety Systems & Equipment Market Click here to view more.
- GCC Drone Market Click here to view more.
- Middle East Lighting Fixture Market Click here to view more.
- GCC Physical & Perimeter Security Market Click here to view more.
6WResearch In News
- Doha a strategic location for EV manufacturing hub: IPA Qatar
- Demand for luxury TVs surging in the GCC, says Samsung
- Empowering Growth: The Thriving Journey of Bangladesh’s Cable Industry
- Demand for luxury TVs surging in the GCC, says Samsung
- Video call with a traditional healer? Once unthinkable, it’s now common in South Africa
- Intelligent Buildings To Smooth GCC’s Path To Net Zero