Denmark Hydroquinone Market (2025-2031) | Growth, Segmentation, Forecast, Trends, Value, Analysis, Revenue, Outlook, Share, Industry, Size & Companies
Market Forecast By Application (Intermediate, Antioxidant, Polymerization Inhibitor, Photosensitive Chemical, Others), By End-Use (Cosmetics, Polymers, Paints & Adhesives, Rubber, Others) And Competitive Landscape
| Product Code: ETC5354206 | Publication Date: Nov 2023 | Updated Date: Apr 2026 | Product Type: Market Research Report | |
| Publisher: 6Wresearch | Author: Ravi Bhandari | No. of Pages: 60 | No. of Figures: 30 | No. of Tables: 5 |
Denmark Hydroquinone Market Size (2020-2030)
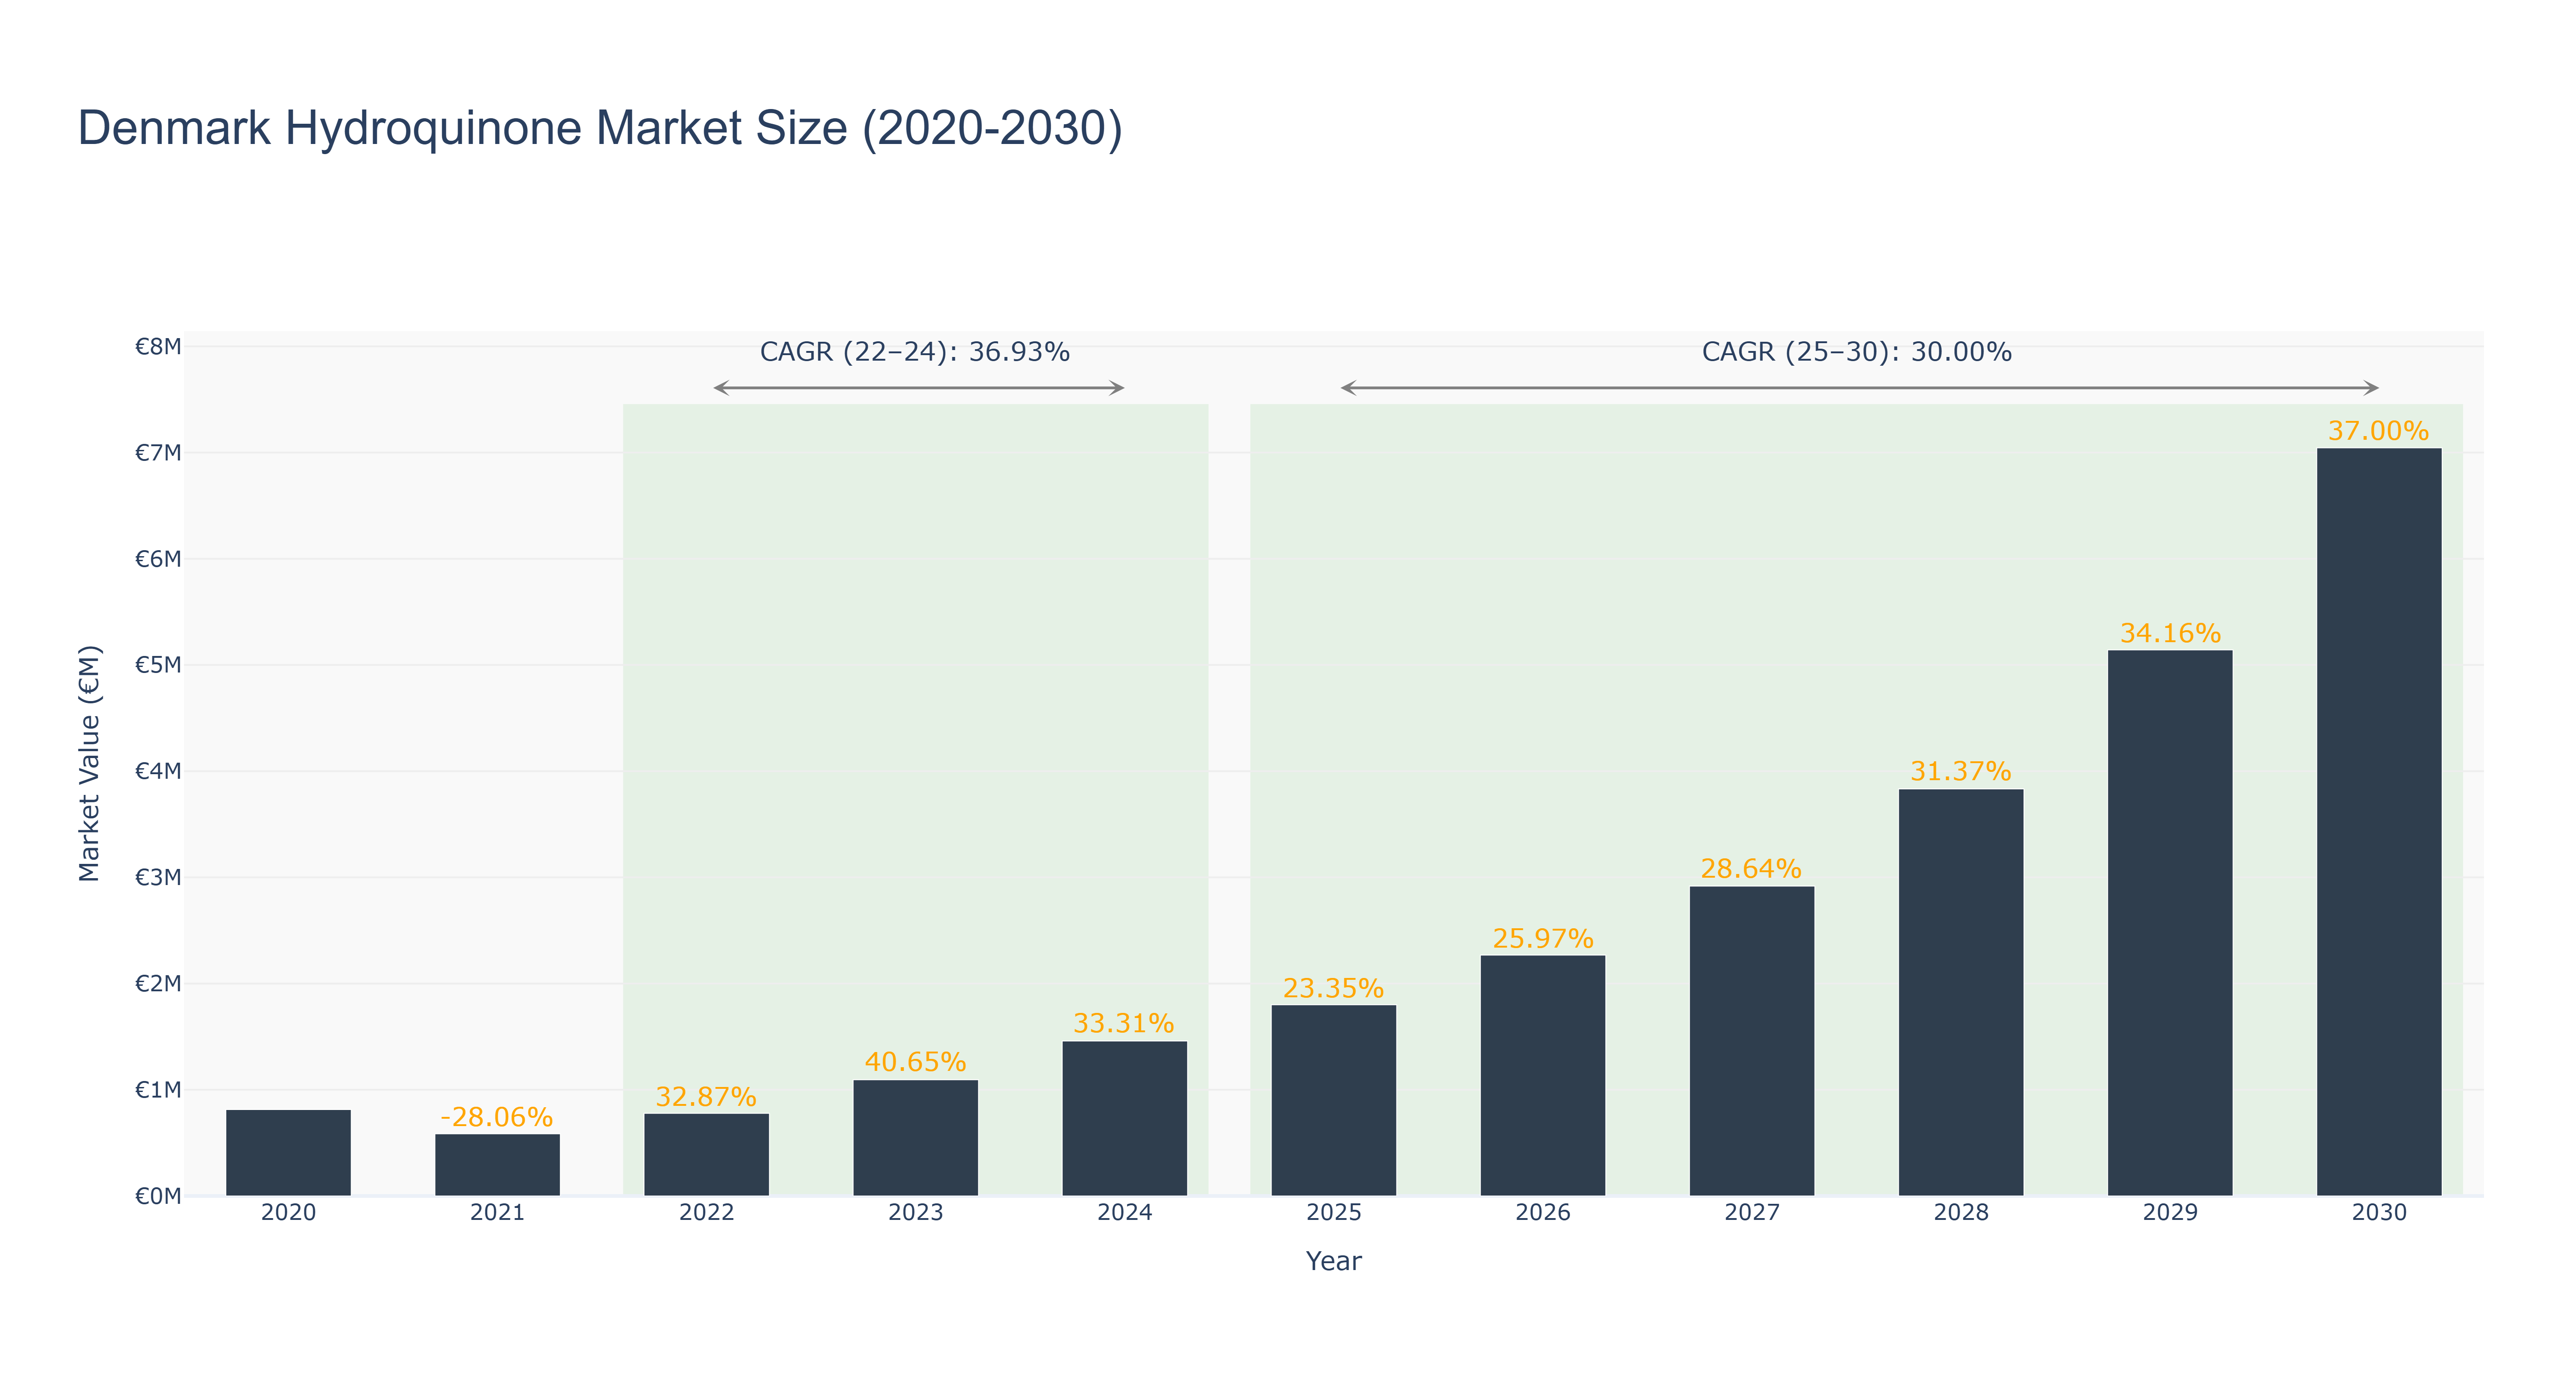
The Denmark Hydroquinone Market has shown a steady growth trajectory over the years. The peak market size of €7.05 million is forecasted for 2030, with an impressive CAGR of 30.0% from 2025 to 2030. The market experienced significant growth from 2020 to 2024, with the market size increasing from €0.81 million to €1.46 million in 2024. The recent years have witnessed a surge in market size due to increasing demand for hydroquinone in various industries, driving the overall growth. Looking ahead, Denmark is set to embark on new projects in the cosmetic industry, leveraging the market's potential for hydroquinone products. This market trend is indicative of a promising future for the Denmark Hydroquinone Market, supported by ongoing industry drivers and upcoming developments.
Denmark Hydroquinone Market: Production & Trade Performance (2019-2025)
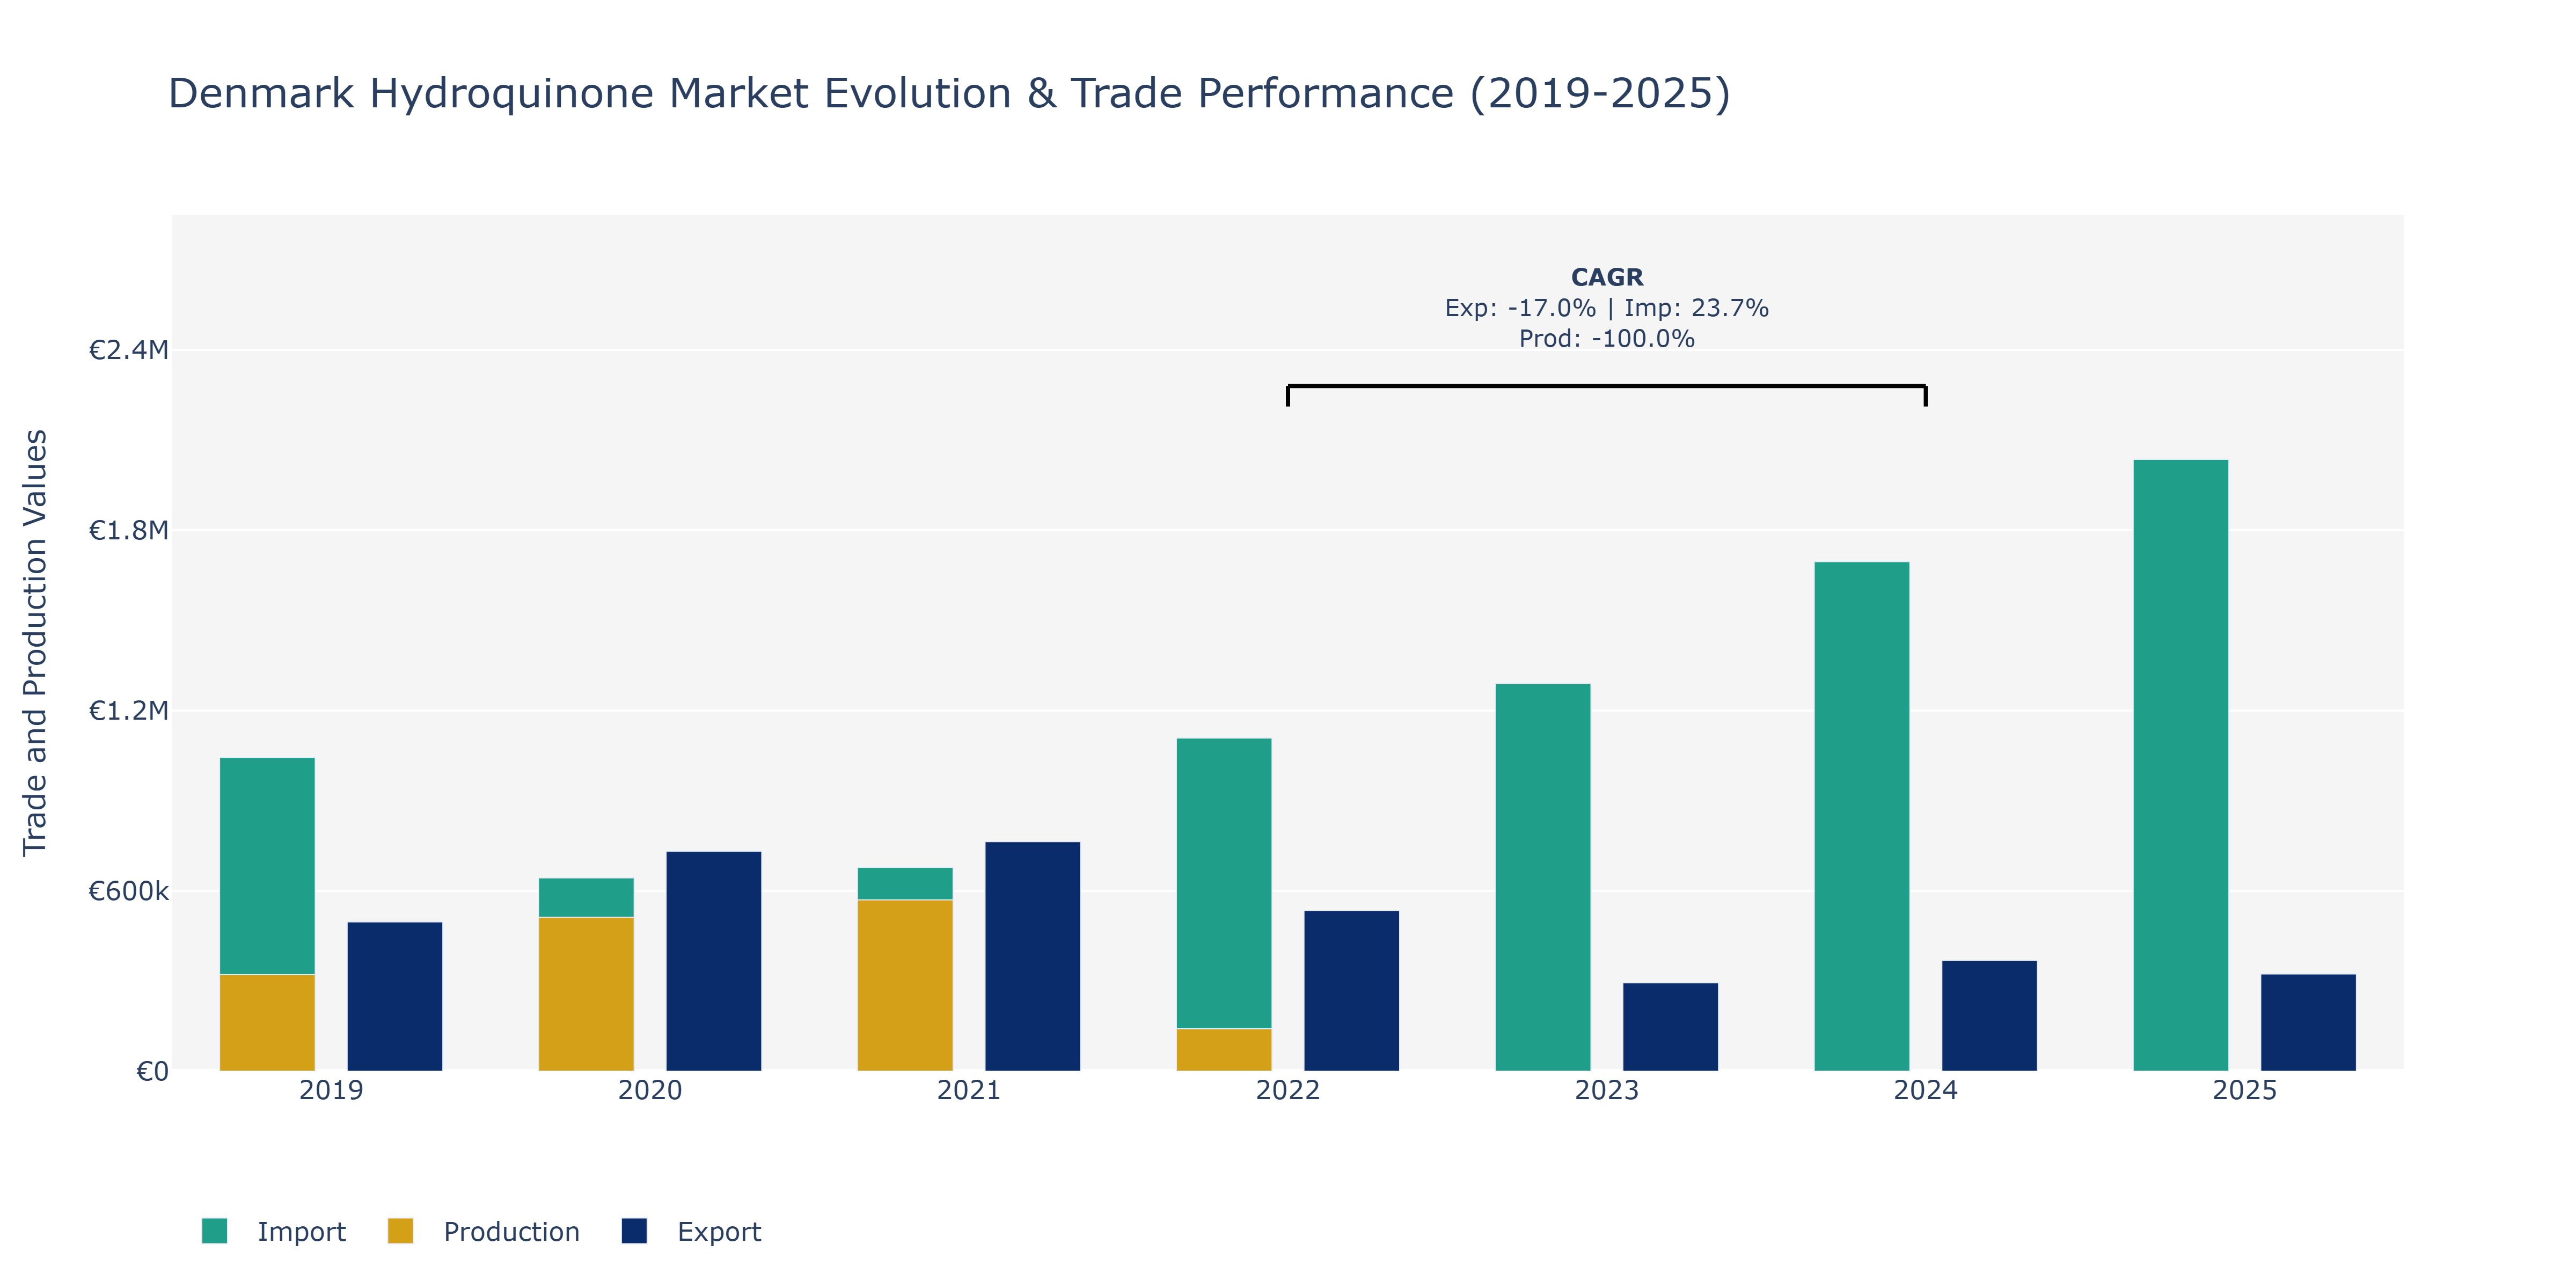
Between 2019 and 2025, the Denmark Hydroquinone Market witnessed notable shifts in exports, imports, and production levels. Exports surged from €496.77 thousand in 2019 to €763.56 thousand in 2021, marking a peak, before declining to €323.51 thousand in 2025. Imports displayed fluctuations, with a peak of €2.04 million in 2025 after a steady rise from 2019. Production, however, plummeted drastically from €321.32 thousand in 2019 to €141.27 thousand in 2022 and did not recover thereafter. The market's export decline can be attributed to changing global demand patterns and competitive pressures, impacting local production levels. The surge in imports could be linked to increased demand for hydroquinone-based products in Denmark, possibly due to advancements in skincare technologies driving the need for quality ingredients. The sharp decline in production might be a result of shifting manufacturing trends, possibly indicating a shift towards imported finished goods rather than locally produced hydroquinone formulations.
Key Highlights of the Report:
- Denmark Hydroquinone Market Outlook
- Market Size of Denmark Hydroquinone Market, 2024
- Forecast of Denmark Hydroquinone Market, 2031
- Historical Data and Forecast of Denmark Hydroquinone Revenues & Volume for the Period 2021-2031
- Denmark Hydroquinone Market Trend Evolution
- Denmark Hydroquinone Market Drivers and Challenges
- Denmark Hydroquinone Price Trends
- Denmark Hydroquinone Porter`s Five Forces
- Denmark Hydroquinone Industry Life Cycle
- Historical Data and Forecast of Denmark Hydroquinone Market Revenues & Volume By Application for the Period 2021-2031
- Historical Data and Forecast of Denmark Hydroquinone Market Revenues & Volume By Intermediate for the Period 2021-2031
- Historical Data and Forecast of Denmark Hydroquinone Market Revenues & Volume By Antioxidant for the Period 2021-2031
- Historical Data and Forecast of Denmark Hydroquinone Market Revenues & Volume By Polymerization Inhibitor for the Period 2021-2031
- Historical Data and Forecast of Denmark Hydroquinone Market Revenues & Volume By Photosensitive Chemical for the Period 2021-2031
- Historical Data and Forecast of Denmark Hydroquinone Market Revenues & Volume By Others for the Period 2021-2031
- Historical Data and Forecast of Denmark Hydroquinone Market Revenues & Volume By End-Use for the Period 2021-2031
- Historical Data and Forecast of Denmark Hydroquinone Market Revenues & Volume By Cosmetics for the Period 2021-2031
- Historical Data and Forecast of Denmark Hydroquinone Market Revenues & Volume By Polymers for the Period 2021-2031
- Historical Data and Forecast of Denmark Hydroquinone Market Revenues & Volume By Paints & Adhesives for the Period 2021-2031
- Historical Data and Forecast of Denmark Hydroquinone Market Revenues & Volume By Rubber for the Period 2021-2031
- Historical Data and Forecast of Denmark Hydroquinone Market Revenues & Volume By Others for the Period 2021-2031
- Denmark Hydroquinone Import Export Trade Statistics
- Market Opportunity Assessment By Application
- Market Opportunity Assessment By End-Use
- Denmark Hydroquinone Top Companies Market Share
- Denmark Hydroquinone Competitive Benchmarking By Technical and Operational Parameters
- Denmark Hydroquinone Company Profiles
- Denmark Hydroquinone Key Strategic Recommendations
Frequently Asked Questions About the Market Study (FAQs):
6Wresearch actively monitors the Denmark Hydroquinone Market and publishes its comprehensive annual report, highlighting emerging trends, growth drivers, revenue analysis, and forecast outlook. Our insights help businesses to make data-backed strategic decisions with ongoing market dynamics. Our analysts track relevent industries related to the Denmark Hydroquinone Market, allowing our clients with actionable intelligence and reliable forecasts tailored to emerging regional needs.
Yes, we provide customisation as per your requirements. To learn more, feel free to contact us on sales@6wresearch.com
1 Executive Summary |
2 Introduction |
2.1 Key Highlights of the Report |
2.2 Report Description |
2.3 Market Scope & Segmentation |
2.4 Research Methodology |
2.5 Assumptions |
3 Denmark Hydroquinone Market Overview |
3.1 Denmark Country Macro Economic Indicators |
3.2 Denmark Hydroquinone Market Revenues & Volume, 2021 & 2031F |
3.3 Denmark Hydroquinone Market - Industry Life Cycle |
3.4 Denmark Hydroquinone Market - Porter's Five Forces |
3.5 Denmark Hydroquinone Market Revenues & Volume Share, By Application? , 2021 & 2031F |
3.6 Denmark Hydroquinone Market Revenues & Volume Share, By End-Use? , 2021 & 2031F |
4 Denmark Hydroquinone Market Dynamics |
4.1 Impact Analysis |
4.2 Market Drivers |
4.2.1 Increasing demand for skin lightening products in Denmark |
4.2.2 Growing awareness about the benefits of hydroquinone in treating hyperpigmentation |
4.2.3 Rising disposable income leading to higher spending on skincare products |
4.3 Market Restraints |
4.3.1 Stringent regulations on the use of hydroquinone in cosmetic products in Denmark |
4.3.2 Increasing preference for natural and organic skincare products over chemical-based products |
5 Denmark Hydroquinone Market Trends |
6 Denmark Hydroquinone Market Segmentations |
6.1 Denmark Hydroquinone Market, By Application? |
6.1.1 Overview and Analysis |
6.1.2 Denmark Hydroquinone Market Revenues & Volume, By Intermediate, 2021-2031F |
6.1.3 Denmark Hydroquinone Market Revenues & Volume, By Antioxidant, 2021-2031F |
6.1.4 Denmark Hydroquinone Market Revenues & Volume, By Polymerization Inhibitor, 2021-2031F |
6.1.5 Denmark Hydroquinone Market Revenues & Volume, By Photosensitive Chemical, 2021-2031F |
6.1.6 Denmark Hydroquinone Market Revenues & Volume, By Others? , 2021-2031F |
6.2 Denmark Hydroquinone Market, By End-Use? |
6.2.1 Overview and Analysis |
6.2.2 Denmark Hydroquinone Market Revenues & Volume, By Cosmetics, 2021-2031F |
6.2.3 Denmark Hydroquinone Market Revenues & Volume, By Polymers, 2021-2031F |
6.2.4 Denmark Hydroquinone Market Revenues & Volume, By Paints & Adhesives, 2021-2031F |
6.2.5 Denmark Hydroquinone Market Revenues & Volume, By Rubber, 2021-2031F |
6.2.6 Denmark Hydroquinone Market Revenues & Volume, By Others, 2021-2031F |
7 Denmark Hydroquinone Market Import-Export Trade Statistics |
7.1 Denmark Hydroquinone Market Export to Major Countries |
7.2 Denmark Hydroquinone Market Imports from Major Countries |
8 Denmark Hydroquinone Market Key Performance Indicators |
8.1 Number of dermatologist prescriptions for hydroquinone-based products |
8.2 Consumer surveys indicating satisfaction with hydroquinone products |
8.3 Number of new product launches containing hydroquinone |
8.4 Research and development investments in hydroquinone alternatives |
9 Denmark Hydroquinone Market - Opportunity Assessment |
9.1 Denmark Hydroquinone Market Opportunity Assessment, By Application? , 2021 & 2031F |
9.2 Denmark Hydroquinone Market Opportunity Assessment, By End-Use? , 2021 & 2031F |
10 Denmark Hydroquinone Market - Competitive Landscape |
10.1 Denmark Hydroquinone Market Revenue Share, By Companies, 2024 |
10.2 Denmark Hydroquinone Market Competitive Benchmarking, By Operating and Technical Parameters |
11 Company Profiles |
12 Recommendations | 13 Disclaimer |
Global Go To Market Strategy - 2030
Export potential enables firms to identify high-growth global markets with greater confidence by combining advanced trade intelligence with a structured quantitative methodology. The framework analyzes emerging demand trends and country-level import patterns while integrating macroeconomic and trade datasets such as GDP and population forecasts, bilateral import–export flows, tariff structures, elasticity differentials between developed and developing economies, geographic distance, and import demand projections. Using weighted trade values from 2020–2024 as the base period to project country-to-country export potential for 2030, these inputs are operationalized through calculated drivers such as gravity model parameters, tariff impact factors, and projected GDP per-capita growth. Through an analysis of hidden potentials, demand hotspots, and market conditions that are most favorable to success, this method enables firms to focus on target countries, maximize returns, and global expansion with data, backed by accuracy.
By factoring in the projected importer demand gap that is currently unmet and could be potential opportunity, it identifies the potential for the Exporter (Country) among 190 countries, against the general trade analysis, which identifies the biggest importer or exporter.
To discover high-growth global markets and optimize your business strategy:
Click Here
Pricing
- Single User License$ 1,995
- Department License$ 2,400
- Site License$ 3,120
- Global License$ 3,795

Leadership Perspectives from Industry Events
Search
Thought Leadership and Analyst Meet


Our Clients
6WResearch In News
- Doha a strategic location for EV manufacturing hub: IPA Qatar
- Demand for luxury TVs surging in the GCC, says Samsung
- Empowering Growth: The Thriving Journey of Bangladesh’s Cable Industry
- Demand for luxury TVs surging in the GCC, says Samsung
- Video call with a traditional healer? Once unthinkable, it’s now common in South Africa
- Intelligent Buildings To Smooth GCC’s Path To Net Zero
Latest Reports
- New Zealand Aseptic Manufacturing Market (2026-2032)
- Netherlands Aseptic Manufacturing Market (2026-2032)
- Nauru Aseptic Manufacturing Market (2026-2032)
- Namibia Aseptic Manufacturing Market (2026-2032)
- Mozambique Aseptic Manufacturing Market (2026-2032)
- Montenegro Aseptic Manufacturing Market (2026-2032)
- Mongolia Aseptic Manufacturing Market (2026-2032)
- Monaco Aseptic Manufacturing Market (2026-2032)
- Micronesia Aseptic Manufacturing Market (2026-2032)
- Mauritius Aseptic Manufacturing Market (2026-2032)
Industry Events and Analyst Meet

HIMTEX 2026

India Refining Summit 2026

India EV Show 2026

EV tech India Expo 2026

Auto Tech Asia 2026
Whitepaper
- Middle East & Africa Commercial Security Market Click here to view more.
- Middle East & Africa Fire Safety Systems & Equipment Market Click here to view more.
- GCC Drone Market Click here to view more.
- Middle East Lighting Fixture Market Click here to view more.
- GCC Physical & Perimeter Security Market Click here to view more.