Denmark Low VOC Adhesive Market (2026-2032) | Industry, Size, Strategy, Challenges, Trends, Segments, Demand, Share, Forecast, Value, Competitive, Analysis, Competition, Growth, Supply, Outlook, Consumer Insights, Opportunities, Revenue, Investment Trends, Companies, Segmentation, Strategic Insights, Restraints, Drivers, Pricing Analysis
Market Forecast By Substrate Type (Metals, Plastics, Glass, Wood, Paper), By Application (Automotive, Construction, Electronics, Packaging, Furniture), By Technology (Water-based, Solvent-based, Hot-melt, Reactive, Pressure-sensitive), By Properties (Low Odor, High Adhesion, Flexibility, Heat Resistance, Water Resistance) And Competitive Landscape
| Product Code: ETC12580760 | Publication Date: Apr 2025 | Updated Date: Apr 2026 | Product Type: Market Research Report | |
| Publisher: 6Wresearch | Author: Sachin Kumar Rai | No. of Pages: 65 | No. of Figures: 34 | No. of Tables: 19 |
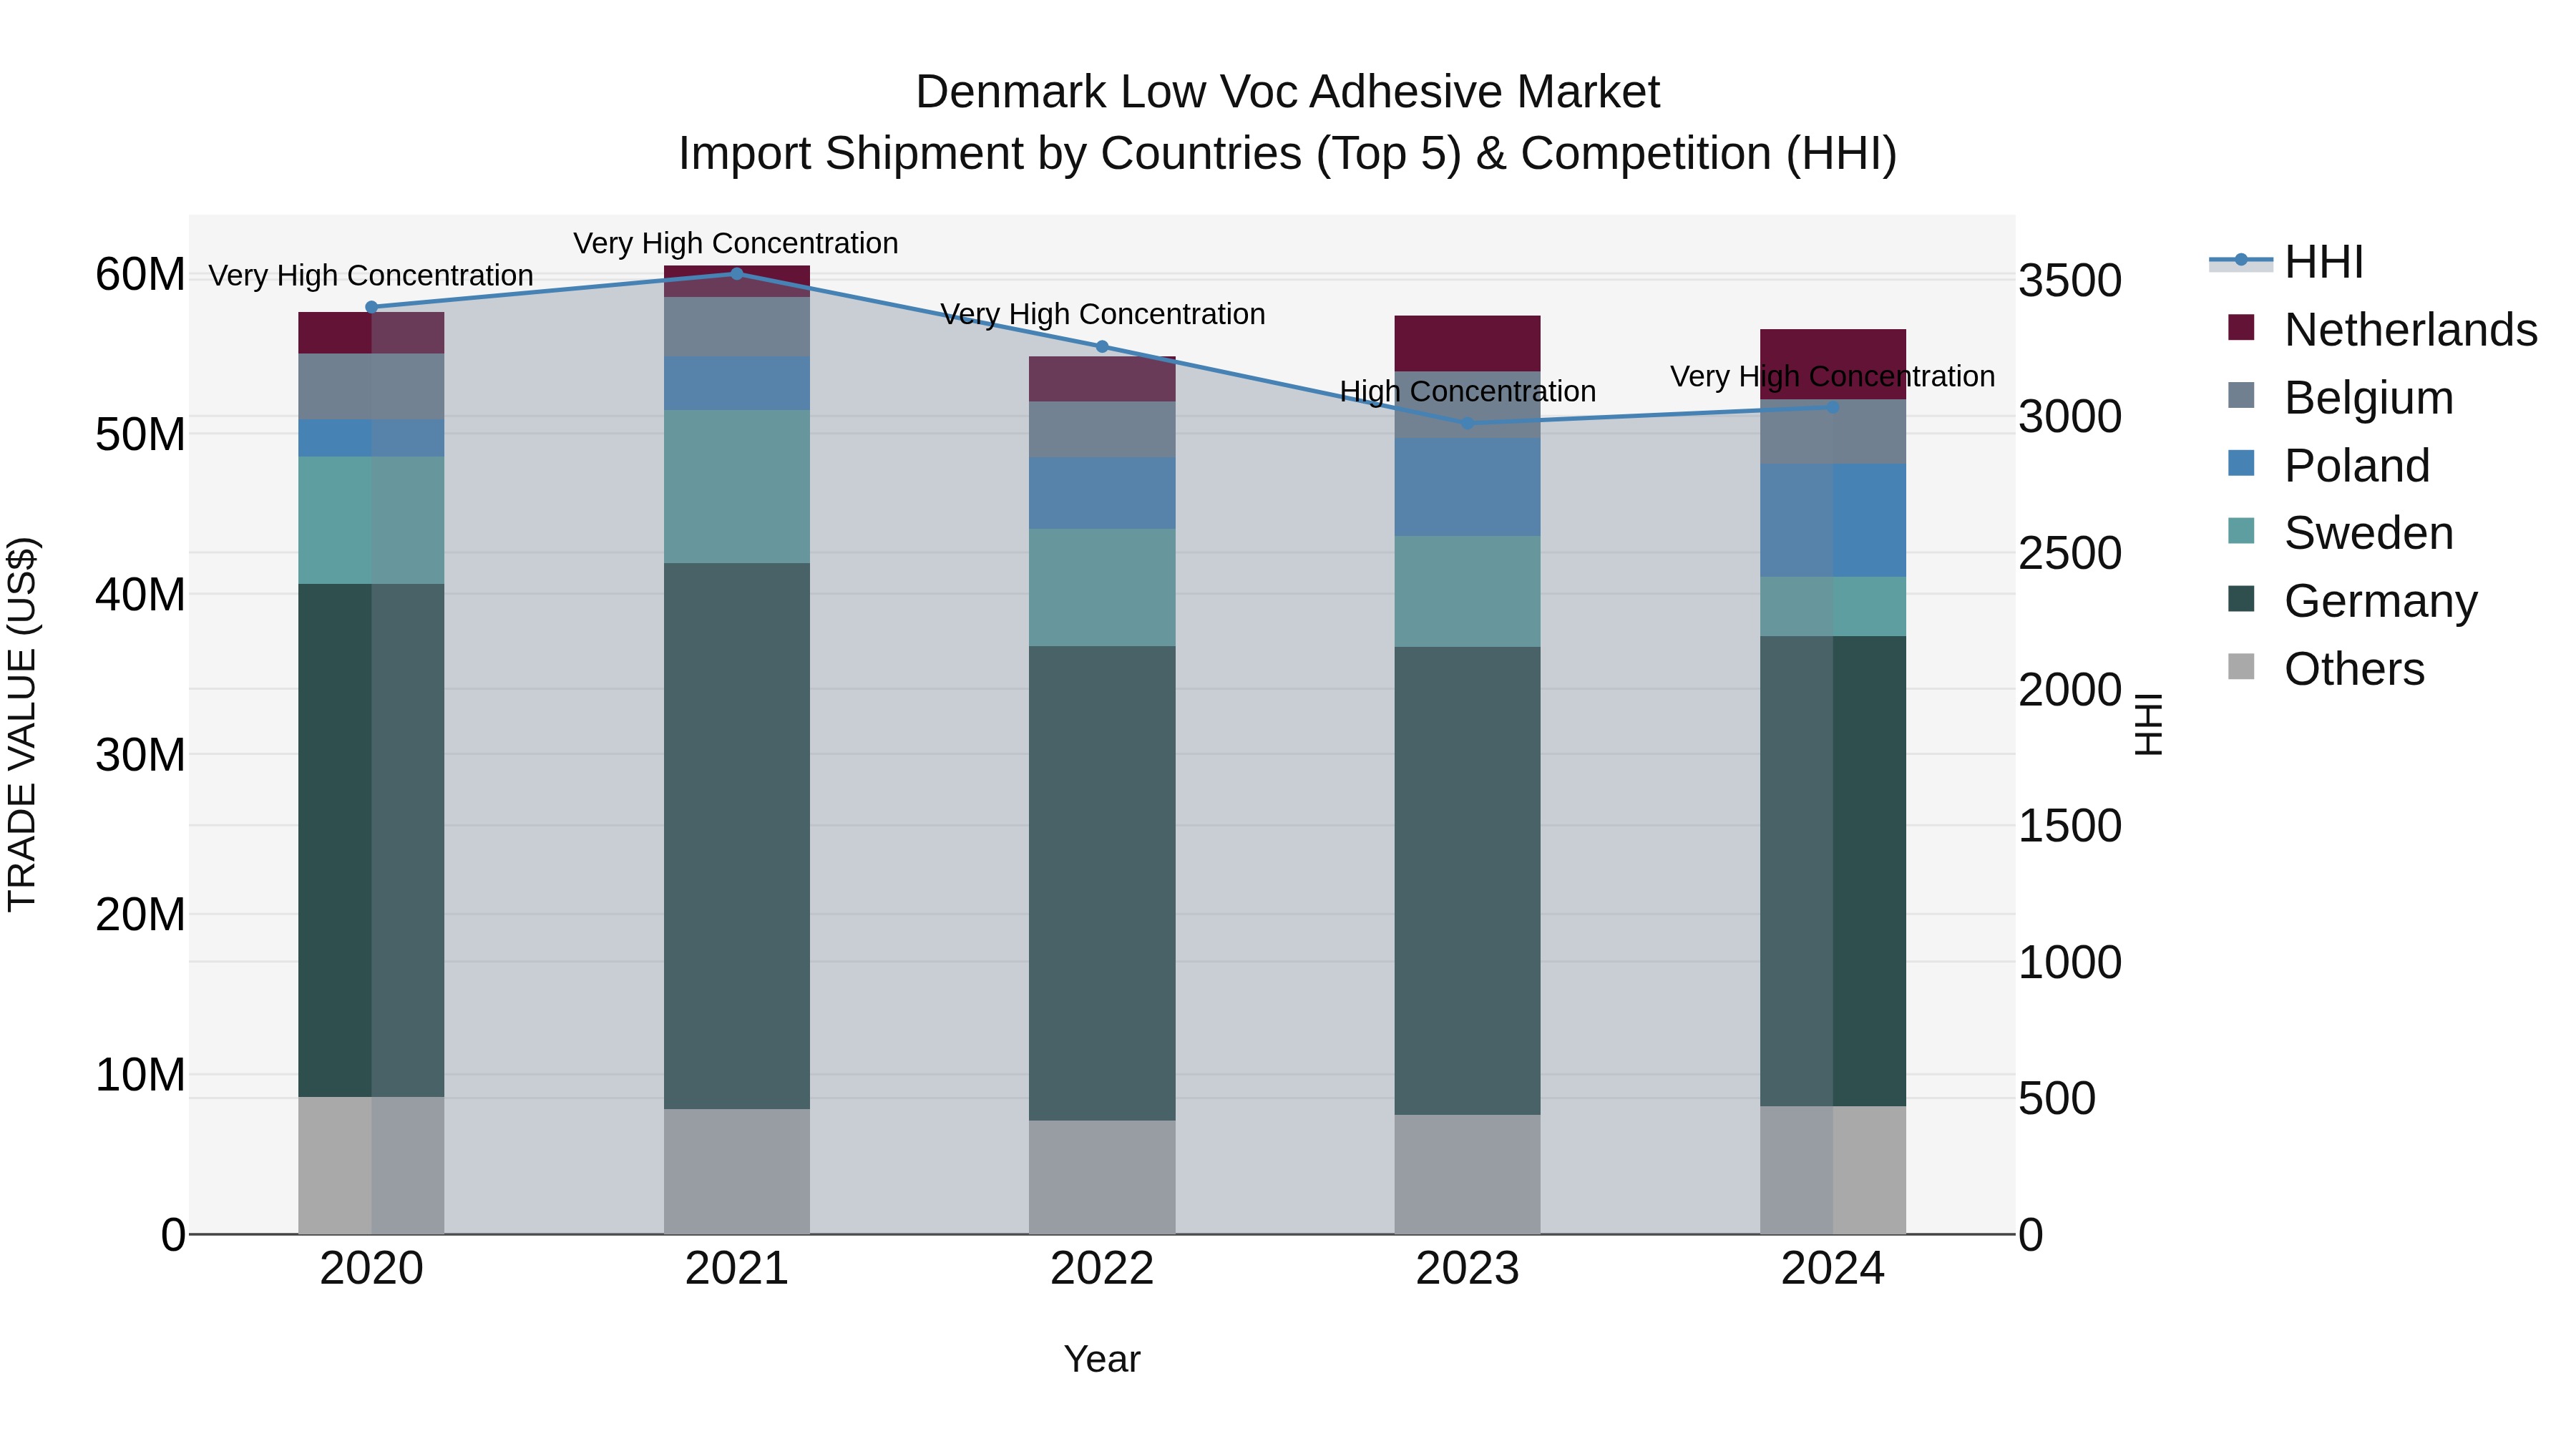
Denmark Low Voc Adhesive Market Top 5 Importing Countries and Market Competition (HHI) Analysis
Denmark import shipments of low VOC adhesive in 2024 continued to be dominated by top exporting countries such as Germany, Poland, Netherlands, Belgium, and Sweden. The High Herfindahl-Hirschman Index (HHI) in 2023 signified a concentrated market, which escalated to very high concentration in 2024. The Compound Annual Growth Rate (CAGR) from 2020 to 2024 was -0.46, indicating a slight decline in the market. Moreover, the growth rate from 2023 to 2024 showed a further decrease at -1.42, reflecting a challenging environment for the low VOC adhesive import sector in Denmark.
Key Highlights of the Report:
- Denmark Low VOC Adhesive Market Outlook
- Market Size of Denmark Low VOC Adhesive Market, 2025
- Forecast of Denmark Low VOC Adhesive Market, 2032
- Historical Data and Forecast of Denmark Low VOC Adhesive Revenues & Volume for the Period 2022 - 2032F
- Denmark Low VOC Adhesive Market Trend Evolution
- Denmark Low VOC Adhesive Market Drivers and Challenges
- Denmark Low VOC Adhesive Price Trends
- Denmark Low VOC Adhesive Porter's Five Forces
- Denmark Low VOC Adhesive Industry Life Cycle
- Historical Data and Forecast of Denmark Low VOC Adhesive Market Revenues & Volume By Substrate Type for the Period 2022 - 2032F
- Historical Data and Forecast of Denmark Low VOC Adhesive Market Revenues & Volume By Metals for the Period 2022 - 2032F
- Historical Data and Forecast of Denmark Low VOC Adhesive Market Revenues & Volume By Plastics for the Period 2022 - 2032F
- Historical Data and Forecast of Denmark Low VOC Adhesive Market Revenues & Volume By Glass for the Period 2022 - 2032F
- Historical Data and Forecast of Denmark Low VOC Adhesive Market Revenues & Volume By Wood for the Period 2022 - 2032F
- Historical Data and Forecast of Denmark Low VOC Adhesive Market Revenues & Volume By Paper for the Period 2022 - 2032F
- Historical Data and Forecast of Denmark Low VOC Adhesive Market Revenues & Volume By Application for the Period 2022 - 2032F
- Historical Data and Forecast of Denmark Low VOC Adhesive Market Revenues & Volume By Automotive for the Period 2022 - 2032F
- Historical Data and Forecast of Denmark Low VOC Adhesive Market Revenues & Volume By Construction for the Period 2022 - 2032F
- Historical Data and Forecast of Denmark Low VOC Adhesive Market Revenues & Volume By Electronics for the Period 2022 - 2032F
- Historical Data and Forecast of Denmark Low VOC Adhesive Market Revenues & Volume By Packaging for the Period 2022 - 2032F
- Historical Data and Forecast of Denmark Low VOC Adhesive Market Revenues & Volume By Furniture for the Period 2022 - 2032F
- Historical Data and Forecast of Denmark Low VOC Adhesive Market Revenues & Volume By Technology for the Period 2022 - 2032F
- Historical Data and Forecast of Denmark Low VOC Adhesive Market Revenues & Volume By Water-based for the Period 2022 - 2032F
- Historical Data and Forecast of Denmark Low VOC Adhesive Market Revenues & Volume By Solvent-based for the Period 2022 - 2032F
- Historical Data and Forecast of Denmark Low VOC Adhesive Market Revenues & Volume By Hot-melt for the Period 2022 - 2032F
- Historical Data and Forecast of Denmark Low VOC Adhesive Market Revenues & Volume By Reactive for the Period 2022 - 2032F
- Historical Data and Forecast of Denmark Low VOC Adhesive Market Revenues & Volume By Pressure-sensitive for the Period 2022 - 2032F
- Historical Data and Forecast of Denmark Low VOC Adhesive Market Revenues & Volume By Properties for the Period 2022 - 2032F
- Historical Data and Forecast of Denmark Low VOC Adhesive Market Revenues & Volume By Low Odor for the Period 2022 - 2032F
- Historical Data and Forecast of Denmark Low VOC Adhesive Market Revenues & Volume By High Adhesion for the Period 2022 - 2032F
- Historical Data and Forecast of Denmark Low VOC Adhesive Market Revenues & Volume By Flexibility for the Period 2022 - 2032F
- Historical Data and Forecast of Denmark Low VOC Adhesive Market Revenues & Volume By Heat Resistance for the Period 2022 - 2032F
- Historical Data and Forecast of Denmark Low VOC Adhesive Market Revenues & Volume By Water Resistance for the Period 2022 - 2032F
- Denmark Low VOC Adhesive Import Export Trade Statistics
- Market Opportunity Assessment By Substrate Type
- Market Opportunity Assessment By Application
- Market Opportunity Assessment By Technology
- Market Opportunity Assessment By Properties
- Denmark Low VOC Adhesive Top Companies Market Share
- Denmark Low VOC Adhesive Competitive Benchmarking By Technical and Operational Parameters
- Denmark Low VOC Adhesive Company Profiles
- Denmark Low VOC Adhesive Key Strategic Recommendations
Frequently Asked Questions About the Market Study (FAQs):
6Wresearch actively monitors the Denmark Low VOC Adhesive Market and publishes its comprehensive annual report, highlighting emerging trends, growth drivers, revenue analysis, and forecast outlook. Our insights help businesses to make data-backed strategic decisions with ongoing market dynamics. Our analysts track relevent industries related to the Denmark Low VOC Adhesive Market, allowing our clients with actionable intelligence and reliable forecasts tailored to emerging regional needs.
Yes, we provide customisation as per your requirements. To learn more, feel free to contact us on sales@6wresearch.com
1 Executive Summary |
2 Introduction |
2.1 Key Highlights of the Report |
2.2 Report Description |
2.3 Market Scope & Segmentation |
2.4 Research Methodology |
2.5 Assumptions |
3 Denmark Low VOC Adhesive Market Overview |
3.1 Denmark Country Macro Economic Indicators |
3.2 Denmark Low VOC Adhesive Market Revenues & Volume, 2022 & 2032F |
3.3 Denmark Low VOC Adhesive Market - Industry Life Cycle |
3.4 Denmark Low VOC Adhesive Market - Porter's Five Forces |
3.5 Denmark Low VOC Adhesive Market Revenues & Volume Share, By Substrate Type, 2022 & 2032F |
3.6 Denmark Low VOC Adhesive Market Revenues & Volume Share, By Application, 2022 & 2032F |
3.7 Denmark Low VOC Adhesive Market Revenues & Volume Share, By Technology, 2022 & 2032F |
3.8 Denmark Low VOC Adhesive Market Revenues & Volume Share, By Properties, 2022 & 2032F |
4 Denmark Low VOC Adhesive Market Dynamics |
4.1 Impact Analysis |
4.2 Market Drivers |
4.2.1 Increasing focus on sustainability and environmental regulations driving demand for low VOC adhesives. |
4.2.2 Growing awareness among consumers about the health benefits of using low VOC products. |
4.2.3 Innovation and technological advancements leading to the development of more effective low VOC adhesive solutions. |
4.3 Market Restraints |
4.3.1 Higher initial cost compared to traditional adhesives may hinder widespread adoption. |
4.3.2 Limited availability of raw materials for low VOC adhesives could impact production and supply. |
4.3.3 Resistance from some industries to switch from conventional adhesives to low VOC alternatives. |
5 Denmark Low VOC Adhesive Market Trends |
6 Denmark Low VOC Adhesive Market, By Types |
6.1 Denmark Low VOC Adhesive Market, By Substrate Type |
6.1.1 Overview and Analysis |
6.1.2 Denmark Low VOC Adhesive Market Revenues & Volume, By Substrate Type, 2022 - 2032F |
6.1.3 Denmark Low VOC Adhesive Market Revenues & Volume, By Metals, 2022 - 2032F |
6.1.4 Denmark Low VOC Adhesive Market Revenues & Volume, By Plastics, 2022 - 2032F |
6.1.5 Denmark Low VOC Adhesive Market Revenues & Volume, By Glass, 2022 - 2032F |
6.1.6 Denmark Low VOC Adhesive Market Revenues & Volume, By Wood, 2022 - 2032F |
6.1.7 Denmark Low VOC Adhesive Market Revenues & Volume, By Paper, 2022 - 2032F |
6.2 Denmark Low VOC Adhesive Market, By Application |
6.2.1 Overview and Analysis |
6.2.2 Denmark Low VOC Adhesive Market Revenues & Volume, By Automotive, 2022 - 2032F |
6.2.3 Denmark Low VOC Adhesive Market Revenues & Volume, By Construction, 2022 - 2032F |
6.2.4 Denmark Low VOC Adhesive Market Revenues & Volume, By Electronics, 2022 - 2032F |
6.2.5 Denmark Low VOC Adhesive Market Revenues & Volume, By Packaging, 2022 - 2032F |
6.2.6 Denmark Low VOC Adhesive Market Revenues & Volume, By Furniture, 2022 - 2032F |
6.3 Denmark Low VOC Adhesive Market, By Technology |
6.3.1 Overview and Analysis |
6.3.2 Denmark Low VOC Adhesive Market Revenues & Volume, By Water-based, 2022 - 2032F |
6.3.3 Denmark Low VOC Adhesive Market Revenues & Volume, By Solvent-based, 2022 - 2032F |
6.3.4 Denmark Low VOC Adhesive Market Revenues & Volume, By Hot-melt, 2022 - 2032F |
6.3.5 Denmark Low VOC Adhesive Market Revenues & Volume, By Reactive, 2022 - 2032F |
6.3.6 Denmark Low VOC Adhesive Market Revenues & Volume, By Pressure-sensitive, 2022 - 2032F |
6.4 Denmark Low VOC Adhesive Market, By Properties |
6.4.1 Overview and Analysis |
6.4.2 Denmark Low VOC Adhesive Market Revenues & Volume, By Low Odor, 2022 - 2032F |
6.4.3 Denmark Low VOC Adhesive Market Revenues & Volume, By High Adhesion, 2022 - 2032F |
6.4.4 Denmark Low VOC Adhesive Market Revenues & Volume, By Flexibility, 2022 - 2032F |
6.4.5 Denmark Low VOC Adhesive Market Revenues & Volume, By Heat Resistance, 2022 - 2032F |
6.4.6 Denmark Low VOC Adhesive Market Revenues & Volume, By Water Resistance, 2022 - 2032F |
7 Denmark Low VOC Adhesive Market Import-Export Trade Statistics |
7.1 Denmark Low VOC Adhesive Market Export to Major Countries |
7.2 Denmark Low VOC Adhesive Market Imports from Major Countries |
8 Denmark Low VOC Adhesive Market Key Performance Indicators |
8.1 Number of new product launches in the low VOC adhesive market. |
8.2 Adoption rate of low VOC adhesives in key industries in Denmark. |
8.3 Investment in research and development for low VOC adhesive technologies. |
8.4 Environmental certifications obtained by low VOC adhesive manufacturers. |
8.5 Market penetration of low VOC adhesives in the construction and automotive sectors. |
9 Denmark Low VOC Adhesive Market - Opportunity Assessment |
9.1 Denmark Low VOC Adhesive Market Opportunity Assessment, By Substrate Type, 2022 & 2032F |
9.2 Denmark Low VOC Adhesive Market Opportunity Assessment, By Application, 2022 & 2032F |
9.3 Denmark Low VOC Adhesive Market Opportunity Assessment, By Technology, 2022 & 2032F |
9.4 Denmark Low VOC Adhesive Market Opportunity Assessment, By Properties, 2022 & 2032F |
10 Denmark Low VOC Adhesive Market - Competitive Landscape |
10.1 Denmark Low VOC Adhesive Market Revenue Share, By Companies, 2025 |
10.2 Denmark Low VOC Adhesive Market Competitive Benchmarking, By Operating and Technical Parameters |
11 Company Profiles |
12 Recommendations |
13 Disclaimer |
Export potential assessment - trade Analytics for 2030
Export potential enables firms to identify high-growth global markets with greater confidence by combining advanced trade intelligence with a structured quantitative methodology. The framework analyzes emerging demand trends and country-level import patterns while integrating macroeconomic and trade datasets such as GDP and population forecasts, bilateral import–export flows, tariff structures, elasticity differentials between developed and developing economies, geographic distance, and import demand projections. Using weighted trade values from 2020–2024 as the base period to project country-to-country export potential for 2030, these inputs are operationalized through calculated drivers such as gravity model parameters, tariff impact factors, and projected GDP per-capita growth. Through an analysis of hidden potentials, demand hotspots, and market conditions that are most favorable to success, this method enables firms to focus on target countries, maximize returns, and global expansion with data, backed by accuracy.
By factoring in the projected importer demand gap that is currently unmet and could be potential opportunity, it identifies the potential for the Exporter (Country) among 190 countries, against the general trade analysis, which identifies the biggest importer or exporter.
To discover high-growth global markets and optimize your business strategy:
Click Here
Pricing
- Single User License$ 1,995
- Department License$ 2,400
- Site License$ 3,120
- Global License$ 3,795

Search
Thought Leadership and Analyst Meet


Our Clients
Latest Reports
- United Kingdom (UK) Outdoor Cooking Equipment Market (2026-2032) | Investment Opportunities, Outlook, Growth, Competition, Trends, Pricing, Demand, Insights, Challenges, Drivers, Size, Restraints, segmentation, Value, Share, Forecast, Companies, Analysis, Revenue, Strategy
- United Arab Emirates (UAE) Outdoor Cooking Equipment Market (2026-2032) | Challenges, Value, Restraints, Growth, Competition, Revenue, Trends, Outlook, Analysis, Drivers, Share, Investment Opportunities, Strategy, Demand, Companies, Forecast, Pricing, segmentation, Size, Insights
- Vietnam Outdoor Cooking Equipment Market (2026-2032) | Demand, Investment Opportunities, Growth, Pricing, Trends, Restraints, Competition, Outlook, Drivers, Strategy, Challenges, Revenue, Analysis, segmentation, Value, Size, Share, Insights, Companies, Forecast
- Venezuela Outdoor Cooking Equipment Market (2026-2032) | Challenges, Revenue, Demand, Value, Pricing, Strategy, Competition, Analysis, Companies, Insights, Growth, Outlook, Forecast, Size, Restraints, segmentation, Drivers, Trends, Investment Opportunities, Share
- Uganda Outdoor Cooking Equipment Market (2026-2032) | Drivers, Pricing, Challenges, Value, Growth, Companies, segmentation, Strategy, Analysis, Demand, Outlook, Size, Competition, Restraints, Revenue, Forecast, Investment Opportunities, Insights, Trends, Share
- Turkey Outdoor Cooking Equipment Market (2026-2032) | Size, Competition, Outlook, Strategy, Forecast, Drivers, Trends, Companies, Revenue, Growth, Analysis, segmentation, Insights, Pricing, Restraints, Demand, Investment Opportunities, Value, Share, Challenges
- Tunisia Outdoor Cooking Equipment Market (2026-2032) | Analysis, Share, Pricing, Trends, Size, Outlook, Revenue, segmentation, Demand, Insights, Investment Opportunities, Restraints, Growth, Forecast, Competition, Drivers, Challenges, Companies, Strategy, Value
- Thailand Outdoor Cooking Equipment Market (2026-2032) | Growth, Revenue, Insights, Companies, Drivers, Strategy, Forecast, Size, Analysis, segmentation, Trends, Challenges, Competition, Share, Investment Opportunities, Demand, Pricing, Value, Restraints, Outlook
- Tanzania Outdoor Cooking Equipment Market (2026-2032) | Share, Drivers, Forecast, Revenue, Growth, Outlook, Analysis, Investment Opportunities, Restraints, segmentation, Demand, Pricing, Size, Insights, Challenges, Competition, Companies, Value, Trends, Strategy
- Tajikistan Outdoor Cooking Equipment Market (2026-2032) | Value, Pricing, Companies, Share, Strategy, Revenue, Investment Opportunities, Demand, Forecast, Size, Competition, Challenges, Growth, Insights, Restraints, segmentation, Analysis, Trends, Drivers, Outlook
Industry Events and Analyst Meet

HIMTEX 2026

India Refining Summit 2026

India EV Show 2026

EV tech India Expo 2026

Auto Tech Asia 2026
Whitepaper
- Middle East & Africa Commercial Security Market Click here to view more.
- Middle East & Africa Fire Safety Systems & Equipment Market Click here to view more.
- GCC Drone Market Click here to view more.
- Middle East Lighting Fixture Market Click here to view more.
- GCC Physical & Perimeter Security Market Click here to view more.
6WResearch In News
- Doha a strategic location for EV manufacturing hub: IPA Qatar
- Demand for luxury TVs surging in the GCC, says Samsung
- Empowering Growth: The Thriving Journey of Bangladesh’s Cable Industry
- Demand for luxury TVs surging in the GCC, says Samsung
- Video call with a traditional healer? Once unthinkable, it’s now common in South Africa
- Intelligent Buildings To Smooth GCC’s Path To Net Zero