Denmark Optical Fiber Cables Market (2026-2032) | Restraints, Companies, Industry, Challenges, Outlook, Pricing Analysis, Segments, Trends, Strategic Insights, Share, Opportunities, Forecast, Consumer Insights, Segmentation, Value, Revenue, Supply, Competitive, Analysis, Drivers, Growth, Demand, Strategy, Competition, Investment Trends, Size
Market Forecast By Type (Single Mode, Multi-Mode, Plastic Optical Fiber, Others), By Mode of Transmission (Plastic Optical Fiber, Glass Optical Fiber), By Application (Telecommunication, Military & Aerospace, Industrial, Others), By Material (Glass, Plastic), By End Use (Data Centers, Enterprises, Healthcare, Residential) And Competitive Landscape
| Product Code: ETC10712024 | Publication Date: Apr 2025 | Updated Date: Apr 2026 | Product Type: Market Research Report | |
| Publisher: 6Wresearch | No. of Pages: 65 | No. of Figures: 34 | No. of Tables: 19 | |
Denmark Optical Fiber Cables Market Size (2020-2030)
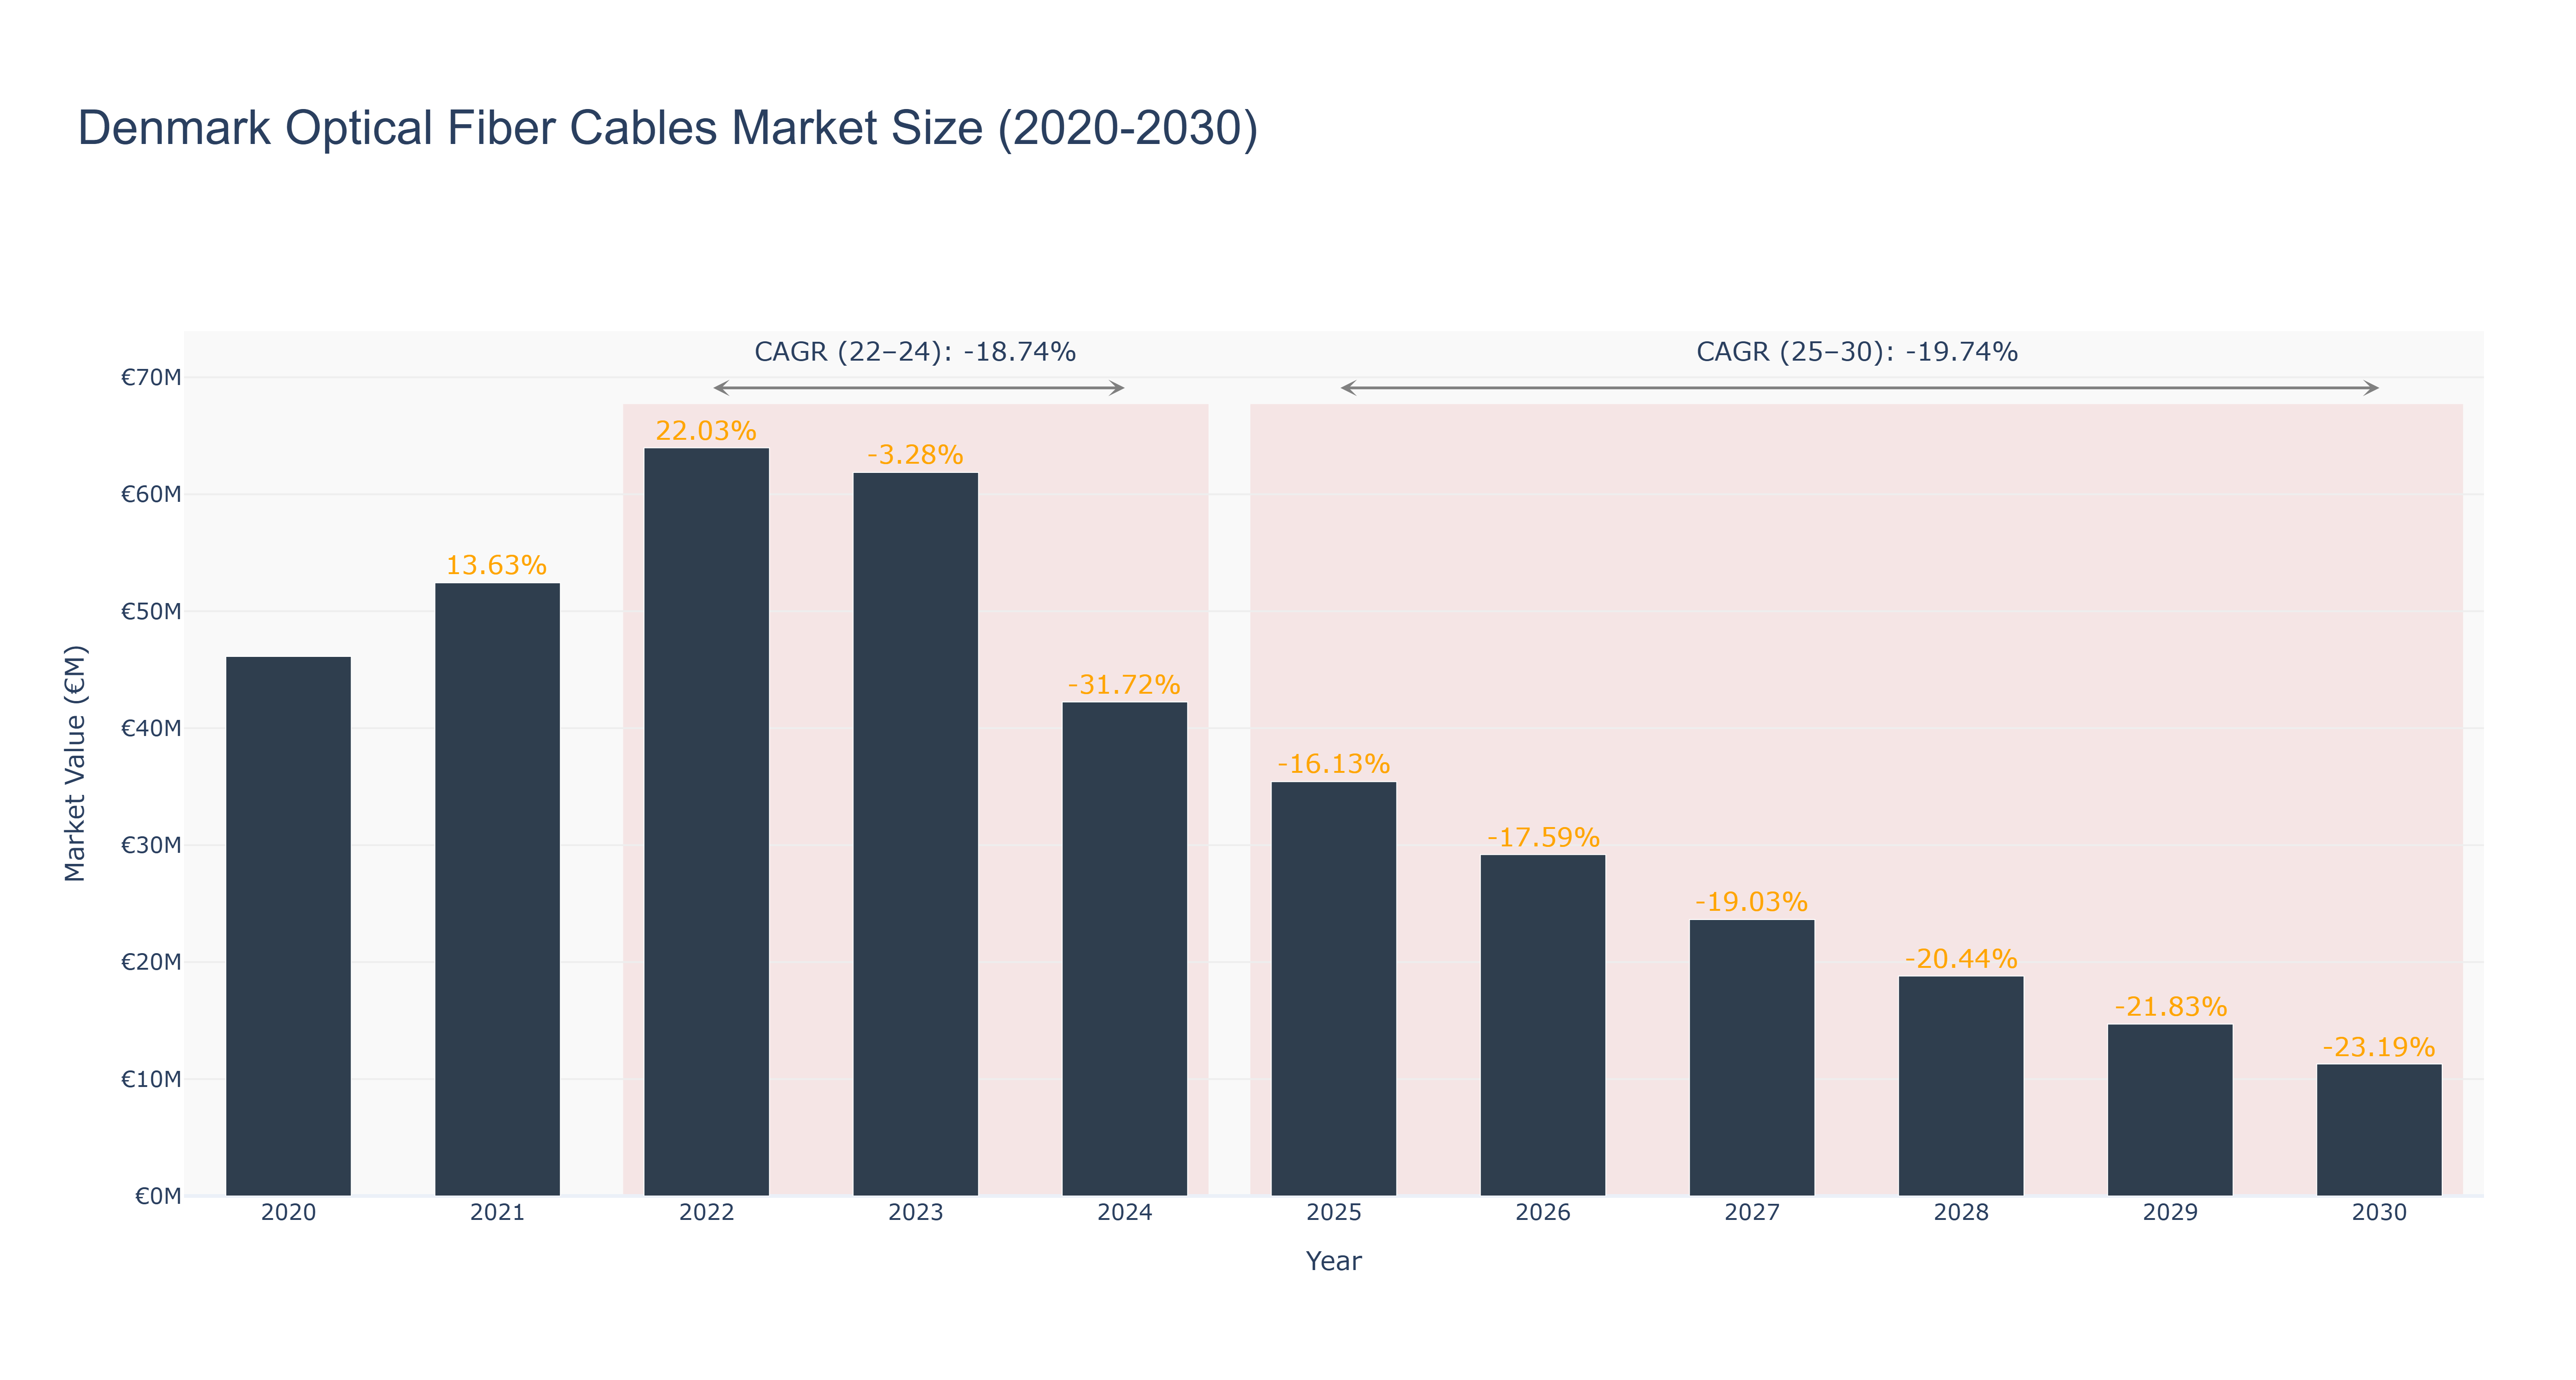
The Denmark Optical Fiber Cables Market experienced notable growth during the 2022-2024 period, peaking at €63.97 million in 2022, followed by a decline to €42.24 million in 2024, resulting in an actual CAGR of -18.74%. This downturn reflects a combination of market saturation, increased competition, and shifting technological preferences impacting demand. Looking ahead, the forecasted period from 2025 to 2030 indicates a continued contraction, with projected market sizes decreasing from €35.43 million in 2025 to €11.29 million by 2030, representing a CAGR of -19.74%. Factors contributing to this decline include the increasing adoption of alternative connectivity solutions and potential economic challenges. While specific upcoming projects are not highlighted, the overall market dynamics suggest a need for innovation and adaptation within the industry to counteract these trends and seek new growth opportunities.
Denmark Optical Fiber Cables Market: Production & Trade Performance (2019-2025)
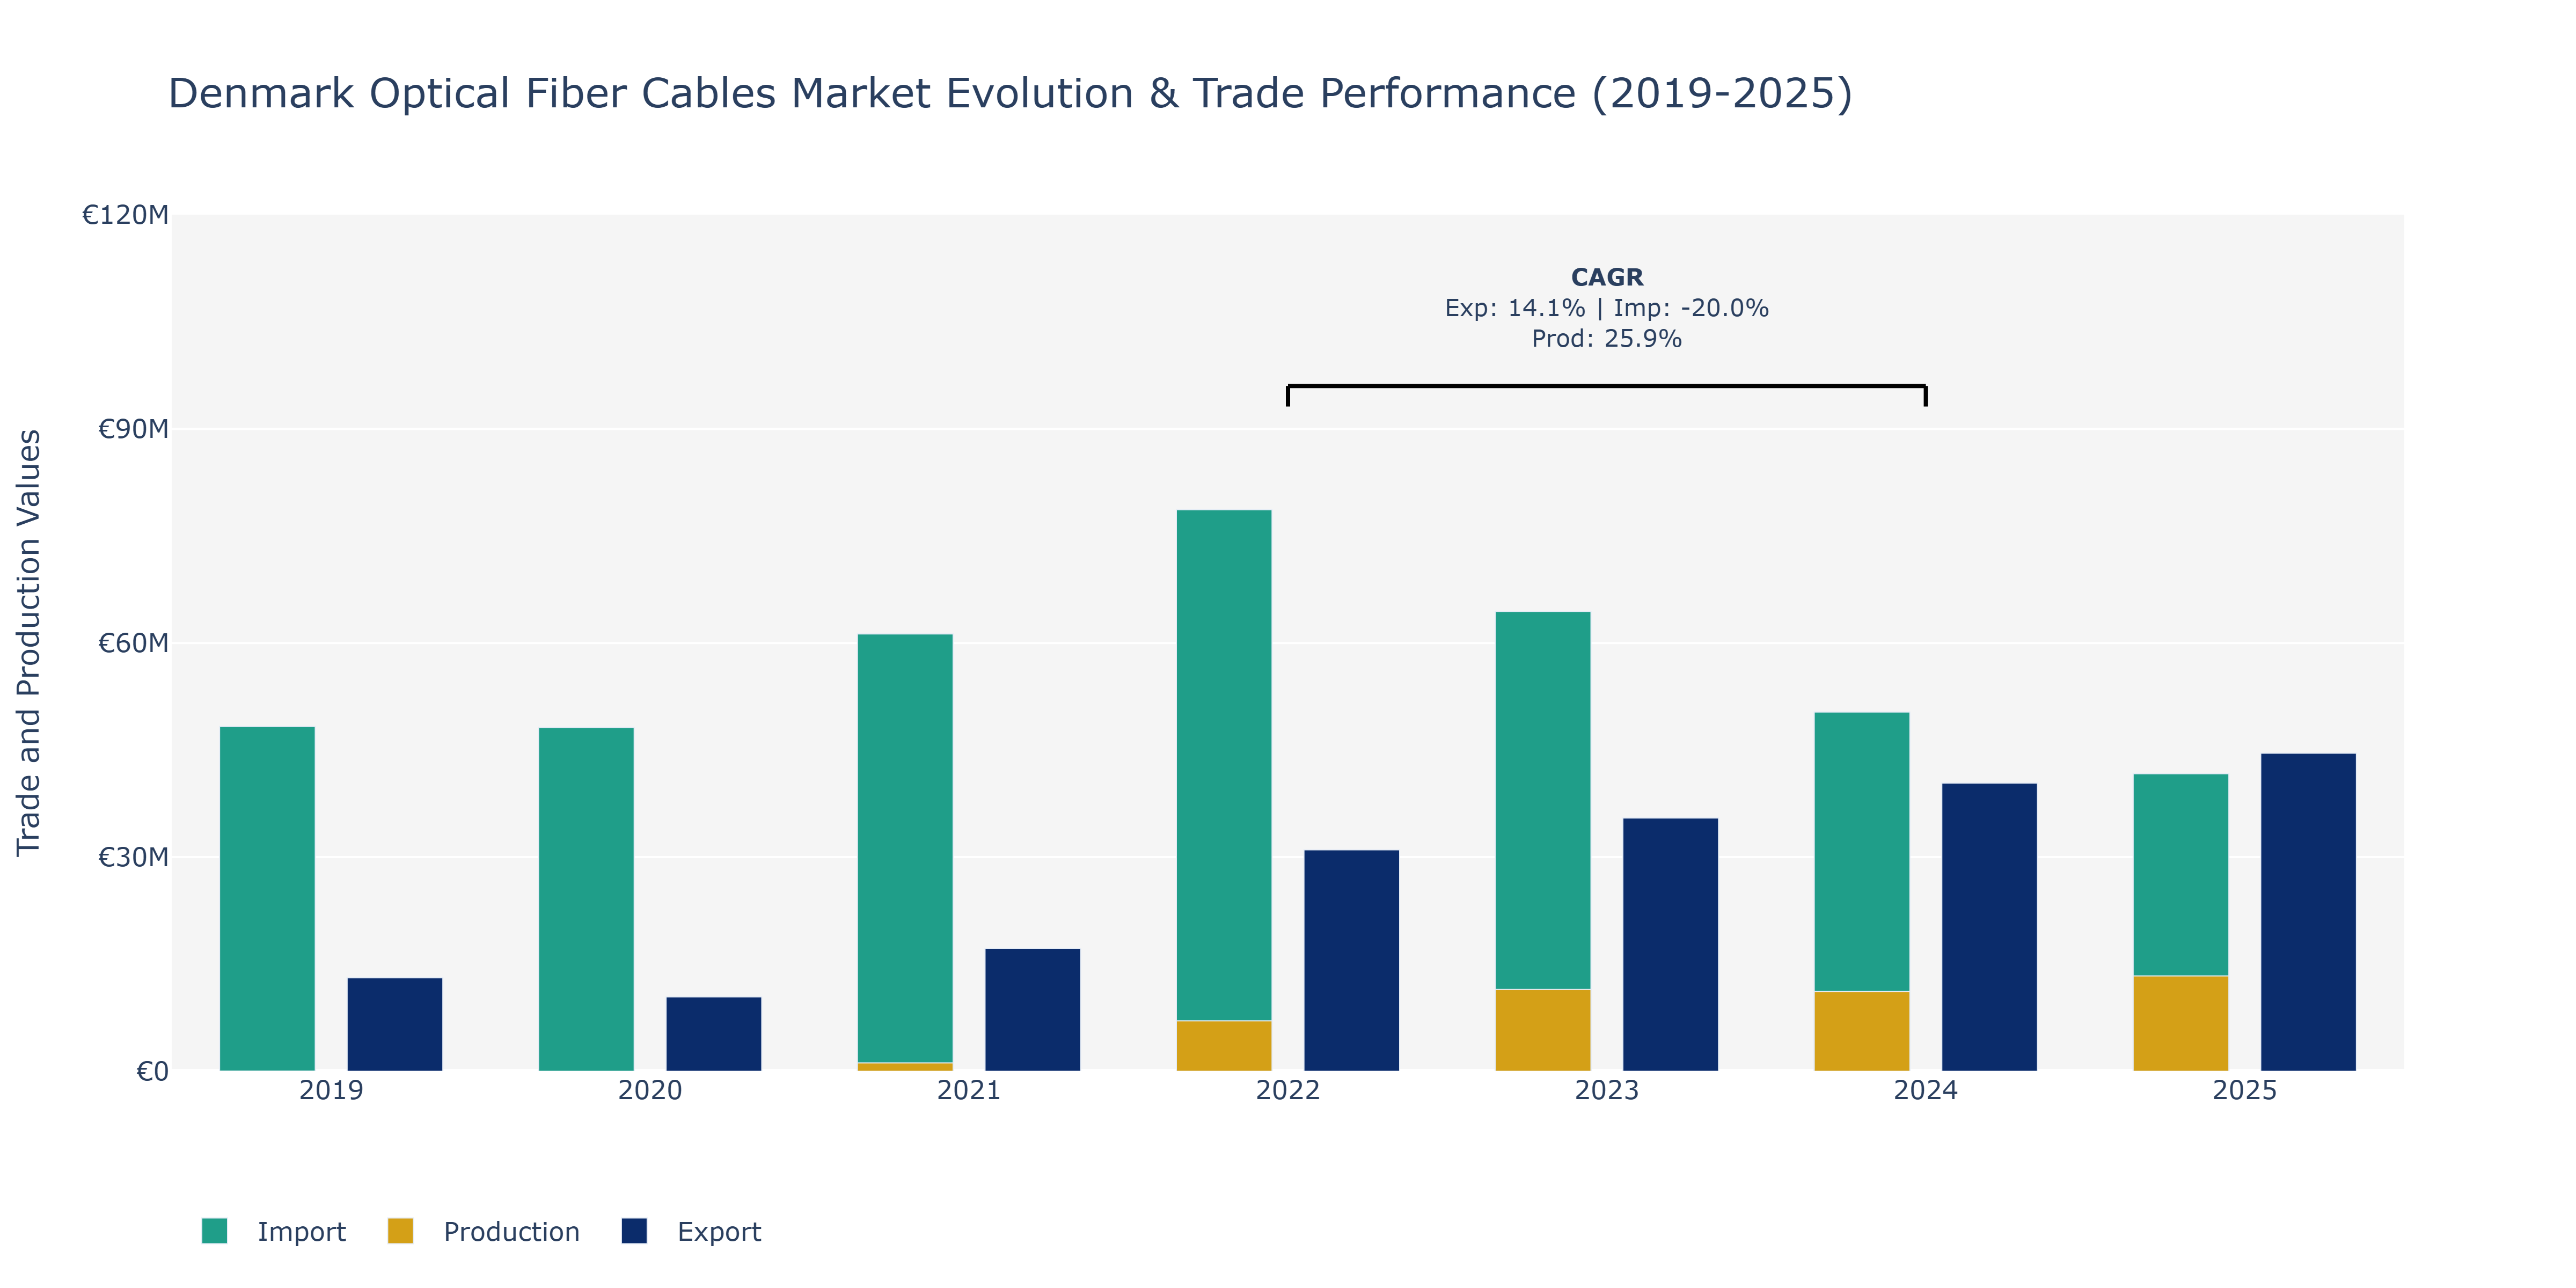
In the Denmark Optical Fiber Cables Market, from 2019 to 2025, there were fluctuations in exports, imports, and production. Exports started at €13.08 million in 2019, declined to around €10.42 million in 2020, then showed a consistent upward trend, reaching approximately €44.55 million in 2025. Imports were at their peak in 2022 at €78.69 million but decreased to about €41.68 million in 2025. Production increased significantly from €22.77 million in 2019 to €13.34 billion in 2025. The drop in imports can be attributed to a shift towards domestic production, supported by government initiatives promoting local manufacturing of optical fiber cables. The increasing exports indicate the growing demand for Denmark's high-quality optical fiber cables globally, possibly driven by the country's reputation for innovation in the telecommunications industry and the rising global demand for high-speed internet connectivity.
Key Highlights of the Report:
- Denmark Optical Fiber Cables Market Outlook
- Market Size of Denmark Optical Fiber Cables Market, 2025
- Forecast of Denmark Optical Fiber Cables Market, 2032
- Historical Data and Forecast of Denmark Optical Fiber Cables Revenues & Volume for the Period 2022 - 2032F
- Denmark Optical Fiber Cables Market Trend Evolution
- Denmark Optical Fiber Cables Market Drivers and Challenges
- Denmark Optical Fiber Cables Price Trends
- Denmark Optical Fiber Cables Porter's Five Forces
- Denmark Optical Fiber Cables Industry Life Cycle
- Historical Data and Forecast of Denmark Optical Fiber Cables Market Revenues & Volume By Type for the Period 2022 - 2032F
- Historical Data and Forecast of Denmark Optical Fiber Cables Market Revenues & Volume By Single Mode for the Period 2022 - 2032F
- Historical Data and Forecast of Denmark Optical Fiber Cables Market Revenues & Volume By Multi-Mode for the Period 2022 - 2032F
- Historical Data and Forecast of Denmark Optical Fiber Cables Market Revenues & Volume By Plastic Optical Fiber for the Period 2022 - 2032F
- Historical Data and Forecast of Denmark Optical Fiber Cables Market Revenues & Volume By Others for the Period 2022 - 2032F
- Historical Data and Forecast of Denmark Optical Fiber Cables Market Revenues & Volume By Mode of Transmission for the Period 2022 - 2032F
- Historical Data and Forecast of Denmark Optical Fiber Cables Market Revenues & Volume By Plastic Optical Fiber for the Period 2022 - 2032F
- Historical Data and Forecast of Denmark Optical Fiber Cables Market Revenues & Volume By Glass Optical Fiber for the Period 2022 - 2032F
- Historical Data and Forecast of Denmark Optical Fiber Cables Market Revenues & Volume By Application for the Period 2022 - 2032F
- Historical Data and Forecast of Denmark Optical Fiber Cables Market Revenues & Volume By Telecommunication for the Period 2022 - 2032F
- Historical Data and Forecast of Denmark Optical Fiber Cables Market Revenues & Volume By Military & Aerospace for the Period 2022 - 2032F
- Historical Data and Forecast of Denmark Optical Fiber Cables Market Revenues & Volume By Industrial for the Period 2022 - 2032F
- Historical Data and Forecast of Denmark Optical Fiber Cables Market Revenues & Volume By Others for the Period 2022 - 2032F
- Historical Data and Forecast of Denmark Optical Fiber Cables Market Revenues & Volume By Material for the Period 2022 - 2032F
- Historical Data and Forecast of Denmark Optical Fiber Cables Market Revenues & Volume By Glass for the Period 2022 - 2032F
- Historical Data and Forecast of Denmark Optical Fiber Cables Market Revenues & Volume By Plastic for the Period 2022 - 2032F
- Historical Data and Forecast of Denmark Optical Fiber Cables Market Revenues & Volume By End Use for the Period 2022 - 2032F
- Historical Data and Forecast of Denmark Optical Fiber Cables Market Revenues & Volume By Data Centers for the Period 2022 - 2032F
- Historical Data and Forecast of Denmark Optical Fiber Cables Market Revenues & Volume By Enterprises for the Period 2022 - 2032F
- Historical Data and Forecast of Denmark Optical Fiber Cables Market Revenues & Volume By Healthcare for the Period 2022 - 2032F
- Historical Data and Forecast of Denmark Optical Fiber Cables Market Revenues & Volume By Residential for the Period 2022 - 2032F
- Denmark Optical Fiber Cables Import Export Trade Statistics
- Market Opportunity Assessment By Type
- Market Opportunity Assessment By Mode of Transmission
- Market Opportunity Assessment By Application
- Market Opportunity Assessment By Material
- Market Opportunity Assessment By End Use
- Denmark Optical Fiber Cables Top Companies Market Share
- Denmark Optical Fiber Cables Competitive Benchmarking By Technical and Operational Parameters
- Denmark Optical Fiber Cables Company Profiles
- Denmark Optical Fiber Cables Key Strategic Recommendations
Frequently Asked Questions About the Market Study (FAQs):
6Wresearch actively monitors the Denmark Optical Fiber Cables Market and publishes its comprehensive annual report, highlighting emerging trends, growth drivers, revenue analysis, and forecast outlook. Our insights help businesses to make data-backed strategic decisions with ongoing market dynamics. Our analysts track relevent industries related to the Denmark Optical Fiber Cables Market, allowing our clients with actionable intelligence and reliable forecasts tailored to emerging regional needs.
Yes, we provide customisation as per your requirements. To learn more, feel free to contact us on sales@6wresearch.com
1 Executive Summary |
2 Introduction |
2.1 Key Highlights of the Report |
2.2 Report Description |
2.3 Market Scope & Segmentation |
2.4 Research Methodology |
2.5 Assumptions |
3 Denmark Optical Fiber Cables Market Overview |
3.1 Denmark Country Macro Economic Indicators |
3.2 Denmark Optical Fiber Cables Market Revenues & Volume, 2022 & 2032F |
3.3 Denmark Optical Fiber Cables Market - Industry Life Cycle |
3.4 Denmark Optical Fiber Cables Market - Porter's Five Forces |
3.5 Denmark Optical Fiber Cables Market Revenues & Volume Share, By Type, 2022 & 2032F |
3.6 Denmark Optical Fiber Cables Market Revenues & Volume Share, By Mode of Transmission, 2022 & 2032F |
3.7 Denmark Optical Fiber Cables Market Revenues & Volume Share, By Application, 2022 & 2032F |
3.8 Denmark Optical Fiber Cables Market Revenues & Volume Share, By Material, 2022 & 2032F |
3.9 Denmark Optical Fiber Cables Market Revenues & Volume Share, By End Use, 2022 & 2032F |
4 Denmark Optical Fiber Cables Market Dynamics |
4.1 Impact Analysis |
4.2 Market Drivers |
4.2.1 Increasing demand for high-speed internet and data transmission services |
4.2.2 Growing investments in telecommunications infrastructure |
4.2.3 Government initiatives to promote digitalization and connectivity |
4.3 Market Restraints |
4.3.1 High initial setup costs for optical fiber cable installations |
4.3.2 Limited availability of skilled labor for installation and maintenance |
4.3.3 Potential regulatory hurdles and environmental concerns related to laying optical fiber cables |
5 Denmark Optical Fiber Cables Market Trends |
6 Denmark Optical Fiber Cables Market, By Types |
6.1 Denmark Optical Fiber Cables Market, By Type |
6.1.1 Overview and Analysis |
6.1.2 Denmark Optical Fiber Cables Market Revenues & Volume, By Type, 2022 - 2032F |
6.1.3 Denmark Optical Fiber Cables Market Revenues & Volume, By Single Mode, 2022 - 2032F |
6.1.4 Denmark Optical Fiber Cables Market Revenues & Volume, By Multi-Mode, 2022 - 2032F |
6.1.5 Denmark Optical Fiber Cables Market Revenues & Volume, By Plastic Optical Fiber, 2022 - 2032F |
6.1.6 Denmark Optical Fiber Cables Market Revenues & Volume, By Others, 2022 - 2032F |
6.2 Denmark Optical Fiber Cables Market, By Mode of Transmission |
6.2.1 Overview and Analysis |
6.2.2 Denmark Optical Fiber Cables Market Revenues & Volume, By Plastic Optical Fiber, 2022 - 2032F |
6.2.3 Denmark Optical Fiber Cables Market Revenues & Volume, By Glass Optical Fiber, 2022 - 2032F |
6.3 Denmark Optical Fiber Cables Market, By Application |
6.3.1 Overview and Analysis |
6.3.2 Denmark Optical Fiber Cables Market Revenues & Volume, By Telecommunication, 2022 - 2032F |
6.3.3 Denmark Optical Fiber Cables Market Revenues & Volume, By Military & Aerospace, 2022 - 2032F |
6.3.4 Denmark Optical Fiber Cables Market Revenues & Volume, By Industrial, 2022 - 2032F |
6.3.5 Denmark Optical Fiber Cables Market Revenues & Volume, By Others, 2022 - 2032F |
6.4 Denmark Optical Fiber Cables Market, By Material |
6.4.1 Overview and Analysis |
6.4.2 Denmark Optical Fiber Cables Market Revenues & Volume, By Glass, 2022 - 2032F |
6.4.3 Denmark Optical Fiber Cables Market Revenues & Volume, By Plastic, 2022 - 2032F |
6.5 Denmark Optical Fiber Cables Market, By End Use |
6.5.1 Overview and Analysis |
6.5.2 Denmark Optical Fiber Cables Market Revenues & Volume, By Data Centers, 2022 - 2032F |
6.5.3 Denmark Optical Fiber Cables Market Revenues & Volume, By Enterprises, 2022 - 2032F |
6.5.4 Denmark Optical Fiber Cables Market Revenues & Volume, By Healthcare, 2022 - 2032F |
6.5.5 Denmark Optical Fiber Cables Market Revenues & Volume, By Residential, 2022 - 2032F |
7 Denmark Optical Fiber Cables Market Import-Export Trade Statistics |
7.1 Denmark Optical Fiber Cables Market Export to Major Countries |
7.2 Denmark Optical Fiber Cables Market Imports from Major Countries |
8 Denmark Optical Fiber Cables Market Key Performance Indicators |
8.1 Average revenue per user (ARPU) for broadband services |
8.2 Number of households/businesses connected to high-speed internet |
8.3 Percentage of government budget allocated to telecommunications infrastructure development |
9 Denmark Optical Fiber Cables Market - Opportunity Assessment |
9.1 Denmark Optical Fiber Cables Market Opportunity Assessment, By Type, 2022 & 2032F |
9.2 Denmark Optical Fiber Cables Market Opportunity Assessment, By Mode of Transmission, 2022 & 2032F |
9.3 Denmark Optical Fiber Cables Market Opportunity Assessment, By Application, 2022 & 2032F |
9.4 Denmark Optical Fiber Cables Market Opportunity Assessment, By Material, 2022 & 2032F |
9.5 Denmark Optical Fiber Cables Market Opportunity Assessment, By End Use, 2022 & 2032F |
10 Denmark Optical Fiber Cables Market - Competitive Landscape |
10.1 Denmark Optical Fiber Cables Market Revenue Share, By Companies, 2025 |
10.2 Denmark Optical Fiber Cables Market Competitive Benchmarking, By Operating and Technical Parameters |
11 Company Profiles |
12 Recommendations |
13 Disclaimer |
Global Go To Market Strategy - 2030
Export potential enables firms to identify high-growth global markets with greater confidence by combining advanced trade intelligence with a structured quantitative methodology. The framework analyzes emerging demand trends and country-level import patterns while integrating macroeconomic and trade datasets such as GDP and population forecasts, bilateral import–export flows, tariff structures, elasticity differentials between developed and developing economies, geographic distance, and import demand projections. Using weighted trade values from 2020–2024 as the base period to project country-to-country export potential for 2030, these inputs are operationalized through calculated drivers such as gravity model parameters, tariff impact factors, and projected GDP per-capita growth. Through an analysis of hidden potentials, demand hotspots, and market conditions that are most favorable to success, this method enables firms to focus on target countries, maximize returns, and global expansion with data, backed by accuracy.
By factoring in the projected importer demand gap that is currently unmet and could be potential opportunity, it identifies the potential for the Exporter (Country) among 190 countries, against the general trade analysis, which identifies the biggest importer or exporter.
To discover high-growth global markets and optimize your business strategy:
Click Here
Pricing
- Single User License$ 1,995
- Department License$ 2,400
- Site License$ 3,120
- Global License$ 3,795

Leadership Perspectives from Industry Events
Search
Thought Leadership and Analyst Meet


Our Clients
6WResearch In News
- Doha a strategic location for EV manufacturing hub: IPA Qatar
- Demand for luxury TVs surging in the GCC, says Samsung
- Empowering Growth: The Thriving Journey of Bangladesh’s Cable Industry
- Demand for luxury TVs surging in the GCC, says Samsung
- Video call with a traditional healer? Once unthinkable, it’s now common in South Africa
- Intelligent Buildings To Smooth GCC’s Path To Net Zero
Latest Reports
- New Zealand Aseptic Manufacturing Market (2026-2032)
- Netherlands Aseptic Manufacturing Market (2026-2032)
- Nauru Aseptic Manufacturing Market (2026-2032)
- Namibia Aseptic Manufacturing Market (2026-2032)
- Mozambique Aseptic Manufacturing Market (2026-2032)
- Montenegro Aseptic Manufacturing Market (2026-2032)
- Mongolia Aseptic Manufacturing Market (2026-2032)
- Monaco Aseptic Manufacturing Market (2026-2032)
- Micronesia Aseptic Manufacturing Market (2026-2032)
- Mauritius Aseptic Manufacturing Market (2026-2032)
Industry Events and Analyst Meet

HIMTEX 2026

India Refining Summit 2026

India EV Show 2026

EV tech India Expo 2026

Auto Tech Asia 2026
Whitepaper
- Middle East & Africa Commercial Security Market Click here to view more.
- Middle East & Africa Fire Safety Systems & Equipment Market Click here to view more.
- GCC Drone Market Click here to view more.
- Middle East Lighting Fixture Market Click here to view more.
- GCC Physical & Perimeter Security Market Click here to view more.