Denmark Sodium Nitrate Market (2026-2032) | Segmentation, Companies, Analysis, Growth, Trends, Value, Forecast, Outlook, Industry, Size, Revenue & Share
Market Forecast By Type (Sodium Nitrate Crystal, Industrial Sodium Nitrate), By Application (Glass, Explosives, Agricultural, Chemical Industry, Other) And Competitive Landscape
| Product Code: ETC4820743 | Publication Date: Nov 2023 | Updated Date: Apr 2026 | Product Type: Market Research Report | |
| Publisher: 6Wresearch | Author: Shubham Padhi | No. of Pages: 60 | No. of Figures: 30 | No. of Tables: 5 |
Denmark Sodium Nitrate Market Size (2020-2030)
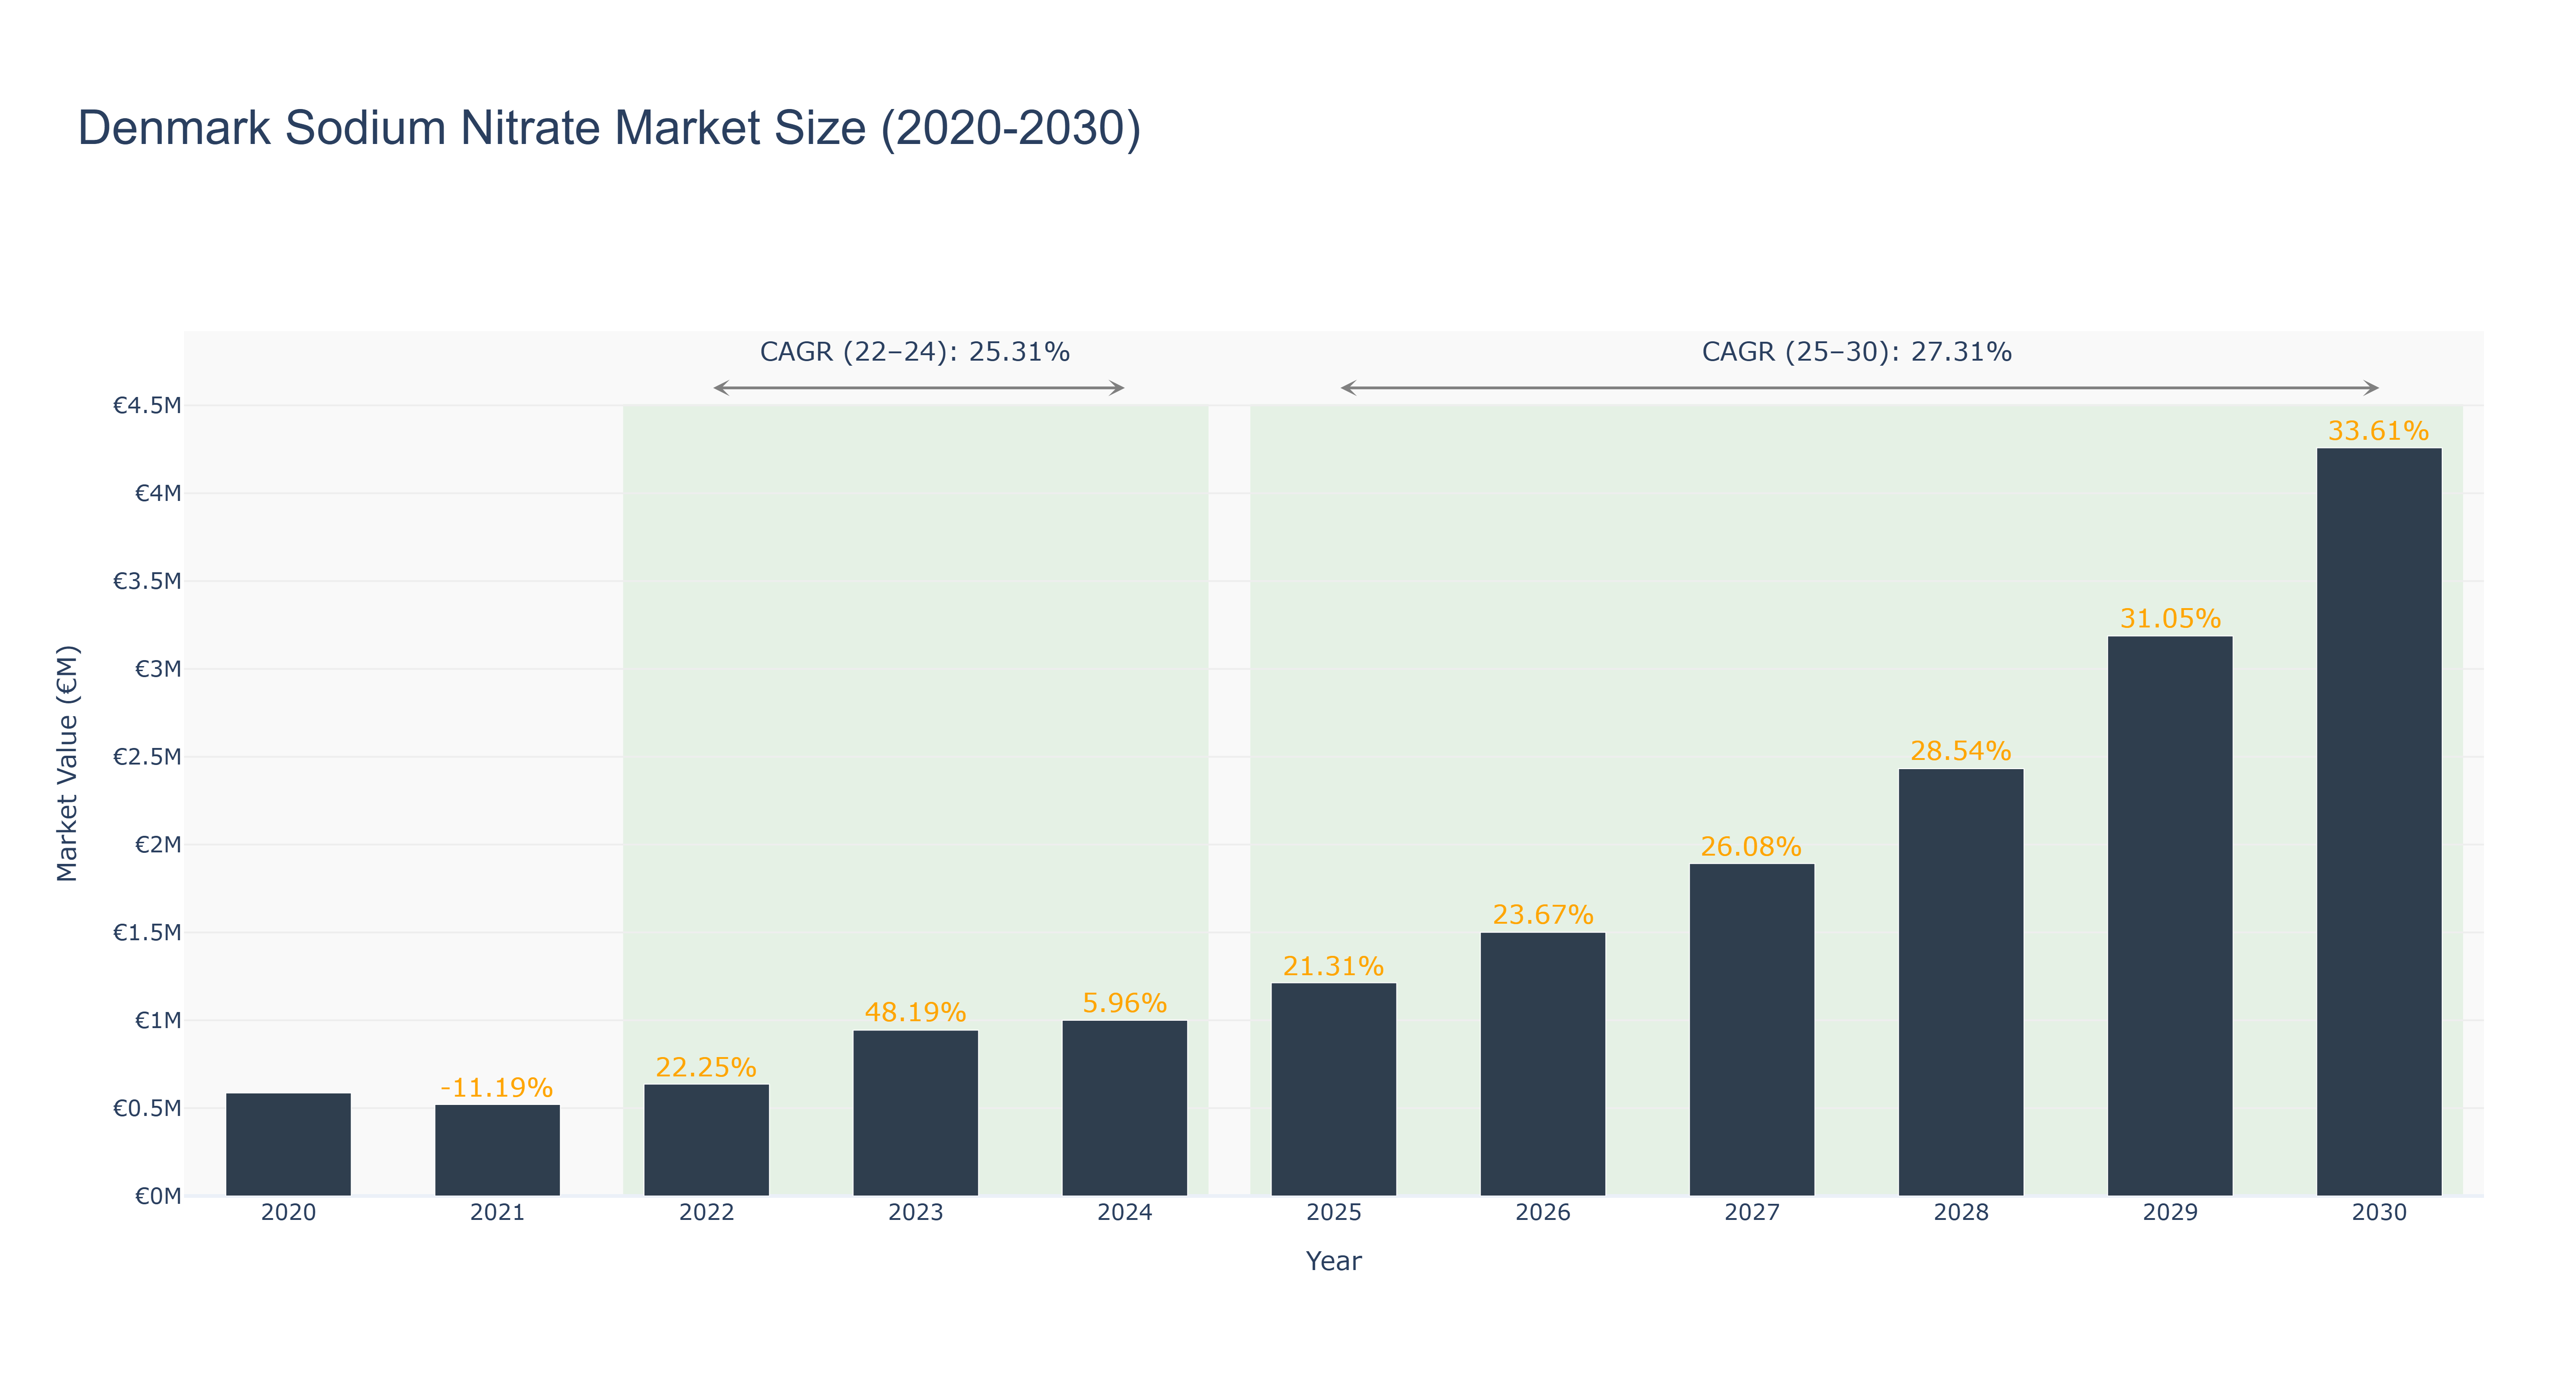
Denmark Sodium Nitrate Market has shown a steady growth trajectory over the past decade. The market peaked at €4.26 million in 2030, with a notable increase in market size from 2020 to 2030. The actual market size saw a significant rise from €0.59 million in 2020 to €4.26 million in 2030, showcasing a robust CAGR of 33.61%. The forecasted CAGR for the period 2025-2030 is projected to be 27.31%. The market experienced a dip in growth in 2021 due to external factors impacting demand, but rebounded swiftly with consistent growth driven by factors like increasing industrial applications and technological advancements in the chemical sector. Looking ahead, Denmark is set to invest in sustainable production methods for sodium nitrate, aligning with the country's green initiatives and fostering a competitive edge in the global market.
Denmark Sodium Nitrate Market: Production & Trade Performance (2019-2025)
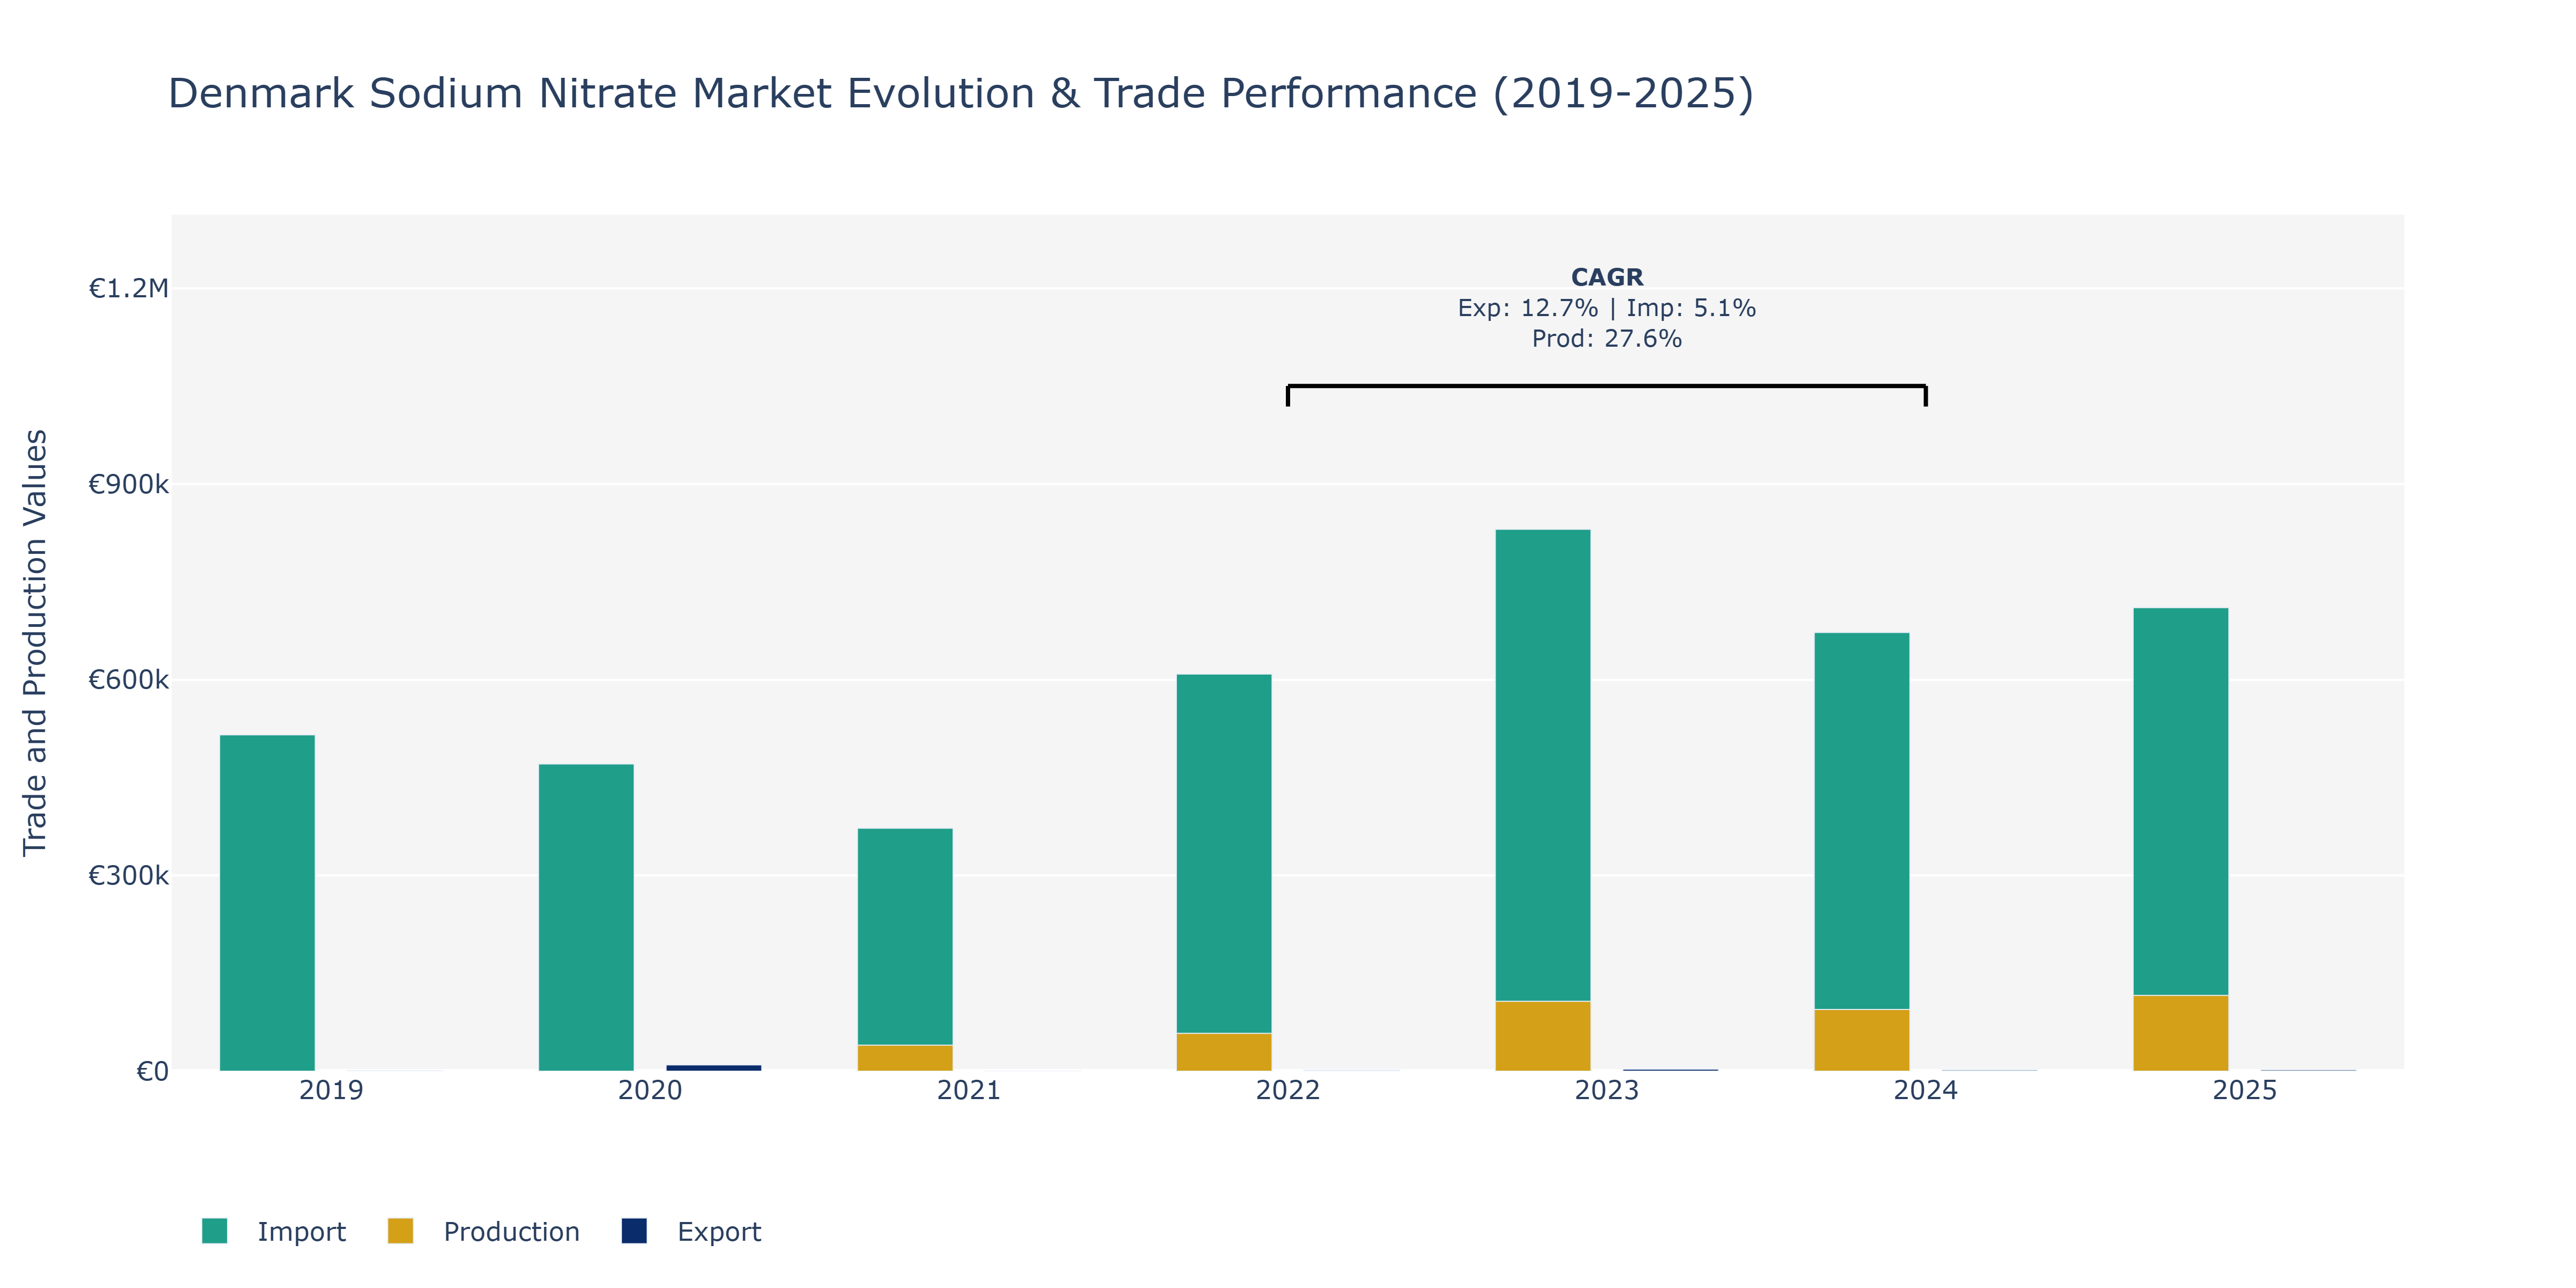
In the Denmark Sodium Nitrate Market, exports exhibited notable fluctuations over the years, with a substantial increase from €390 in 2019 to €9.74 thousand in 2020, followed by a sharp decline to €40 in 2021. This dip was then reversed in the subsequent years, reaching €2.02 thousand in 2025. Imports, on the other hand, demonstrated a more stable growth pattern, rising consistently from €515.51 thousand in 2019 to €710.57 thousand in 2025. Production also witnessed a steady increase, from €39.935 million in 2021 to €116.292 million in 2025. The rise in production can be attributed to increasing demand for sodium nitrate in various industries such as agriculture, pharmaceuticals, and chemicals, reflecting Denmark's position as a key player in the global sodium nitrate market. The fluctuations in exports can be linked to global market dynamics, trade policies, and competitive pressures within the industry.
Key Highlights of the Report:
- Denmark Sodium Nitrate Market Outlook
- Market Size of Denmark Sodium Nitrate Market, 2025
- Forecast of Denmark Sodium Nitrate Market, 2032
- Historical Data and Forecast of Denmark Sodium Nitrate Revenues & Volume for the Period 2022 - 2032F
- Denmark Sodium Nitrate Market Trend Evolution
- Denmark Sodium Nitrate Market Drivers and Challenges
- Denmark Sodium Nitrate Price Trends
- Denmark Sodium Nitrate Porter`s Five Forces
- Denmark Sodium Nitrate Industry Life Cycle
- Historical Data and Forecast of Denmark Sodium Nitrate Market Revenues & Volume By Type for the Period 2022 - 2032F
- Historical Data and Forecast of Denmark Sodium Nitrate Market Revenues & Volume By Sodium Nitrate Crystal for the Period 2022 - 2032F
- Historical Data and Forecast of Denmark Sodium Nitrate Market Revenues & Volume By Industrial Sodium Nitrate for the Period 2022 - 2032F
- Historical Data and Forecast of Denmark Sodium Nitrate Market Revenues & Volume By Application for the Period 2022 - 2032F
- Historical Data and Forecast of Denmark Sodium Nitrate Market Revenues & Volume By Glass for the Period 2022 - 2032F
- Historical Data and Forecast of Denmark Sodium Nitrate Market Revenues & Volume By Explosives for the Period 2022 - 2032F
- Historical Data and Forecast of Denmark Sodium Nitrate Market Revenues & Volume By Agricultural for the Period 2022 - 2032F
- Historical Data and Forecast of Denmark Sodium Nitrate Market Revenues & Volume By Chemical Industry for the Period 2022 - 2032F
- Historical Data and Forecast of Denmark Sodium Nitrate Market Revenues & Volume By Other for the Period 2022 - 2032F
- Denmark Sodium Nitrate Import Export Trade Statistics
- Market Opportunity Assessment By Type
- Market Opportunity Assessment By Application
- Denmark Sodium Nitrate Top Companies Market Share
- Denmark Sodium Nitrate Competitive Benchmarking By Technical and Operational Parameters
- Denmark Sodium Nitrate Company Profiles
- Denmark Sodium Nitrate Key Strategic Recommendations
Frequently Asked Questions About the Market Study (FAQs):
6Wresearch actively monitors the Denmark Sodium Nitrate Market and publishes its comprehensive annual report, highlighting emerging trends, growth drivers, revenue analysis, and forecast outlook. Our insights help businesses to make data-backed strategic decisions with ongoing market dynamics. Our analysts track relevent industries related to the Denmark Sodium Nitrate Market, allowing our clients with actionable intelligence and reliable forecasts tailored to emerging regional needs.
Yes, we provide customisation as per your requirements. To learn more, feel free to contact us on sales@6wresearch.com
1 Executive Summary |
2 Introduction |
2.1 Key Highlights of the Report |
2.2 Report Description |
2.3 Market Scope & Segmentation |
2.4 Research Methodology |
2.5 Assumptions |
3 Denmark Sodium Nitrate Market Overview |
3.1 Denmark Country Macro Economic Indicators |
3.2 Denmark Sodium Nitrate Market Revenues & Volume, 2022 & 2032F |
3.3 Denmark Sodium Nitrate Market - Industry Life Cycle |
3.4 Denmark Sodium Nitrate Market - Porter's Five Forces |
3.5 Denmark Sodium Nitrate Market Revenues & Volume Share, By Type, 2022 & 2032F |
3.6 Denmark Sodium Nitrate Market Revenues & Volume Share, By Application, 2022 & 2032F |
4 Denmark Sodium Nitrate Market Dynamics |
4.1 Impact Analysis |
4.2 Market Drivers |
4.2.1 Increasing demand for sodium nitrate in the agriculture sector for use as a fertilizer |
4.2.2 Growing applications of sodium nitrate in the food and beverage industry as a food preservative |
4.2.3 Rising awareness about the benefits of sodium nitrate in pharmaceuticals for medicinal purposes |
4.3 Market Restraints |
4.3.1 Stringent regulations and restrictions on the use of sodium nitrate in certain industries |
4.3.2 Fluctuating prices of raw materials affecting the production cost of sodium nitrate |
5 Denmark Sodium Nitrate Market Trends |
6 Denmark Sodium Nitrate Market Segmentations |
6.1 Denmark Sodium Nitrate Market, By Type |
6.1.1 Overview and Analysis |
6.1.2 Denmark Sodium Nitrate Market Revenues & Volume, By Sodium Nitrate Crystal, 2022 - 2032F |
6.1.3 Denmark Sodium Nitrate Market Revenues & Volume, By Industrial Sodium Nitrate, 2022 - 2032F |
6.2 Denmark Sodium Nitrate Market, By Application |
6.2.1 Overview and Analysis |
6.2.2 Denmark Sodium Nitrate Market Revenues & Volume, By Glass, 2022 - 2032F |
6.2.3 Denmark Sodium Nitrate Market Revenues & Volume, By Explosives, 2022 - 2032F |
6.2.4 Denmark Sodium Nitrate Market Revenues & Volume, By Agricultural, 2022 - 2032F |
6.2.5 Denmark Sodium Nitrate Market Revenues & Volume, By Chemical Industry, 2022 - 2032F |
6.2.6 Denmark Sodium Nitrate Market Revenues & Volume, By Other, 2022 - 2032F |
7 Denmark Sodium Nitrate Market Import-Export Trade Statistics |
7.1 Denmark Sodium Nitrate Market Export to Major Countries |
7.2 Denmark Sodium Nitrate Market Imports from Major Countries |
8 Denmark Sodium Nitrate Market Key Performance Indicators |
8.1 Number of new product developments or innovations using sodium nitrate |
8.2 Adoption rate of sodium nitrate in key end-user industries |
8.3 Percentage increase in research and development investments in sodium nitrate technologies |
9 Denmark Sodium Nitrate Market - Opportunity Assessment |
9.1 Denmark Sodium Nitrate Market Opportunity Assessment, By Type, 2022 & 2032F |
9.2 Denmark Sodium Nitrate Market Opportunity Assessment, By Application, 2022 & 2032F |
10 Denmark Sodium Nitrate Market - Competitive Landscape |
10.1 Denmark Sodium Nitrate Market Revenue Share, By Companies, 2025 |
10.2 Denmark Sodium Nitrate Market Competitive Benchmarking, By Operating and Technical Parameters |
11 Company Profiles |
12 Recommendations | 13 Disclaimer |
Export potential assessment - trade Analytics for 2030
Export potential enables firms to identify high-growth global markets with greater confidence by combining advanced trade intelligence with a structured quantitative methodology. The framework analyzes emerging demand trends and country-level import patterns while integrating macroeconomic and trade datasets such as GDP and population forecasts, bilateral import–export flows, tariff structures, elasticity differentials between developed and developing economies, geographic distance, and import demand projections. Using weighted trade values from 2020–2024 as the base period to project country-to-country export potential for 2030, these inputs are operationalized through calculated drivers such as gravity model parameters, tariff impact factors, and projected GDP per-capita growth. Through an analysis of hidden potentials, demand hotspots, and market conditions that are most favorable to success, this method enables firms to focus on target countries, maximize returns, and global expansion with data, backed by accuracy.
By factoring in the projected importer demand gap that is currently unmet and could be potential opportunity, it identifies the potential for the Exporter (Country) among 190 countries, against the general trade analysis, which identifies the biggest importer or exporter.
To discover high-growth global markets and optimize your business strategy:
Click Here
Pricing
- Single User License$ 1,995
- Department License$ 2,400
- Site License$ 3,120
- Global License$ 3,795

Thought Leadership
Search
Thought Leadership and Analyst Meet


Our Clients
Latest Reports
- New Zealand Aseptic Manufacturing Market (2026-2032)
- Netherlands Aseptic Manufacturing Market (2026-2032)
- Nauru Aseptic Manufacturing Market (2026-2032)
- Namibia Aseptic Manufacturing Market (2026-2032)
- Mozambique Aseptic Manufacturing Market (2026-2032)
- Montenegro Aseptic Manufacturing Market (2026-2032)
- Mongolia Aseptic Manufacturing Market (2026-2032)
- Monaco Aseptic Manufacturing Market (2026-2032)
- Micronesia Aseptic Manufacturing Market (2026-2032)
- Mauritius Aseptic Manufacturing Market (2026-2032)
Industry Events and Analyst Meet

HIMTEX 2026

India Refining Summit 2026

India EV Show 2026

EV tech India Expo 2026

Auto Tech Asia 2026
Whitepaper
- Middle East & Africa Commercial Security Market Click here to view more.
- Middle East & Africa Fire Safety Systems & Equipment Market Click here to view more.
- GCC Drone Market Click here to view more.
- Middle East Lighting Fixture Market Click here to view more.
- GCC Physical & Perimeter Security Market Click here to view more.
6WResearch In News
- Doha a strategic location for EV manufacturing hub: IPA Qatar
- Demand for luxury TVs surging in the GCC, says Samsung
- Empowering Growth: The Thriving Journey of Bangladesh’s Cable Industry
- Demand for luxury TVs surging in the GCC, says Samsung
- Video call with a traditional healer? Once unthinkable, it’s now common in South Africa
- Intelligent Buildings To Smooth GCC’s Path To Net Zero