Denmark Switch Gear Market (2025-2031) | Strategy, Consumer Insights, Competition, Industry, Size, Strategic Insights, Analysis, Restraints, Value, Segmentation, Forecast, Companies, Supply, Challenges, Segments, Competitive, Opportunities, Pricing Analysis, Trends, Demand, Share, Growth, Investment Trends, Outlook, Drivers, Revenue
Market Forecast By Product Type (Circuit Breakers, Isolators), By Application (Industrial Power Distribution, Power Grids), By Voltage Rating (Low Voltage, Medium Voltage), By Technology (Vacuum Circuit Breakers, Gas Insulated Switchgear) And Competitive Landscape
| Product Code: ETC10886360 | Publication Date: Apr 2025 | Updated Date: Apr 2026 | Product Type: Market Research Report | |
| Publisher: 6Wresearch | Author: Bhawna Singh | No. of Pages: 65 | No. of Figures: 34 | No. of Tables: 19 |
Denmark Switch Gear Market Size (2020-2030)
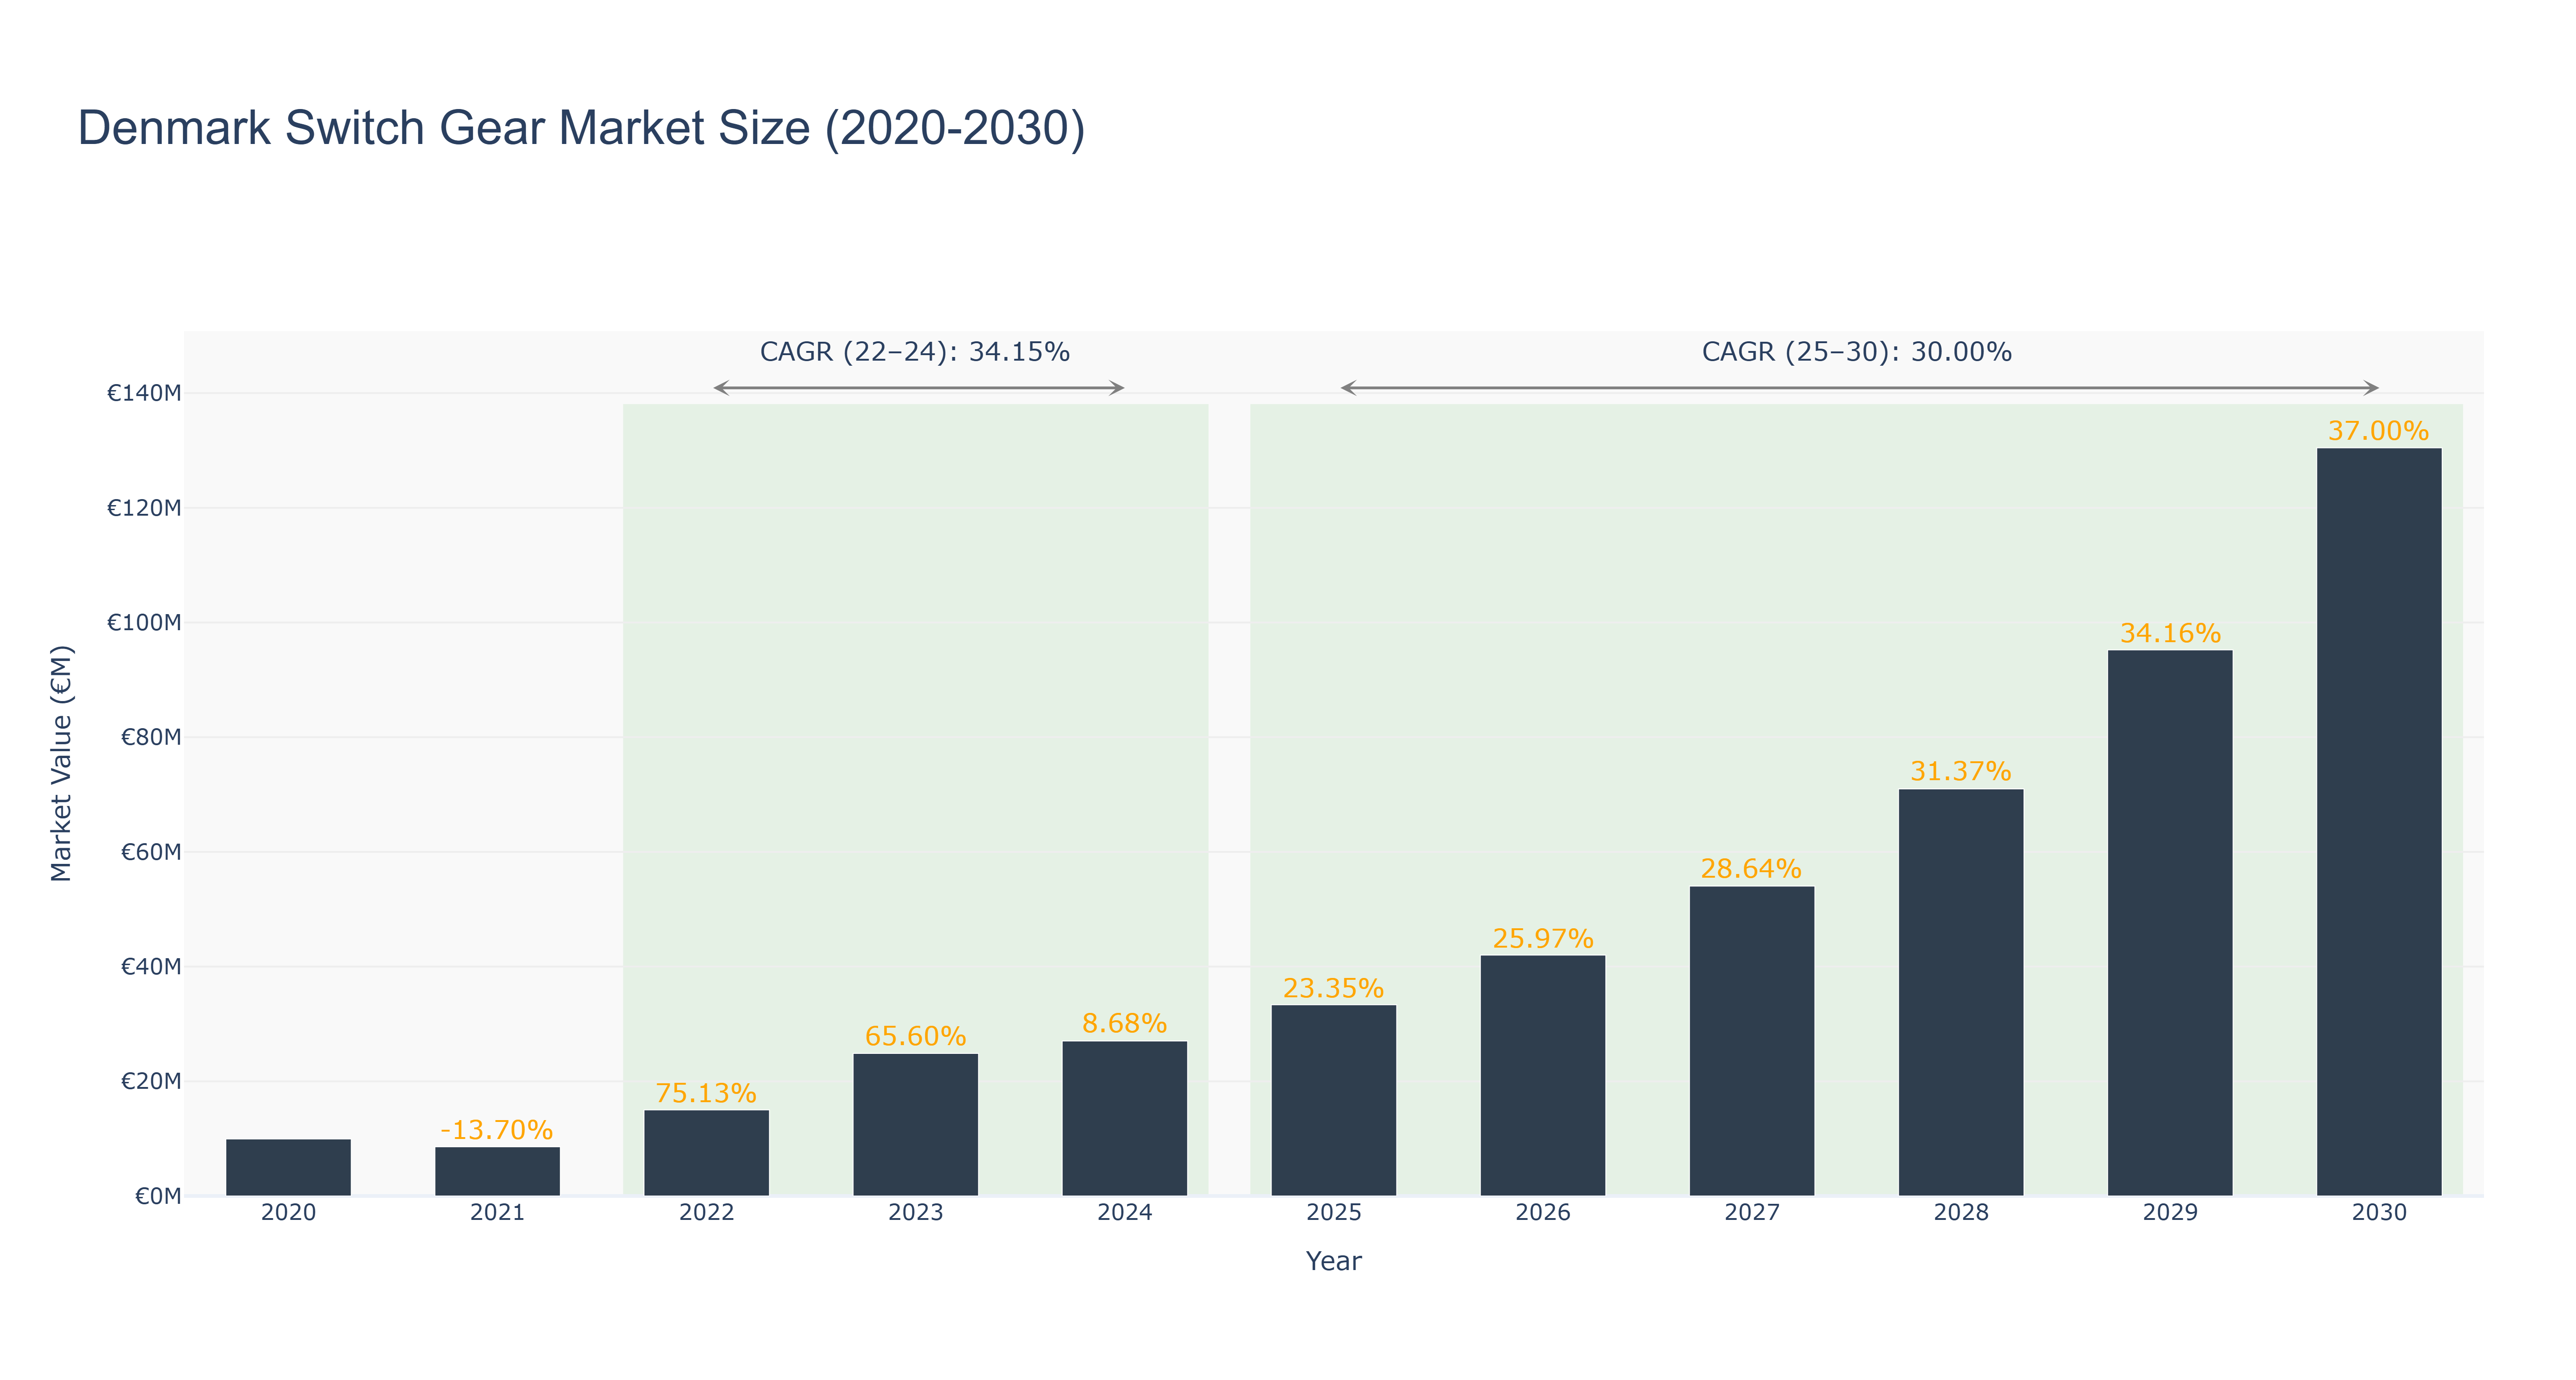
The Denmark Switch Gear Market experienced significant fluctuations between 2020 and 2024, with a peak market size of €24.87 million in 2023, reflecting a remarkable growth of 65.60% from the previous year. The actual data for this period reveals a sharp decline of 13.70% in 2021, followed by a robust recovery in 2022 and sustained growth through 2024, culminating in a market size of €27.03 million in that year, resulting in a compound annual growth rate (CAGR) of 34.15%. Looking ahead, the forecasted period from 2025 to 2030 anticipates continued expansion, with projected market sizes reaching €33.34 million in 2025 and €130.46 million by 2030, supported by a CAGR of 30.00%. Key drivers for this growth include increasing investments in renewable energy and infrastructure modernization efforts, as well as the rising demand for efficient power distribution solutions in Denmark’s evolving energy landscape.
Denmark Switch Gear Market: Production & Trade Performance (2019-2025)
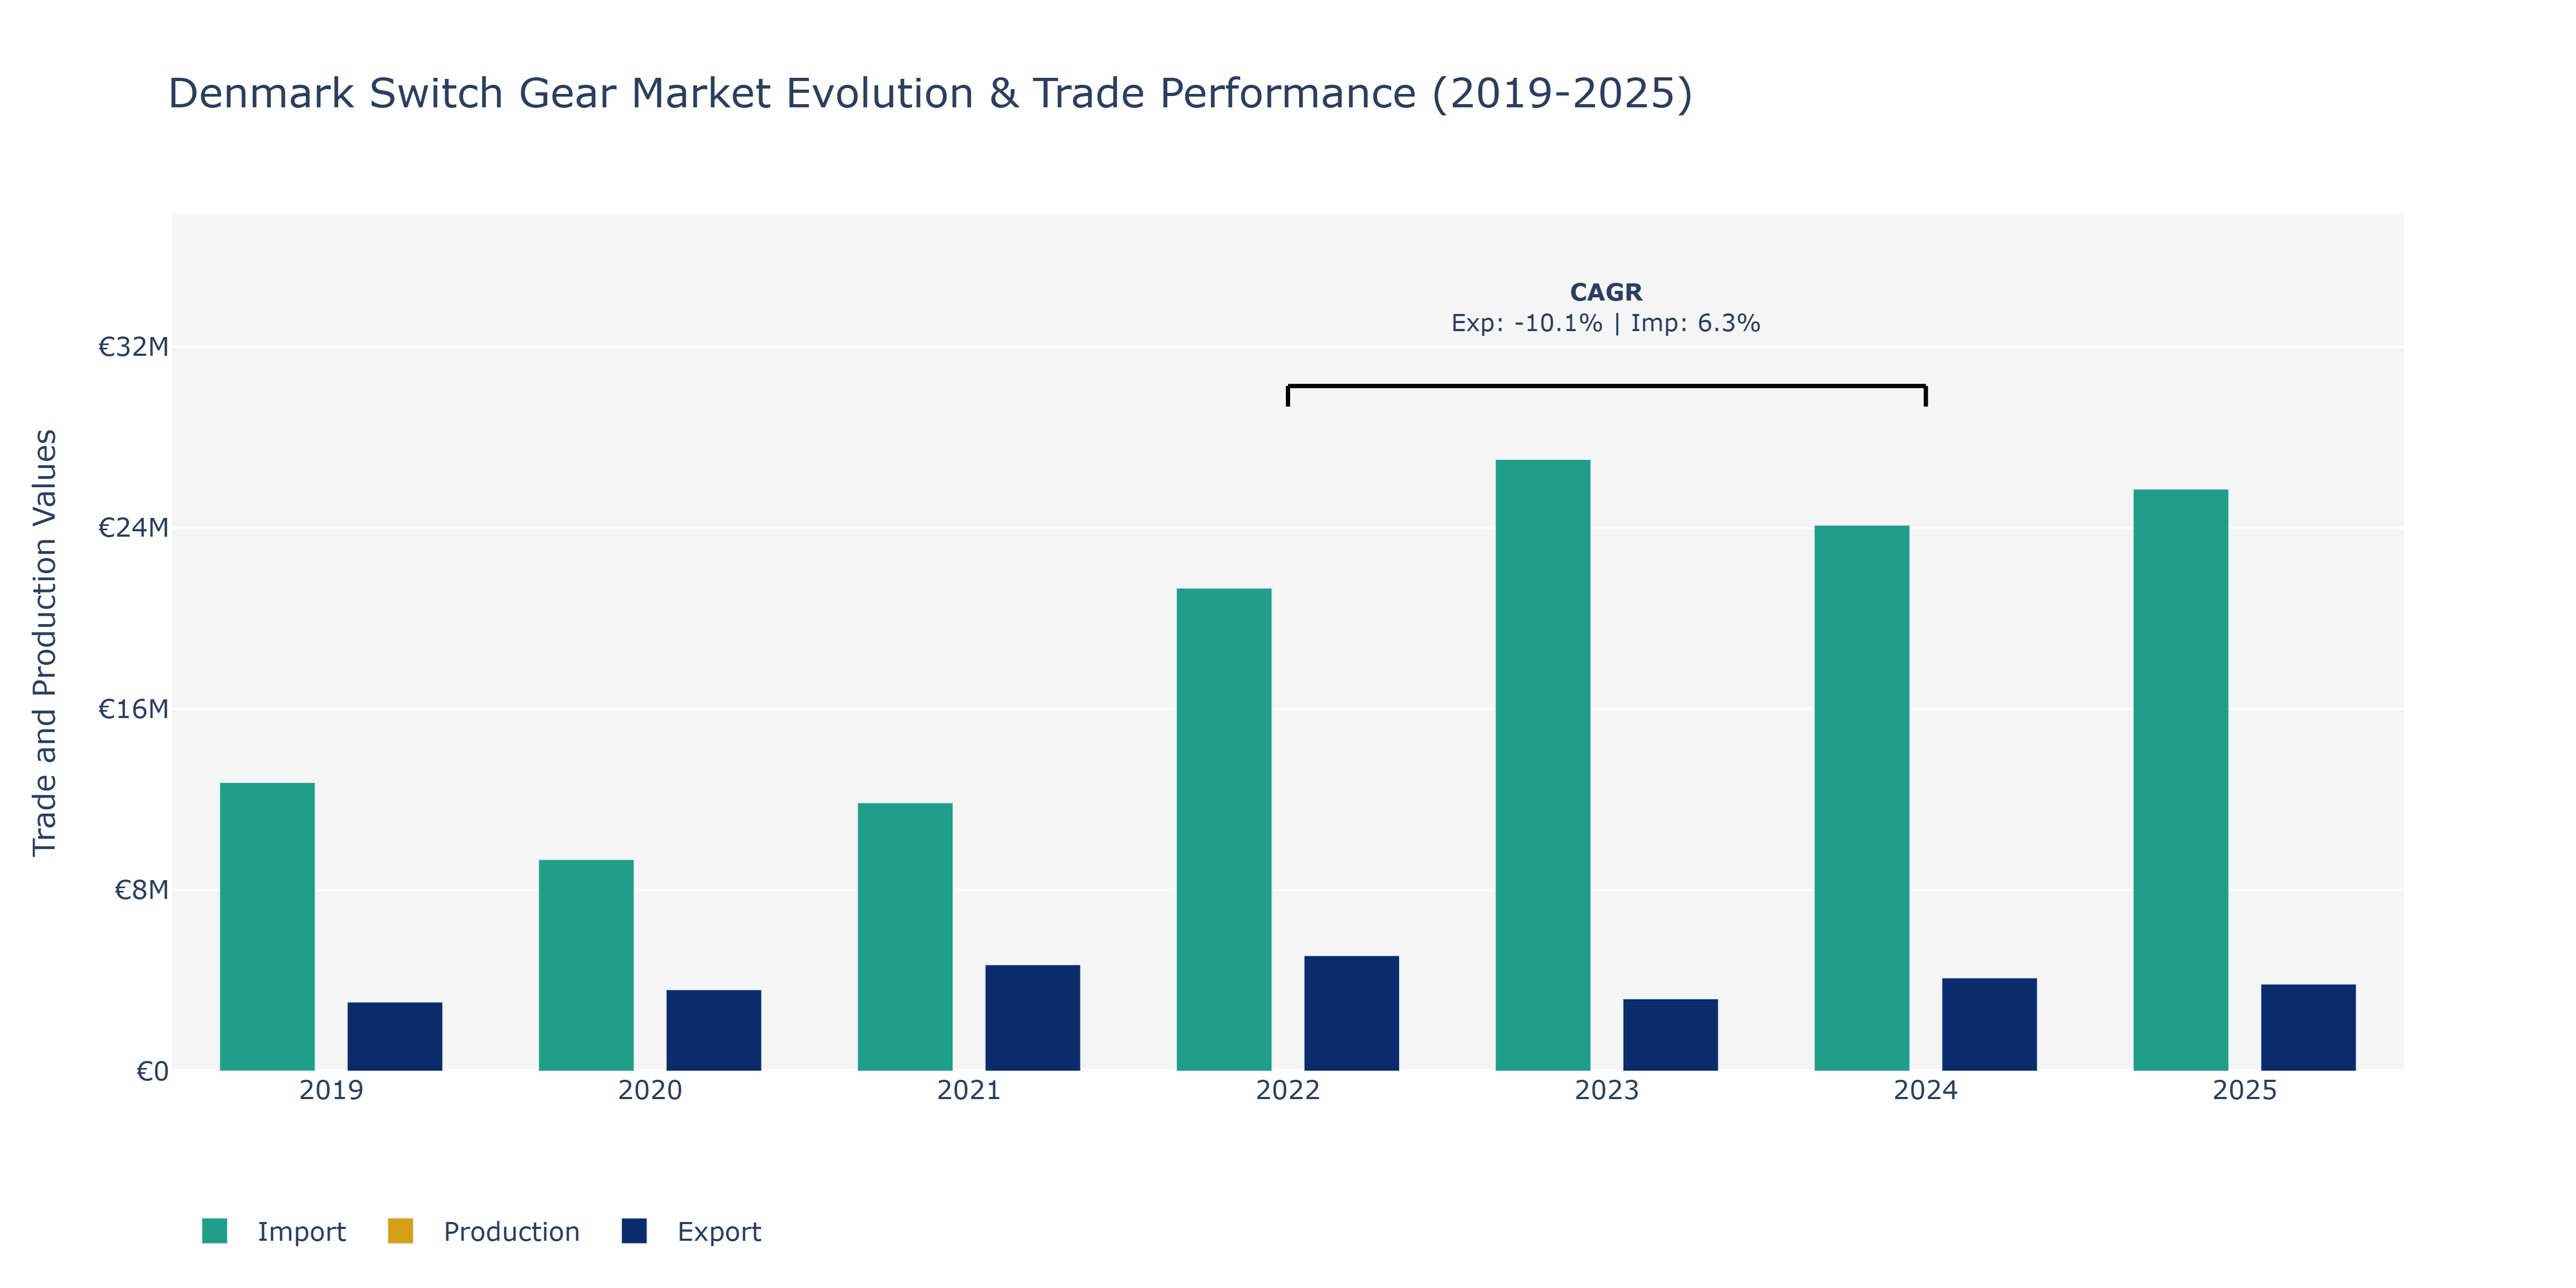
In the Denmark Switch Gear Market, from 2019 to 2025, exports experienced fluctuations, starting at €3.06 million in 2019, reaching a peak of €4.71 million in 2021, then declining to €3.85 million in 2025. Imports followed a similar pattern, starting at €12.75 million in 2019, peaking at €21.32 million in 2022, and then decreasing to €25.71 million in 2025. The decline in exports and production could be attributed to global economic conditions impacting demand for switch gear products. The fluctuating Import value may reflect changes in domestic consumption patterns or shifts in sourcing strategies by domestic manufacturers. Overall, the market shows a dynamic response to both local and international economic factors, requiring industry players to adapt strategies accordingly.
Key Highlights of the Report:
- Denmark Switch Gear Market Outlook
- Market Size of Denmark Switch Gear Market,2024
- Forecast of Denmark Switch Gear Market, 2031
- Historical Data and Forecast of Denmark Switch Gear Revenues & Volume for the Period 2021-2031
- Denmark Switch Gear Market Trend Evolution
- Denmark Switch Gear Market Drivers and Challenges
- Denmark Switch Gear Price Trends
- Denmark Switch Gear Porter's Five Forces
- Denmark Switch Gear Industry Life Cycle
- Historical Data and Forecast of Denmark Switch Gear Market Revenues & Volume By Product Type for the Period 2021-2031
- Historical Data and Forecast of Denmark Switch Gear Market Revenues & Volume By Circuit Breakers for the Period 2021-2031
- Historical Data and Forecast of Denmark Switch Gear Market Revenues & Volume By Isolators for the Period 2021-2031
- Historical Data and Forecast of Denmark Switch Gear Market Revenues & Volume By Application for the Period 2021-2031
- Historical Data and Forecast of Denmark Switch Gear Market Revenues & Volume By Industrial Power Distribution for the Period 2021-2031
- Historical Data and Forecast of Denmark Switch Gear Market Revenues & Volume By Power Grids for the Period 2021-2031
- Historical Data and Forecast of Denmark Switch Gear Market Revenues & Volume By Voltage Rating for the Period 2021-2031
- Historical Data and Forecast of Denmark Switch Gear Market Revenues & Volume By Low Voltage for the Period 2021-2031
- Historical Data and Forecast of Denmark Switch Gear Market Revenues & Volume By Medium Voltage for the Period 2021-2031
- Historical Data and Forecast of Denmark Switch Gear Market Revenues & Volume By Technology for the Period 2021-2031
- Historical Data and Forecast of Denmark Switch Gear Market Revenues & Volume By Vacuum Circuit Breakers for the Period 2021-2031
- Historical Data and Forecast of Denmark Switch Gear Market Revenues & Volume By Gas Insulated Switchgear for the Period 2021-2031
- Denmark Switch Gear Import Export Trade Statistics
- Market Opportunity Assessment By Product Type
- Market Opportunity Assessment By Application
- Market Opportunity Assessment By Voltage Rating
- Market Opportunity Assessment By Technology
- Denmark Switch Gear Top Companies Market Share
- Denmark Switch Gear Competitive Benchmarking By Technical and Operational Parameters
- Denmark Switch Gear Company Profiles
- Denmark Switch Gear Key Strategic Recommendations
Frequently Asked Questions About the Market Study (FAQs):
6Wresearch actively monitors the Denmark Switch Gear Market and publishes its comprehensive annual report, highlighting emerging trends, growth drivers, revenue analysis, and forecast outlook. Our insights help businesses to make data-backed strategic decisions with ongoing market dynamics. Our analysts track relevent industries related to the Denmark Switch Gear Market, allowing our clients with actionable intelligence and reliable forecasts tailored to emerging regional needs.
Yes, we provide customisation as per your requirements. To learn more, feel free to contact us on sales@6wresearch.com
1 Executive Summary |
2 Introduction |
2.1 Key Highlights of the Report |
2.2 Report Description |
2.3 Market Scope & Segmentation |
2.4 Research Methodology |
2.5 Assumptions |
3 Denmark Switch Gear Market Overview |
3.1 Denmark Country Macro Economic Indicators |
3.2 Denmark Switch Gear Market Revenues & Volume, 2021 & 2031F |
3.3 Denmark Switch Gear Market - Industry Life Cycle |
3.4 Denmark Switch Gear Market - Porter's Five Forces |
3.5 Denmark Switch Gear Market Revenues & Volume Share, By Product Type, 2021 & 2031F |
3.6 Denmark Switch Gear Market Revenues & Volume Share, By Application, 2021 & 2031F |
3.7 Denmark Switch Gear Market Revenues & Volume Share, By Voltage Rating, 2021 & 2031F |
3.8 Denmark Switch Gear Market Revenues & Volume Share, By Technology, 2021 & 2031F |
4 Denmark Switch Gear Market Dynamics |
4.1 Impact Analysis |
4.2 Market Drivers |
4.2.1 Increasing demand for renewable energy sources leading to investments in infrastructure, including switch gear equipment. |
4.2.2 Government initiatives promoting energy efficiency and sustainability, driving the adoption of advanced switch gear technologies. |
4.2.3 Growing industrial and commercial sectors requiring reliable and efficient electricity distribution systems. |
4.3 Market Restraints |
4.3.1 High initial investment costs associated with installing and upgrading switch gear systems. |
4.3.2 Regulatory challenges and compliance requirements impacting market entry and expansion. |
4.3.3 Market saturation and intense competition among switch gear manufacturers limiting profit margins. |
5 Denmark Switch Gear Market Trends |
6 Denmark Switch Gear Market, By Types |
6.1 Denmark Switch Gear Market, By Product Type |
6.1.1 Overview and Analysis |
6.1.2 Denmark Switch Gear Market Revenues & Volume, By Product Type, 2021 - 2031F |
6.1.3 Denmark Switch Gear Market Revenues & Volume, By Circuit Breakers, 2021 - 2031F |
6.1.4 Denmark Switch Gear Market Revenues & Volume, By Isolators, 2021 - 2031F |
6.2 Denmark Switch Gear Market, By Application |
6.2.1 Overview and Analysis |
6.2.2 Denmark Switch Gear Market Revenues & Volume, By Industrial Power Distribution, 2021 - 2031F |
6.2.3 Denmark Switch Gear Market Revenues & Volume, By Power Grids, 2021 - 2031F |
6.3 Denmark Switch Gear Market, By Voltage Rating |
6.3.1 Overview and Analysis |
6.3.2 Denmark Switch Gear Market Revenues & Volume, By Low Voltage, 2021 - 2031F |
6.3.3 Denmark Switch Gear Market Revenues & Volume, By Medium Voltage, 2021 - 2031F |
6.4 Denmark Switch Gear Market, By Technology |
6.4.1 Overview and Analysis |
6.4.2 Denmark Switch Gear Market Revenues & Volume, By Vacuum Circuit Breakers, 2021 - 2031F |
6.4.3 Denmark Switch Gear Market Revenues & Volume, By Gas Insulated Switchgear, 2021 - 2031F |
7 Denmark Switch Gear Market Import-Export Trade Statistics |
7.1 Denmark Switch Gear Market Export to Major Countries |
7.2 Denmark Switch Gear Market Imports from Major Countries |
8 Denmark Switch Gear Market Key Performance Indicators |
8.1 Percentage of renewable energy sources in Denmark's total energy mix. |
8.2 Number of government policies and incentives supporting energy efficiency and sustainable practices. |
8.3 Growth rate of industrial and commercial sectors in Denmark. |
9 Denmark Switch Gear Market - Opportunity Assessment |
9.1 Denmark Switch Gear Market Opportunity Assessment, By Product Type, 2021 & 2031F |
9.2 Denmark Switch Gear Market Opportunity Assessment, By Application, 2021 & 2031F |
9.3 Denmark Switch Gear Market Opportunity Assessment, By Voltage Rating, 2021 & 2031F |
9.4 Denmark Switch Gear Market Opportunity Assessment, By Technology, 2021 & 2031F |
10 Denmark Switch Gear Market - Competitive Landscape |
10.1 Denmark Switch Gear Market Revenue Share, By Companies, 2024 |
10.2 Denmark Switch Gear Market Competitive Benchmarking, By Operating and Technical Parameters |
11 Company Profiles |
12 Recommendations |
13 Disclaimer |
Export potential assessment - trade Analytics for 2030
Export potential enables firms to identify high-growth global markets with greater confidence by combining advanced trade intelligence with a structured quantitative methodology. The framework analyzes emerging demand trends and country-level import patterns while integrating macroeconomic and trade datasets such as GDP and population forecasts, bilateral import–export flows, tariff structures, elasticity differentials between developed and developing economies, geographic distance, and import demand projections. Using weighted trade values from 2020–2024 as the base period to project country-to-country export potential for 2030, these inputs are operationalized through calculated drivers such as gravity model parameters, tariff impact factors, and projected GDP per-capita growth. Through an analysis of hidden potentials, demand hotspots, and market conditions that are most favorable to success, this method enables firms to focus on target countries, maximize returns, and global expansion with data, backed by accuracy.
By factoring in the projected importer demand gap that is currently unmet and could be potential opportunity, it identifies the potential for the Exporter (Country) among 190 countries, against the general trade analysis, which identifies the biggest importer or exporter.
To discover high-growth global markets and optimize your business strategy:
Click Here
Pricing
- Single User License$ 1,995
- Department License$ 2,400
- Site License$ 3,120
- Global License$ 3,795

Search
Thought Leadership and Analyst Meet


Our Clients
Latest Reports
- Philippines Polyhydroxybutyrate-co-Hydroxyvalerate Market (2026-2032) | Trends, Insights, Challenges, Restraints, Competition, Size, Value, Forecast, Pricing, Share, Outlook, Revenue, Investment Opportunities, Strategy, Drivers, Demand, Growth, segmentation, Analysis, Companies
- Peru Polyhydroxybutyrate-co-Hydroxyvalerate Market (2026-2032) | Growth, Demand, Challenges, Share, Trends, Analysis, Pricing, Investment Opportunities, Drivers, Value, Forecast, Competition, Size, Companies, Insights, Outlook, Restraints, segmentation, Revenue, Strategy
- Pakistan Polyhydroxybutyrate-co-Hydroxyvalerate Market (2026-2032) | Restraints, segmentation, Pricing, Forecast, Share, Strategy, Competition, Trends, Insights, Drivers, Challenges, Growth, Revenue, Outlook, Value, Investment Opportunities, Companies, Size, Analysis, Demand
- Oman Polyhydroxybutyrate-co-Hydroxyvalerate Market (2026-2032) | Drivers, segmentation, Insights, Competition, Pricing, Outlook, Size, Revenue, Challenges, Forecast, Analysis, Growth, Value, Share, Trends, Investment Opportunities, Strategy, Restraints, Companies, Demand
- Nigeria Polyhydroxybutyrate-co-Hydroxyvalerate Market (2026-2032) | Value, Investment Opportunities, Analysis, Revenue, Restraints, Pricing, Outlook, Competition, Demand, Growth, Forecast, Companies, Trends, Challenges, segmentation, Drivers, Insights, Share, Size, Strategy
- Nepal Polyhydroxybutyrate-co-Hydroxyvalerate Market (2026-2032) | Insights, Analysis, Drivers, Share, Revenue, Demand, segmentation, Investment Opportunities, Competition, Forecast, Growth, Pricing, Companies, Strategy, Trends, Restraints, Challenges, Outlook, Size, Value
- Myanmar Polyhydroxybutyrate-co-Hydroxyvalerate Market (2026-2032) | Outlook, Revenue, Strategy, Restraints, Drivers, segmentation, Share, Forecast, Competition, Insights, Growth, Pricing, Size, Demand, Value, Companies, Trends, Challenges, Investment Opportunities, Analysis
- Morocco Polyhydroxybutyrate-co-Hydroxyvalerate Market (2026-2032) | Outlook, Investment Opportunities, Restraints, Strategy, Forecast, Challenges, Drivers, Growth, Companies, segmentation, Trends, Size, Competition, Revenue, Demand, Insights, Share, Analysis, Value, Pricing
- Mexico Polyhydroxybutyrate-co-Hydroxyvalerate Market (2026-2032) | Size, Drivers, Outlook, Share, Strategy, Growth, Pricing, Challenges, Companies, Demand, Value, Investment Opportunities, Restraints, Trends, Forecast, segmentation, Analysis, Insights, Competition, Revenue
- Malaysia Polyhydroxybutyrate-co-Hydroxyvalerate Market (2026-2032) | Share, segmentation, Size, Companies, Analysis, Insights, Forecast, Value, Revenue, Drivers, Restraints, Challenges, Investment Opportunities, Trends, Competition, Strategy, Demand, Growth, Outlook, Pricing
Industry Events and Analyst Meet

HIMTEX 2026

India Refining Summit 2026

India EV Show 2026

EV tech India Expo 2026

Auto Tech Asia 2026
Whitepaper
- Middle East & Africa Commercial Security Market Click here to view more.
- Middle East & Africa Fire Safety Systems & Equipment Market Click here to view more.
- GCC Drone Market Click here to view more.
- Middle East Lighting Fixture Market Click here to view more.
- GCC Physical & Perimeter Security Market Click here to view more.
6WResearch In News
- Doha a strategic location for EV manufacturing hub: IPA Qatar
- Demand for luxury TVs surging in the GCC, says Samsung
- Empowering Growth: The Thriving Journey of Bangladesh’s Cable Industry
- Demand for luxury TVs surging in the GCC, says Samsung
- Video call with a traditional healer? Once unthinkable, it’s now common in South Africa
- Intelligent Buildings To Smooth GCC’s Path To Net Zero