Denmark Synthetic Tannins Market (2026-2032) | Growth, Industry, Forecast, Value, Share, Size & Revenue, Competitive Landscape, Outlook, Segmentation, Companies, Analysis, Trends
Market Forecast By Type (Hydrolyzable, Condensed), By Application (Pharmaceutical Industry, Food Industry, Paper Industry, Textile Industry, Others) And Competitive Landscape
| Product Code: ETC6971135 | Publication Date: Sep 2024 | Updated Date: Apr 2026 | Product Type: Market Research Report | |
| Publisher: 6Wresearch | Author: Dhaval Chaurasia | No. of Pages: 75 | No. of Figures: 35 | No. of Tables: 20 |
Denmark Synthetic Tannins Market Size (2020-2030)
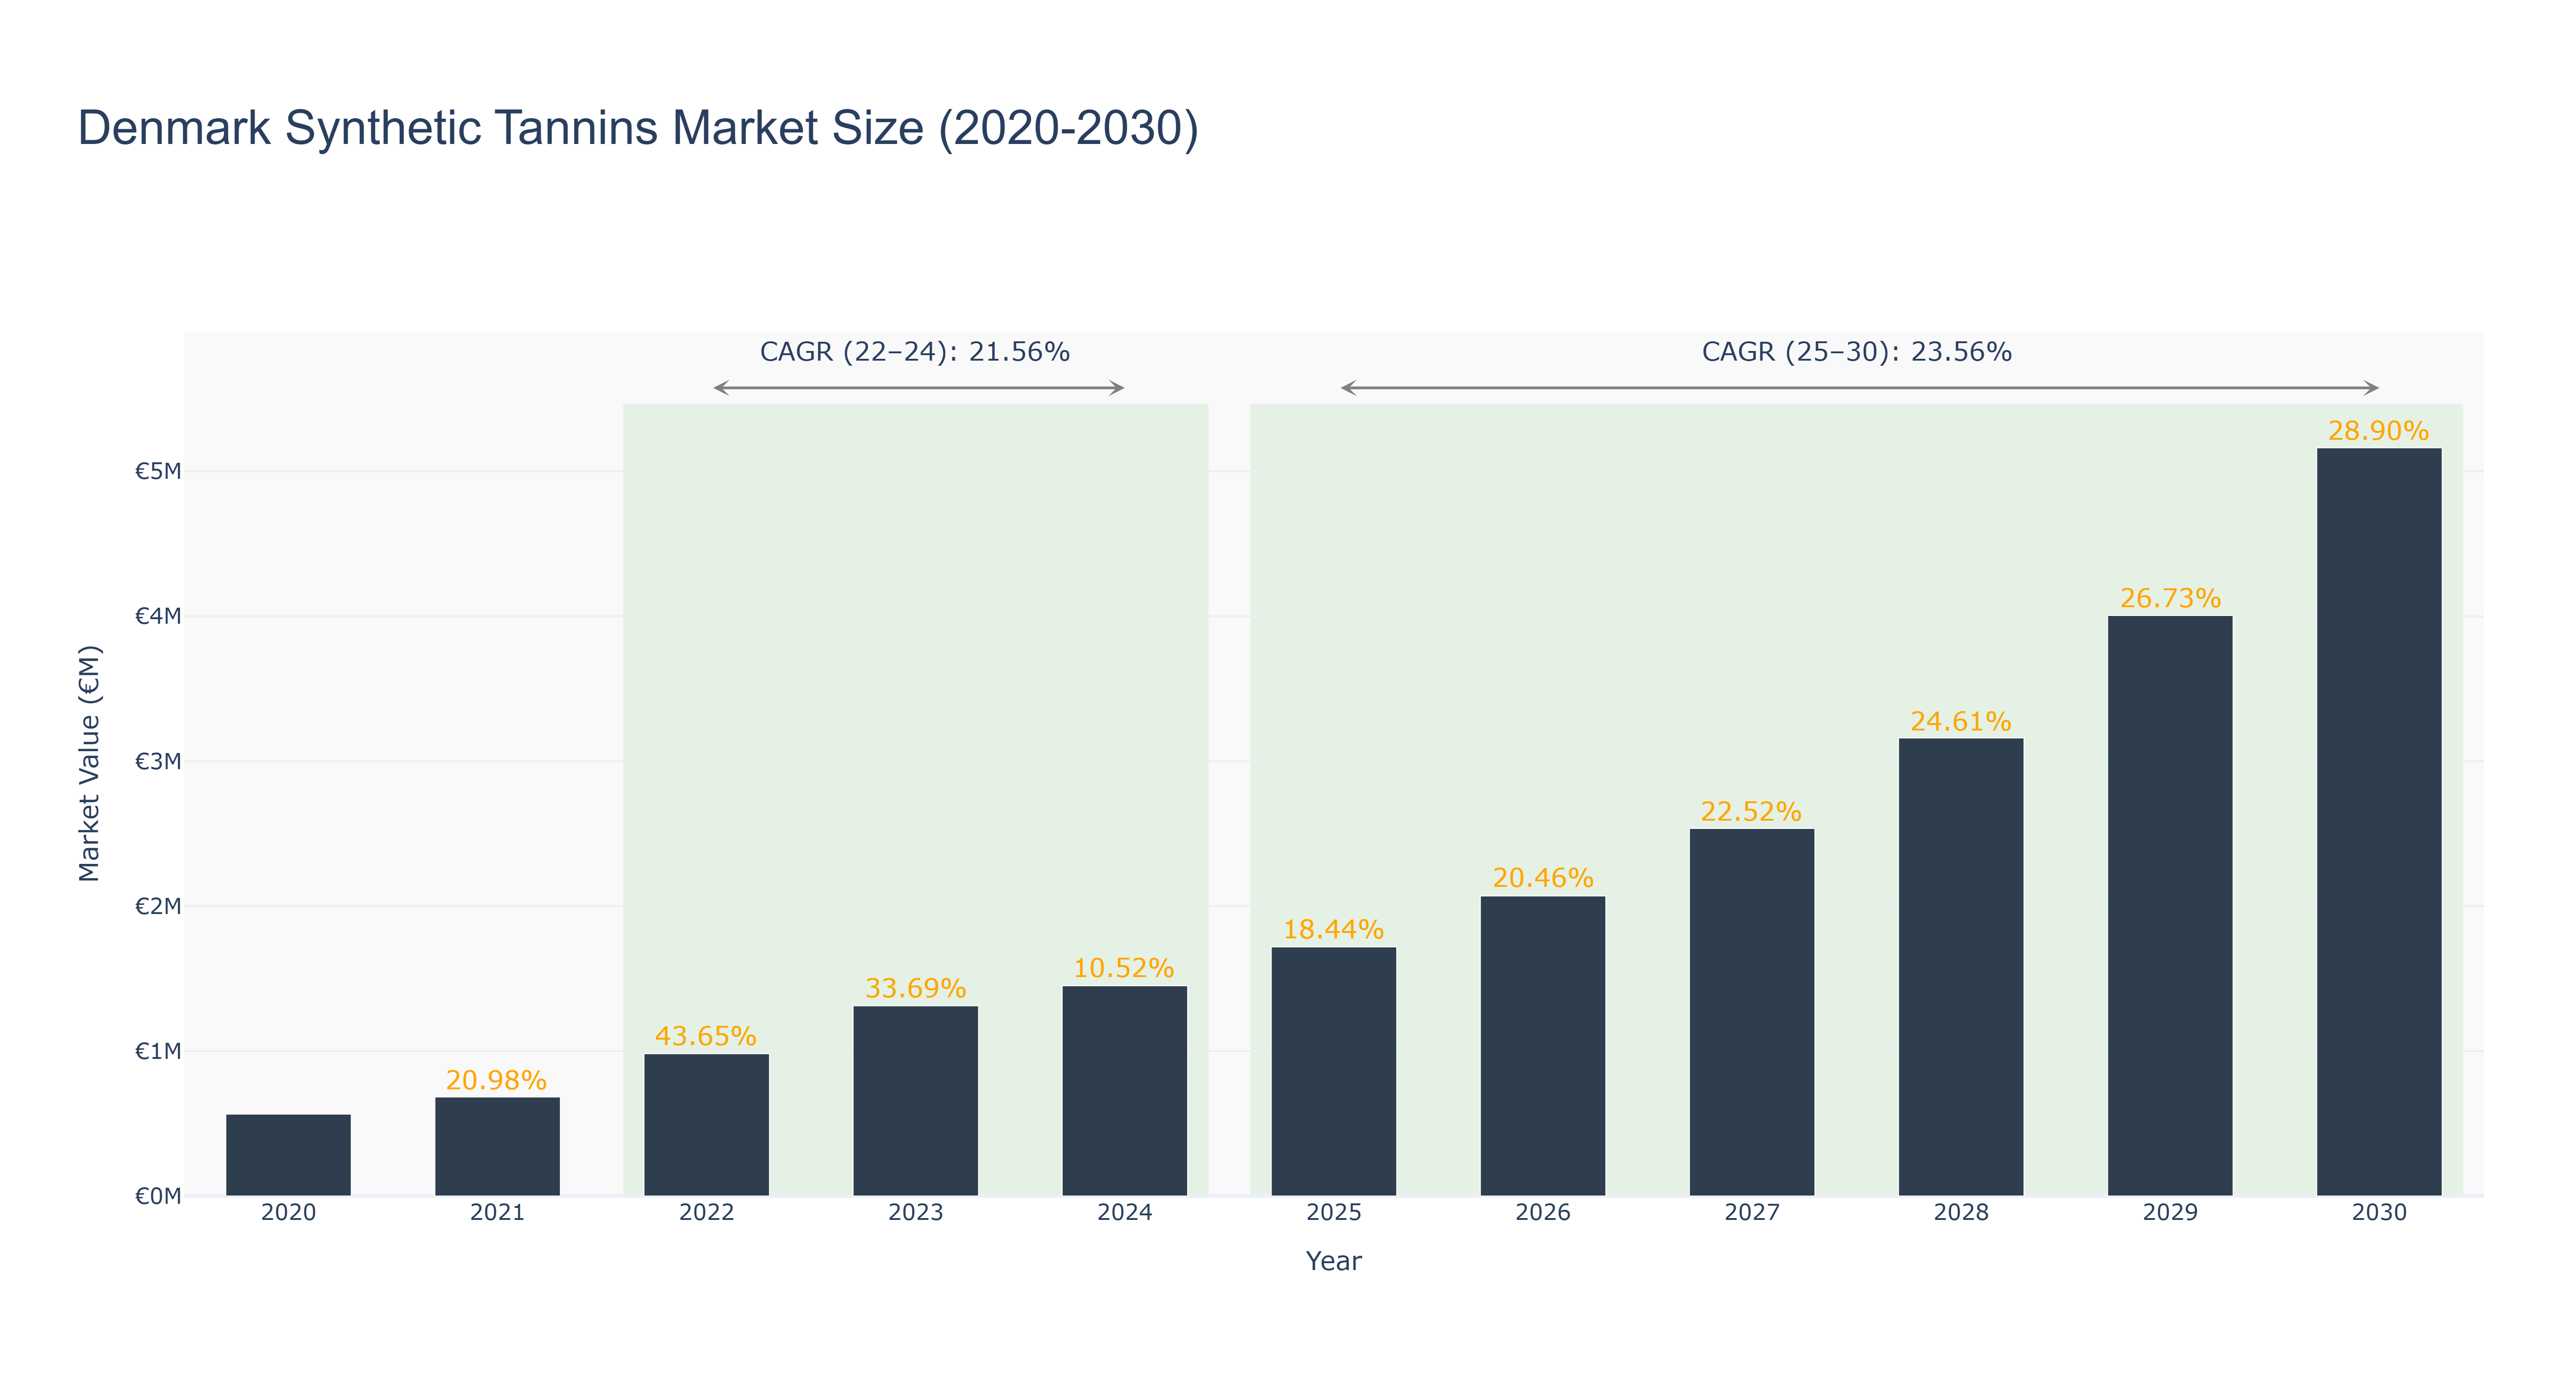
The Denmark Synthetic Tannins Market has shown remarkable growth from €564.98 thousand in 2020 to €1.45 million in 2024, with an impressive CAGR of 21.56% from 2022 to 2024. Notable year-on-year increases include a peak market size of €1.31 million in 2023, driven by heightened demand for eco-friendly and sustainable materials in various industries, including leather and textiles. As we transition to the forecasted period from 2025 to 2030, the market is projected to continue its upward trajectory, reaching €5.16 million by 2030, with a robust CAGR of 23.56%. This growth is anticipated due to ongoing innovations in synthetic tanning processes and a shift towards sustainable practices amid increasing regulatory pressures. Additionally, the rise of the circular economy will likely bolster demand, as industries seek to reduce waste and improve resource efficiency in production processes.
Denmark Synthetic Tannins Market: Production & Trade Performance (2019-2025)
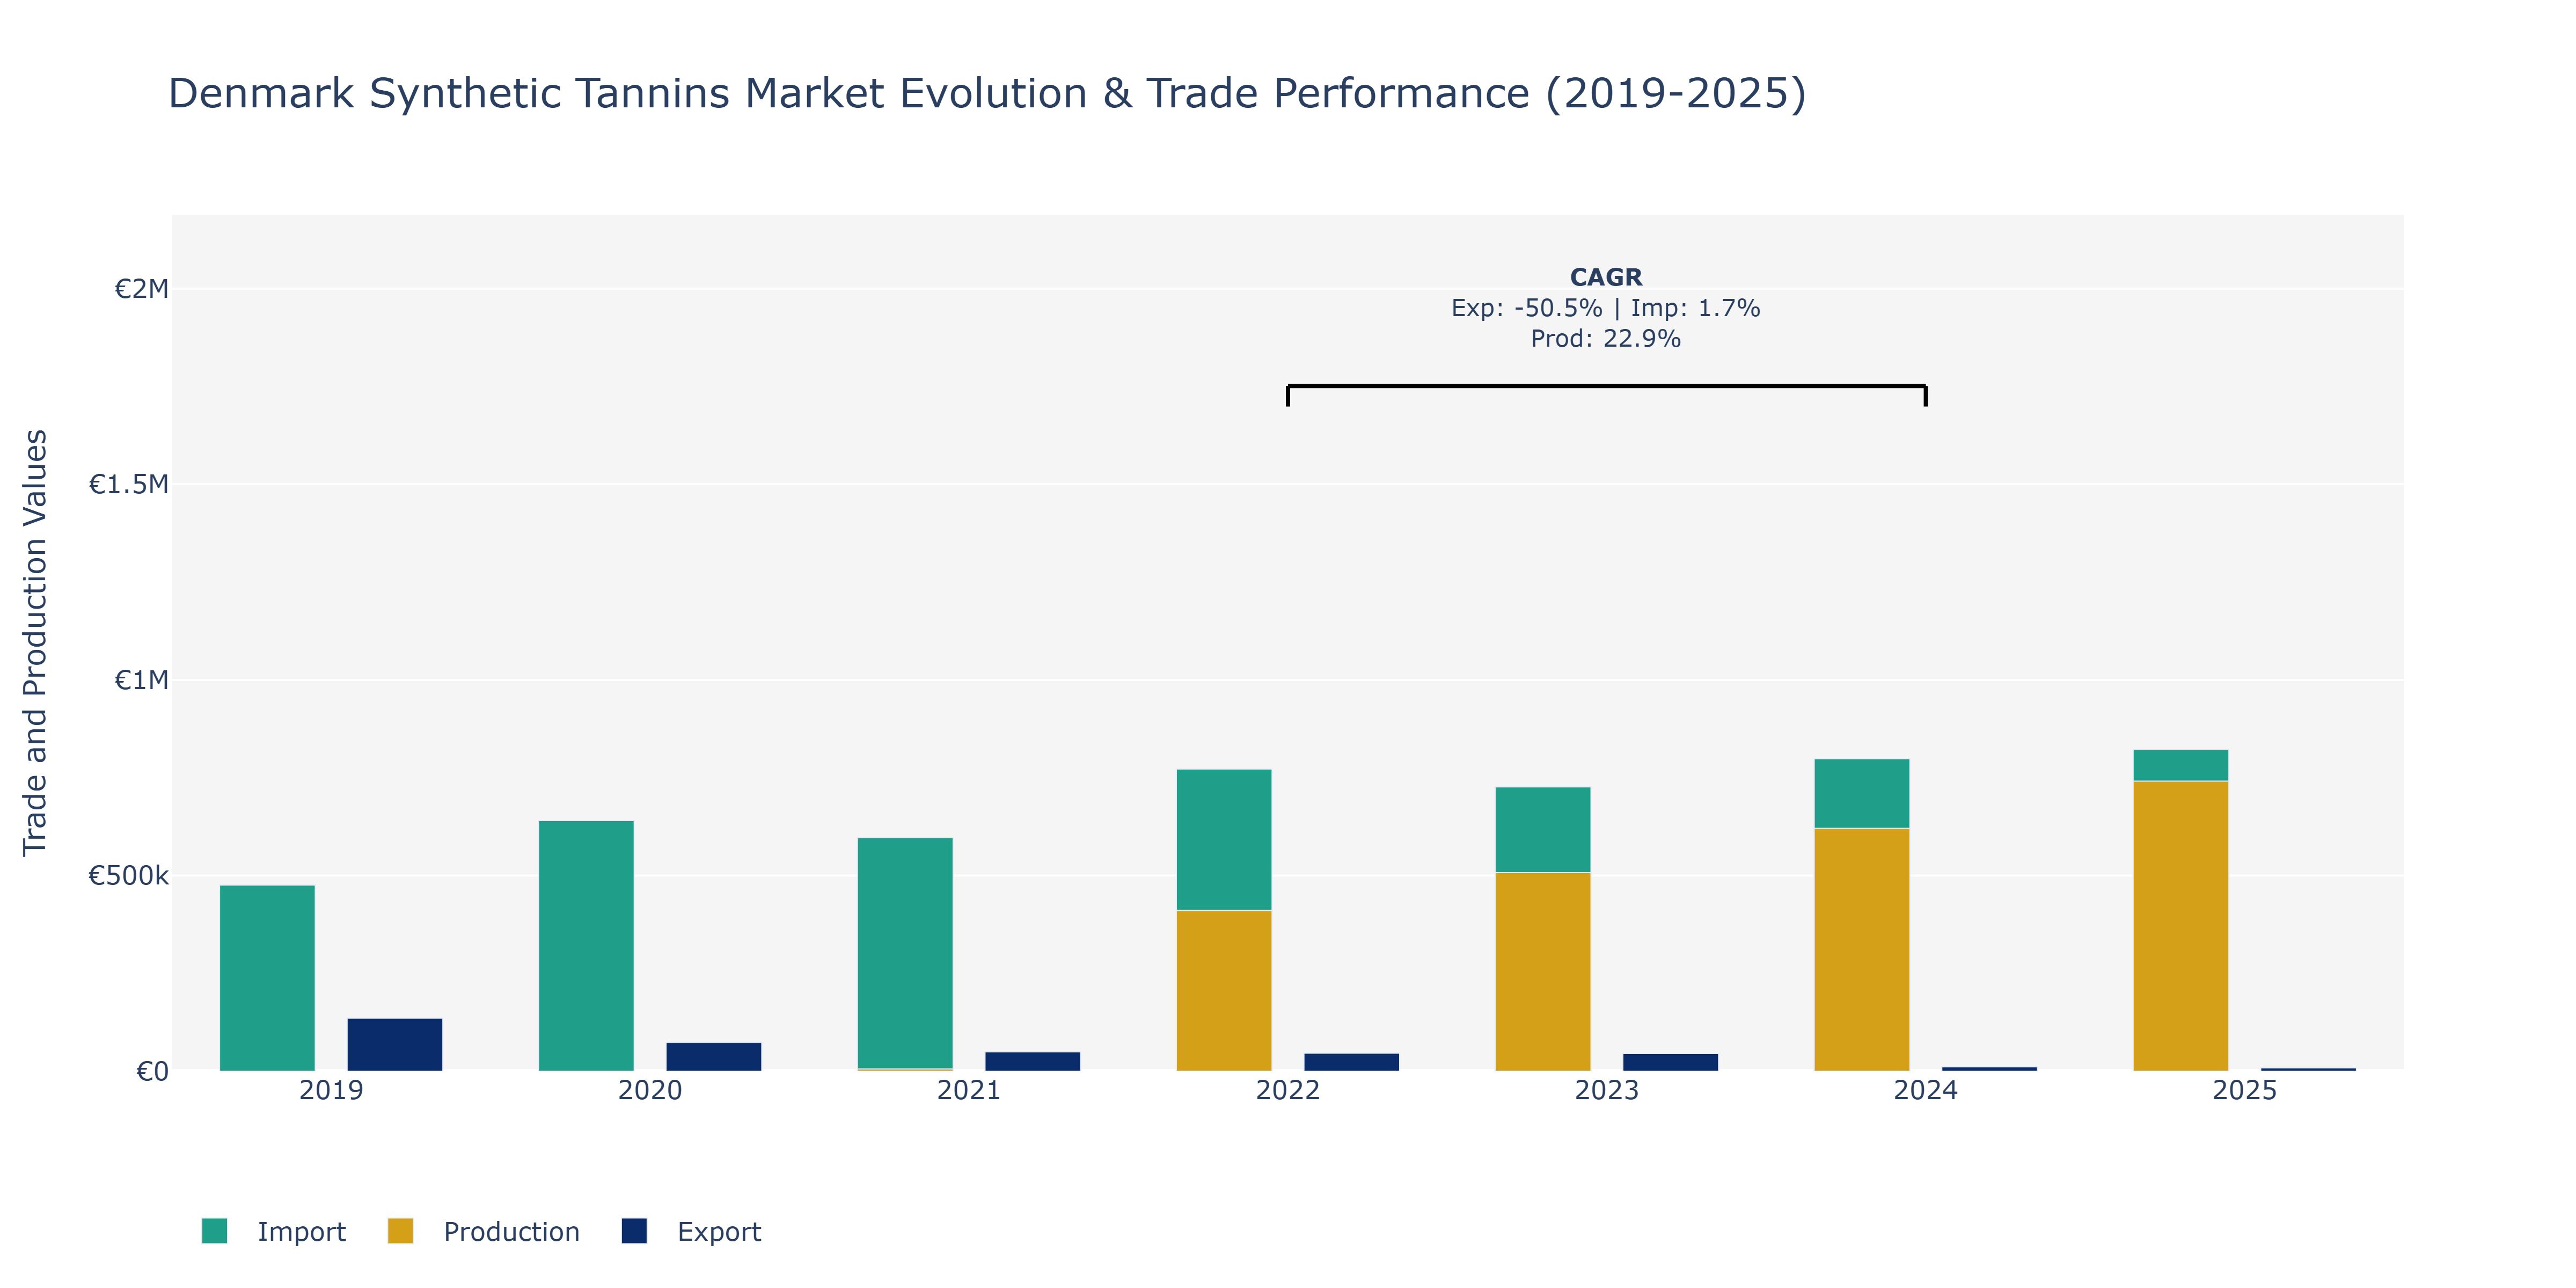
Between 2019 and 2025, Denmark's Synthetic Tannins market witnessed varying trends in exports, imports, and production. Exports declined sharply from €135.45 thousand in 2019 to around €8.48 thousand in 2025. This significant drop may be attributed to changing global demand patterns, increased competition, or shifts in consumer preferences towards alternative products. Conversely, imports surged consistently from €475.68 thousand in 2019 to approximately €822.15 thousand in 2025, indicating a growing reliance on foreign sources to meet domestic demand. Production levels fluctuated, with a notable peak of €741.36 thousand in 2025, reflecting potential capacity expansions or technological advancements within the domestic industry. The contrasting movements in exports, imports, and production suggest a complex interplay of factors influencing the Synthetic Tannins market in Denmark, potentially including evolving trade dynamics, regulatory changes, and strategic business decisions by key market players.
Key Highlights of the Report:
- Denmark Synthetic Tannins Market Outlook
- Market Size of Denmark Synthetic Tannins Market, 2025
- Forecast of Denmark Synthetic Tannins Market, 2032
- Historical Data and Forecast of Denmark Synthetic Tannins Revenues & Volume for the Period 2022 - 2032
- Denmark Synthetic Tannins Market Trend Evolution
- Denmark Synthetic Tannins Market Drivers and Challenges
- Denmark Synthetic Tannins Price Trends
- Denmark Synthetic Tannins Porter's Five Forces
- Denmark Synthetic Tannins Industry Life Cycle
- Historical Data and Forecast of Denmark Synthetic Tannins Market Revenues & Volume By Type for the Period 2022 - 2032
- Historical Data and Forecast of Denmark Synthetic Tannins Market Revenues & Volume By Hydrolyzable for the Period 2022 - 2032
- Historical Data and Forecast of Denmark Synthetic Tannins Market Revenues & Volume By Condensed for the Period 2022 - 2032
- Historical Data and Forecast of Denmark Synthetic Tannins Market Revenues & Volume By Application for the Period 2022 - 2032
- Historical Data and Forecast of Denmark Synthetic Tannins Market Revenues & Volume By Pharmaceutical Industry for the Period 2022 - 2032
- Historical Data and Forecast of Denmark Synthetic Tannins Market Revenues & Volume By Food Industry for the Period 2022 - 2032
- Historical Data and Forecast of Denmark Synthetic Tannins Market Revenues & Volume By Paper Industry for the Period 2022 - 2032
- Historical Data and Forecast of Denmark Synthetic Tannins Market Revenues & Volume By Textile Industry for the Period 2022 - 2032
- Historical Data and Forecast of Denmark Synthetic Tannins Market Revenues & Volume By Others for the Period 2022 - 2032
- Denmark Synthetic Tannins Import Export Trade Statistics
- Market Opportunity Assessment By Type
- Market Opportunity Assessment By Application
- Denmark Synthetic Tannins Top Companies Market Share
- Denmark Synthetic Tannins Competitive Benchmarking By Technical and Operational Parameters
- Denmark Synthetic Tannins Company Profiles
- Denmark Synthetic Tannins Key Strategic Recommendations
Frequently Asked Questions About the Market Study (FAQs):
6Wresearch actively monitors the Denmark Synthetic Tannins Market and publishes its comprehensive annual report, highlighting emerging trends, growth drivers, revenue analysis, and forecast outlook. Our insights help businesses to make data-backed strategic decisions with ongoing market dynamics. Our analysts track relevent industries related to the Denmark Synthetic Tannins Market, allowing our clients with actionable intelligence and reliable forecasts tailored to emerging regional needs.
Yes, we provide customisation as per your requirements. To learn more, feel free to contact us on sales@6wresearch.com
1 Executive Summary |
2 Introduction |
2.1 Key Highlights of the Report |
2.2 Report Description |
2.3 Market Scope & Segmentation |
2.4 Research Methodology |
2.5 Assumptions |
3 Denmark Synthetic Tannins Market Overview |
3.1 Denmark Country Macro Economic Indicators |
3.2 Denmark Synthetic Tannins Market Revenues & Volume, 2022 & 2032F |
3.3 Denmark Synthetic Tannins Market - Industry Life Cycle |
3.4 Denmark Synthetic Tannins Market - Porter's Five Forces |
3.5 Denmark Synthetic Tannins Market Revenues & Volume Share, By Type, 2022 & 2032F |
3.6 Denmark Synthetic Tannins Market Revenues & Volume Share, By Application, 2022 & 2032F |
4 Denmark Synthetic Tannins Market Dynamics |
4.1 Impact Analysis |
4.2 Market Drivers |
4.2.1 Growing demand for eco-friendly tanning agents |
4.2.2 Increasing focus on sustainable practices in the leather industry |
4.2.3 Rising awareness about the benefits of synthetic tannins in leather processing |
4.3 Market Restraints |
4.3.1 Stringent regulations on chemical usage in tanneries |
4.3.2 Fluctuating prices of raw materials for synthetic tannins |
4.3.3 Competition from natural tannins in the market |
5 Denmark Synthetic Tannins Market Trends |
6 Denmark Synthetic Tannins Market, By Types |
6.1 Denmark Synthetic Tannins Market, By Type |
6.1.1 Overview and Analysis |
6.1.2 Denmark Synthetic Tannins Market Revenues & Volume, By Type, 2022 - 2032F |
6.1.3 Denmark Synthetic Tannins Market Revenues & Volume, By Hydrolyzable, 2022 - 2032F |
6.1.4 Denmark Synthetic Tannins Market Revenues & Volume, By Condensed, 2022 - 2032F |
6.2 Denmark Synthetic Tannins Market, By Application |
6.2.1 Overview and Analysis |
6.2.2 Denmark Synthetic Tannins Market Revenues & Volume, By Pharmaceutical Industry, 2022 - 2032F |
6.2.3 Denmark Synthetic Tannins Market Revenues & Volume, By Food Industry, 2022 - 2032F |
6.2.4 Denmark Synthetic Tannins Market Revenues & Volume, By Paper Industry, 2022 - 2032F |
6.2.5 Denmark Synthetic Tannins Market Revenues & Volume, By Textile Industry, 2022 - 2032F |
6.2.6 Denmark Synthetic Tannins Market Revenues & Volume, By Others, 2022 - 2032F |
7 Denmark Synthetic Tannins Market Import-Export Trade Statistics |
7.1 Denmark Synthetic Tannins Market Export to Major Countries |
7.2 Denmark Synthetic Tannins Market Imports from Major Countries |
8 Denmark Synthetic Tannins Market Key Performance Indicators |
8.1 Percentage of tanneries adopting synthetic tannins in their production processes |
8.2 Research and development investment in innovative synthetic tannin technologies |
8.3 Number of partnerships or collaborations between tannin suppliers and leather manufacturers |
9 Denmark Synthetic Tannins Market - Opportunity Assessment |
9.1 Denmark Synthetic Tannins Market Opportunity Assessment, By Type, 2022 & 2032F |
9.2 Denmark Synthetic Tannins Market Opportunity Assessment, By Application, 2022 & 2032F |
10 Denmark Synthetic Tannins Market - Competitive Landscape |
10.1 Denmark Synthetic Tannins Market Revenue Share, By Companies, 2025 |
10.2 Denmark Synthetic Tannins Market Competitive Benchmarking, By Operating and Technical Parameters |
11 Company Profiles |
12 Recommendations |
13 Disclaimer |
Export potential assessment - trade Analytics for 2030
Export potential enables firms to identify high-growth global markets with greater confidence by combining advanced trade intelligence with a structured quantitative methodology. The framework analyzes emerging demand trends and country-level import patterns while integrating macroeconomic and trade datasets such as GDP and population forecasts, bilateral import–export flows, tariff structures, elasticity differentials between developed and developing economies, geographic distance, and import demand projections. Using weighted trade values from 2020–2024 as the base period to project country-to-country export potential for 2030, these inputs are operationalized through calculated drivers such as gravity model parameters, tariff impact factors, and projected GDP per-capita growth. Through an analysis of hidden potentials, demand hotspots, and market conditions that are most favorable to success, this method enables firms to focus on target countries, maximize returns, and global expansion with data, backed by accuracy.
By factoring in the projected importer demand gap that is currently unmet and could be potential opportunity, it identifies the potential for the Exporter (Country) among 190 countries, against the general trade analysis, which identifies the biggest importer or exporter.
To discover high-growth global markets and optimize your business strategy:
Click Here
Pricing
- Single User License$ 1,995
- Department License$ 2,400
- Site License$ 3,120
- Global License$ 3,795

Search
Thought Leadership and Analyst Meet


Our Clients
Latest Reports
- India Ultrasonic Smart Water Meter Market (2026-2032) | Outlook, Competition, Drivers, Trends, Demand, Competitive, Strategic Insights, Companies, Challenges, Strategy, Consumer Insights, Analysis, Opportunities, Growth, Size, Share, Industry, Revenue, Segments, Value, Segmentation, Supply, Forecast, Restraints,
- India Electromagnetic Bulk Flow Meter Market (2026-2032) | Analysis, Challenges, Strategic Insights, Supply, Forecast, Growth, Share, Consumer Insights, Competitive, Value, Outlook, Size & Demand,
- India Battery Powered Bulk Flow Meter Market (2026-2032) | Outlook, Analysis, Competitive Landscape, Growth, Size, Trends, Value, Revenue, Companies, Segmentation, Share & Forecast
- Bosnia and Herzegovina Fuel-Efficient Winglets Market (2026-2032) | Growth, Competition, Strategy, Restraints, Trends, Challenges, segmentation, Value, Outlook, Investment Opportunities, Analysis, Revenue, Companies, Insights, Pricing, Size, Drivers, Demand, Share, Forecast
- Canada Cloud CFD Market (2026-2032) | Size & Revenue, Industry, Growth, Competitive Landscape, Forecast, Segmentation, Value, Outlook, Trends, Share, Analysis, Companies
- Taiwan Food Delivery Platform Market (2026-2032) | Companies, Outlook, Analysis, Trends, Value, Revenue, Segmentation, Share, Forecast, Competitive Landscape, Growth, Size & Forecast
- United Kingdom (UK) Long-term Care Insurance Market (2026-2032) | Growth, Share, Consumer Insights, Drivers, Opportunities, Competition, Pricing Analysis, Segments, Restraints, Companies, Competitive, Value, Outlook, Size, Demand, Analysis, Challenges, Strategic Insights, Investment Trends, Revenue, Trends, Supply, Forecast
- United Kingdom (UK) Long Term Care Market (2026-2032) | Companies, Outlook, Analysis, Trends, Value, Revenue, Segmentation, Share, Forecast, Competitive Landscape, Growth, Size & Forecast
- Iraq Insulation and Waterproofing Market (2026-2032) | Outlook, Drivers, Growth, Size, Share, Industry, Revenue, Trends, Demand, Competitive, Strategic Insights, Opportunities, Segments, Companies, Challenges, Strategy, Consumer Insights, Analysis, Investment Trends, Value, Segmentation, Forecast, Restraints
- India Switchgear Market Outlook (2026-2032) | Size, Share, Trends, Growth, Revenue, Forecast, Analysis, Value, Outlook
Industry Events and Analyst Meet

HIMTEX 2026

India Refining Summit 2026

India EV Show 2026

EV tech India Expo 2026

Auto Tech Asia 2026
Whitepaper
- Middle East & Africa Commercial Security Market Click here to view more.
- Middle East & Africa Fire Safety Systems & Equipment Market Click here to view more.
- GCC Drone Market Click here to view more.
- Middle East Lighting Fixture Market Click here to view more.
- GCC Physical & Perimeter Security Market Click here to view more.
6WResearch In News
- Doha a strategic location for EV manufacturing hub: IPA Qatar
- Demand for luxury TVs surging in the GCC, says Samsung
- Empowering Growth: The Thriving Journey of Bangladesh’s Cable Industry
- Demand for luxury TVs surging in the GCC, says Samsung
- Video call with a traditional healer? Once unthinkable, it’s now common in South Africa
- Intelligent Buildings To Smooth GCC’s Path To Net Zero